ℹ How to read these plots
- Motivation
- Pāṇini classifies the 25 sparśa consonants by sthāna (place of articulation). This page asks: does that classification correspond to measurable acoustic differences in the consonant itself, independent of the vowel context? The five column-1 consonants — one per varga — are examined across three vowel contexts (अ, इ, उ) to isolate what belongs to the consonant alone.
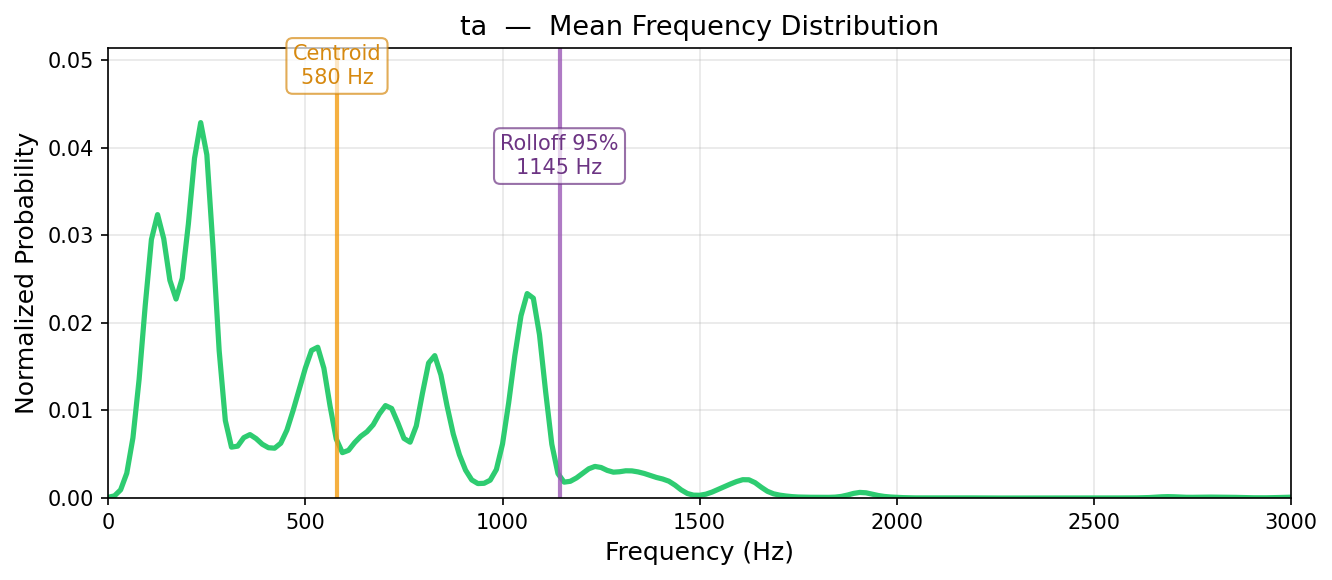
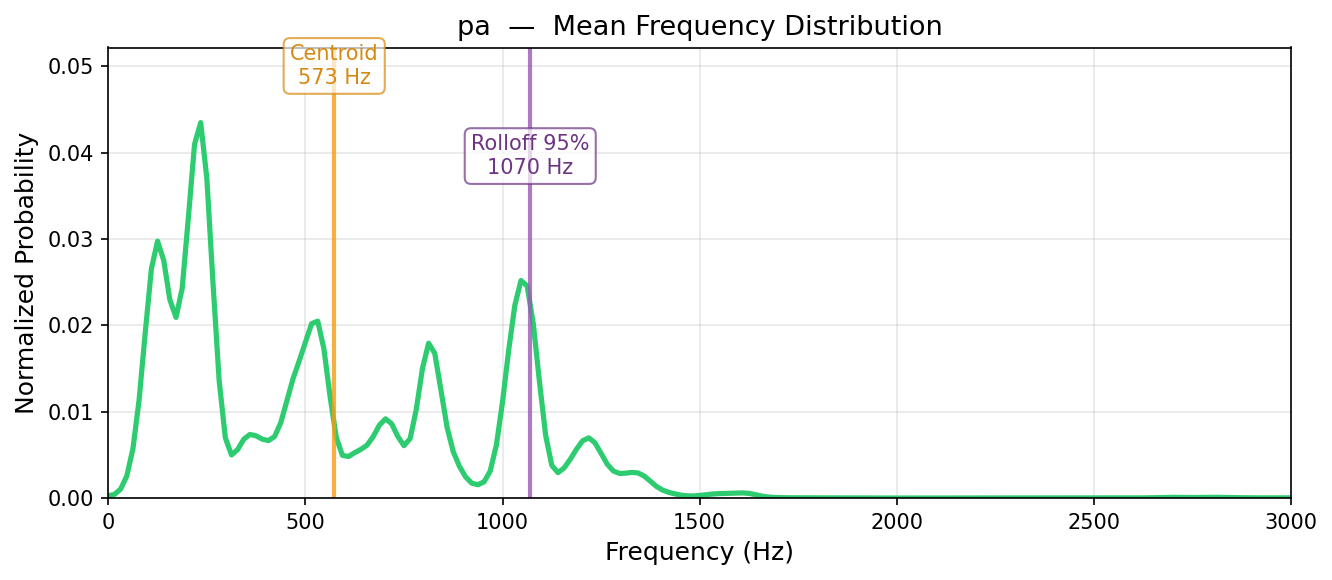
- Row 1 — Full Syllable (reference)
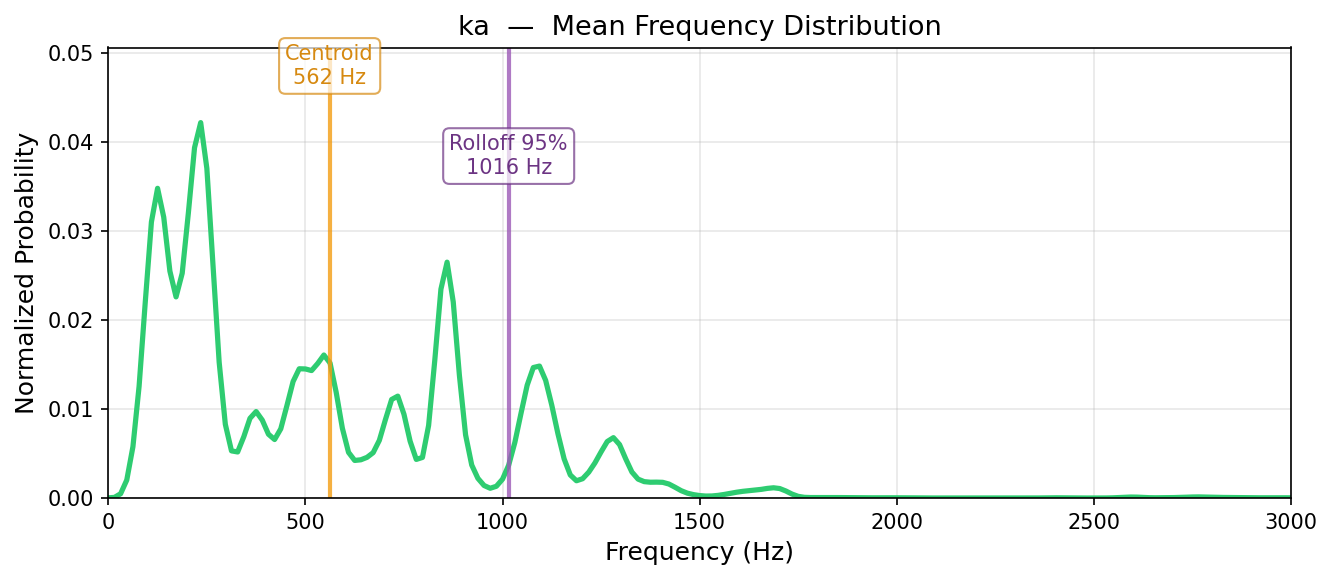
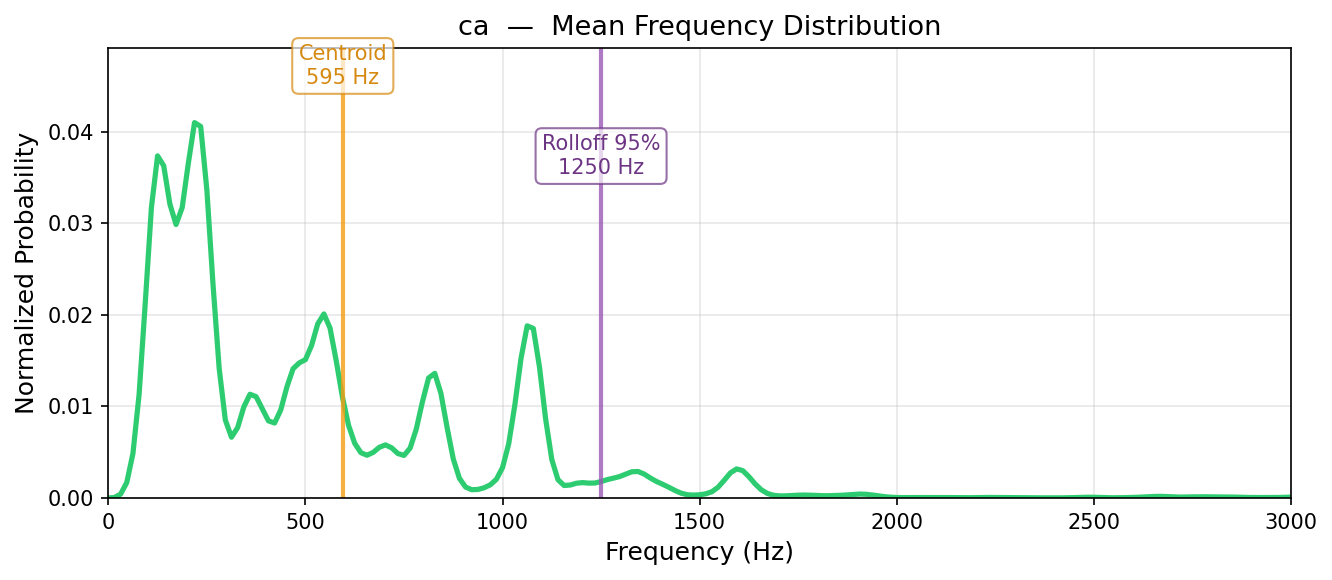
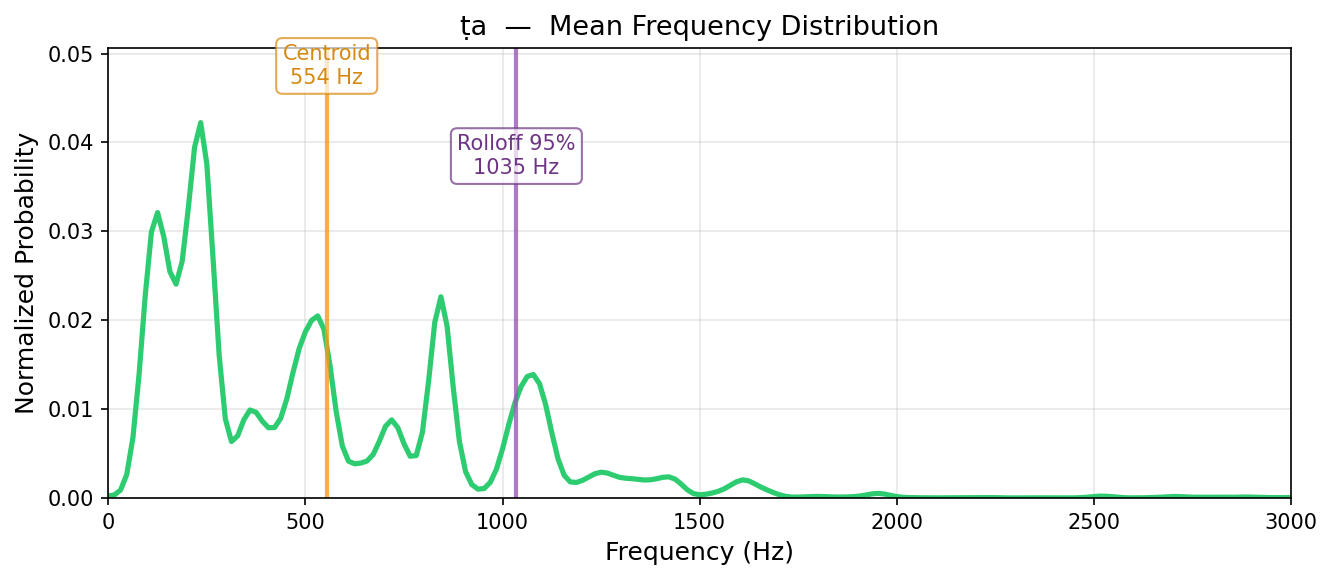
- Mean frequency distribution of the complete consonant+vowel syllable (same as Sparśa Grid). The centroid and rolloff markers are shown. This is the baseline — the consonant as normally heard, vowel included.
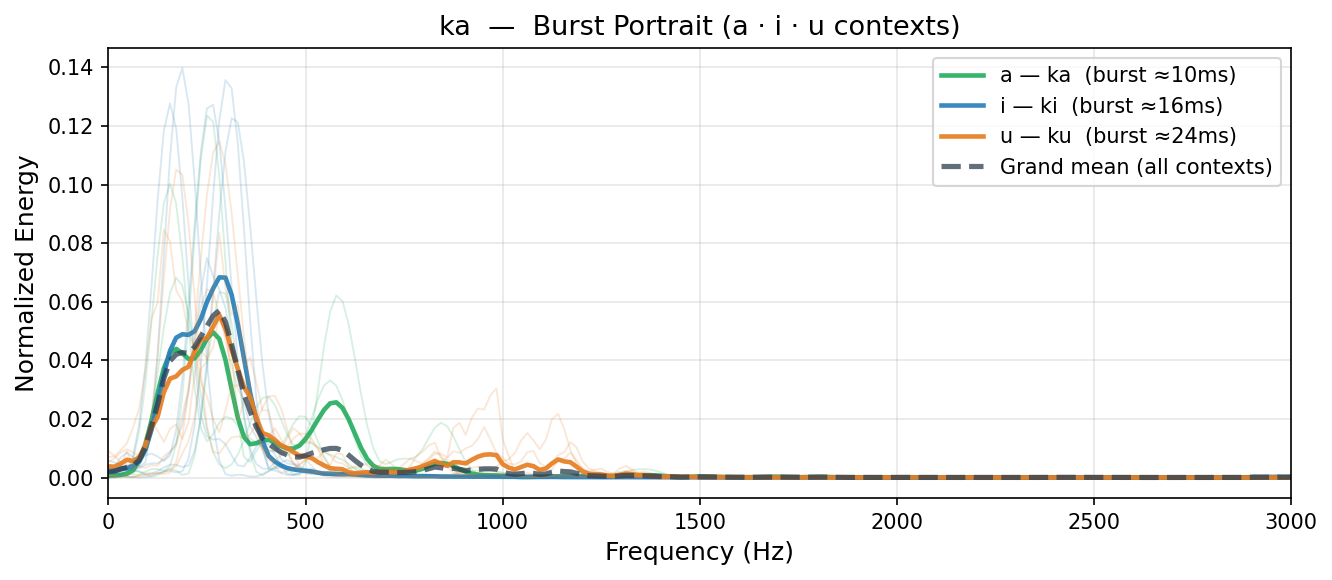
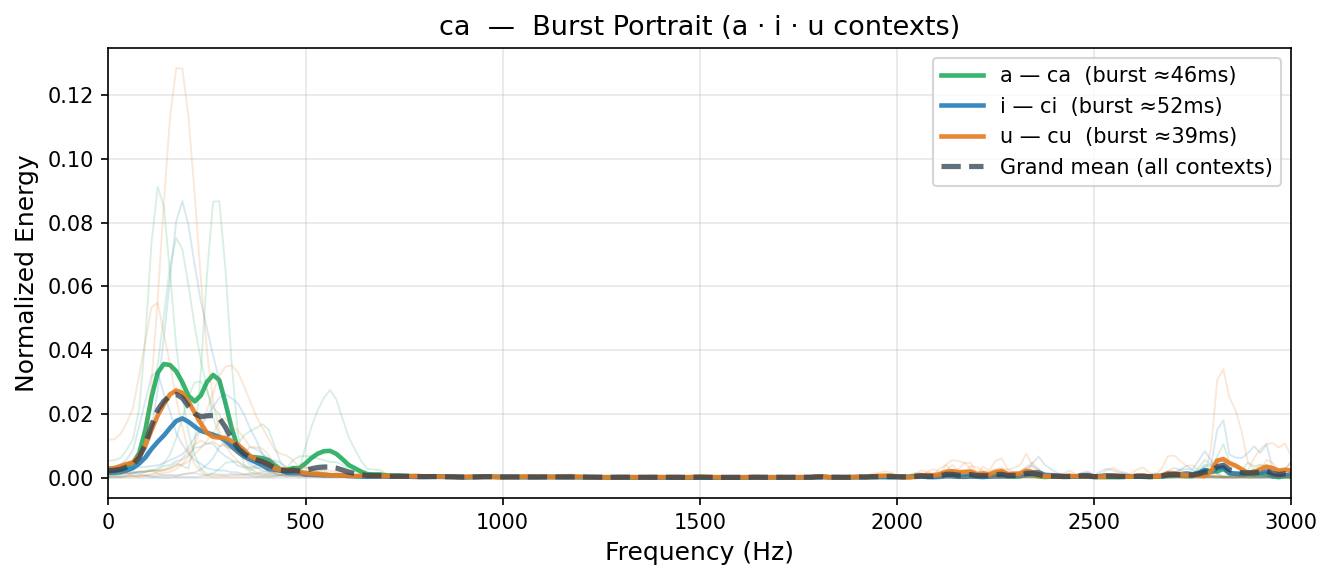
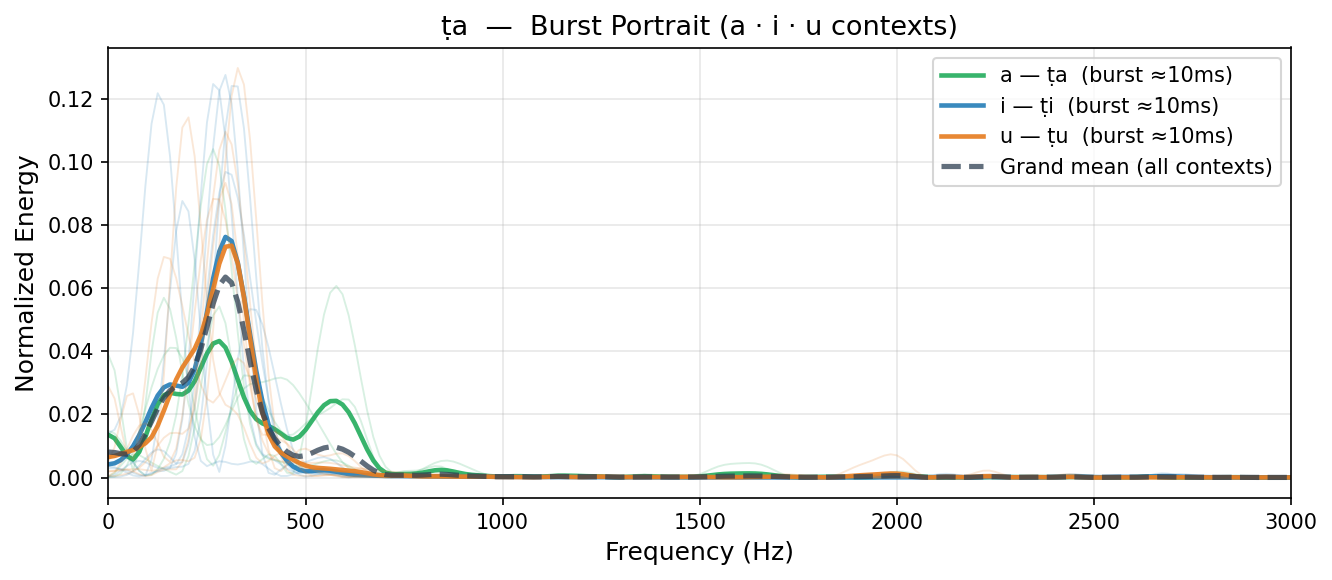
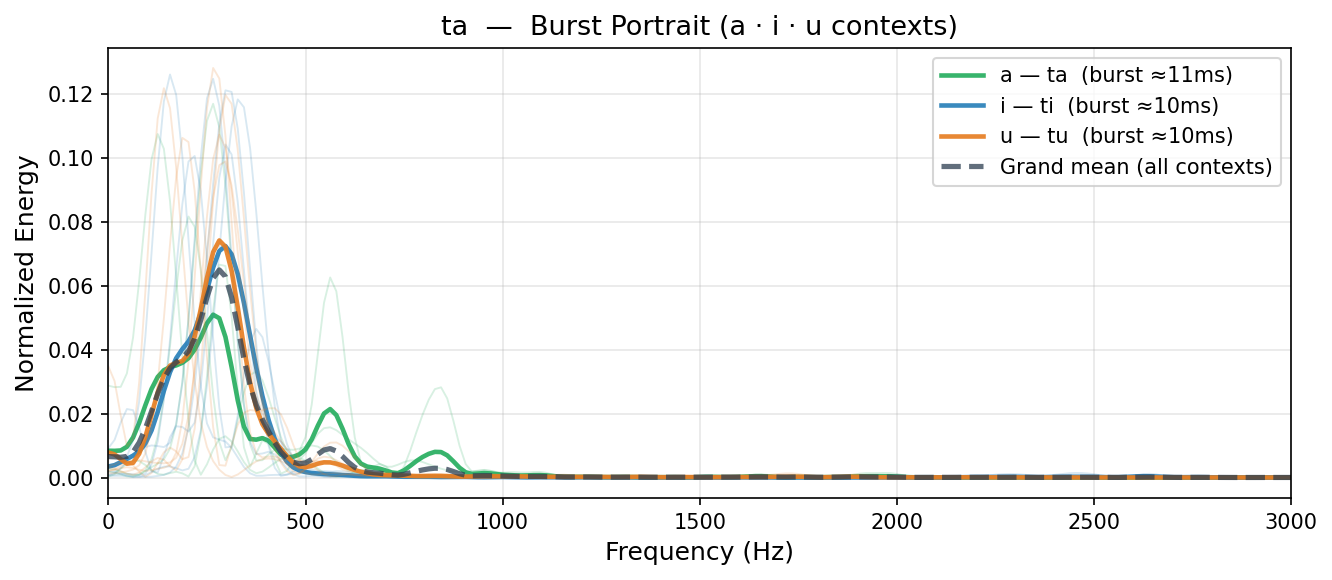
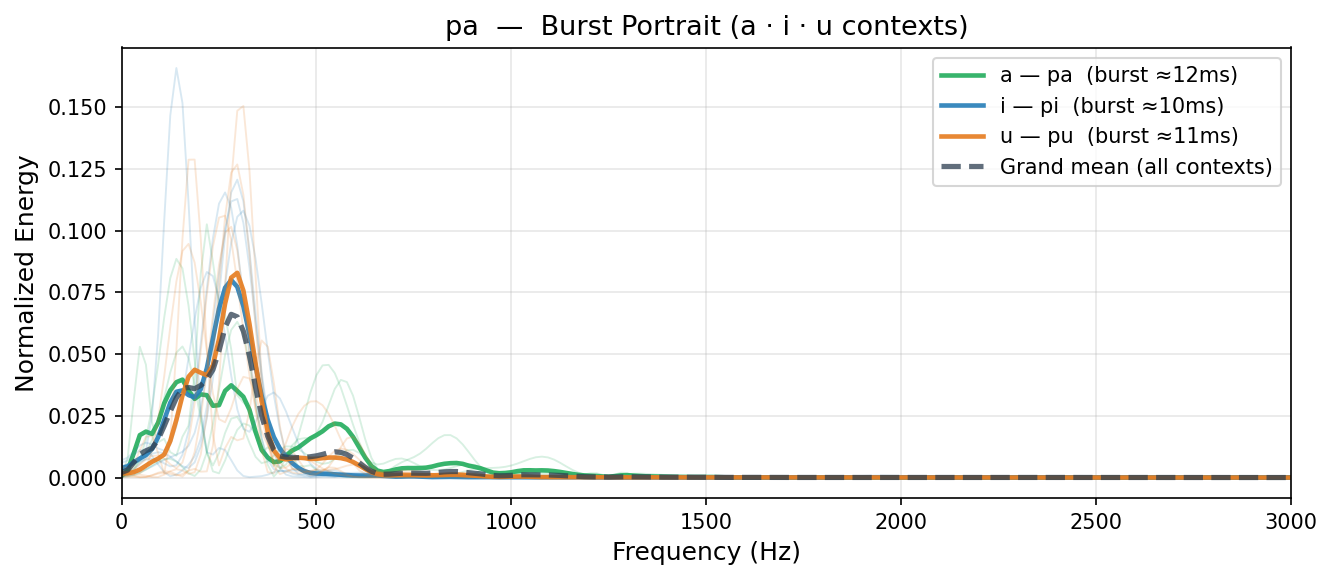
- Row 2 — Burst Portrait
- Every stop consonant begins with a burst: a brief (10–40 ms) pressure release at the point of articulation. The burst window is detected automatically from the power envelope and its frequency distribution is plotted for all three vowel contexts — अ (green), इ (blue), उ (orange). Individual voices shown as thin translucent curves; svara-context mean as solid line; grand mean across all contexts as dashed. If the three curves overlap, the burst is vowel-independent — the consonant's spectral identity is present before the vowel begins.
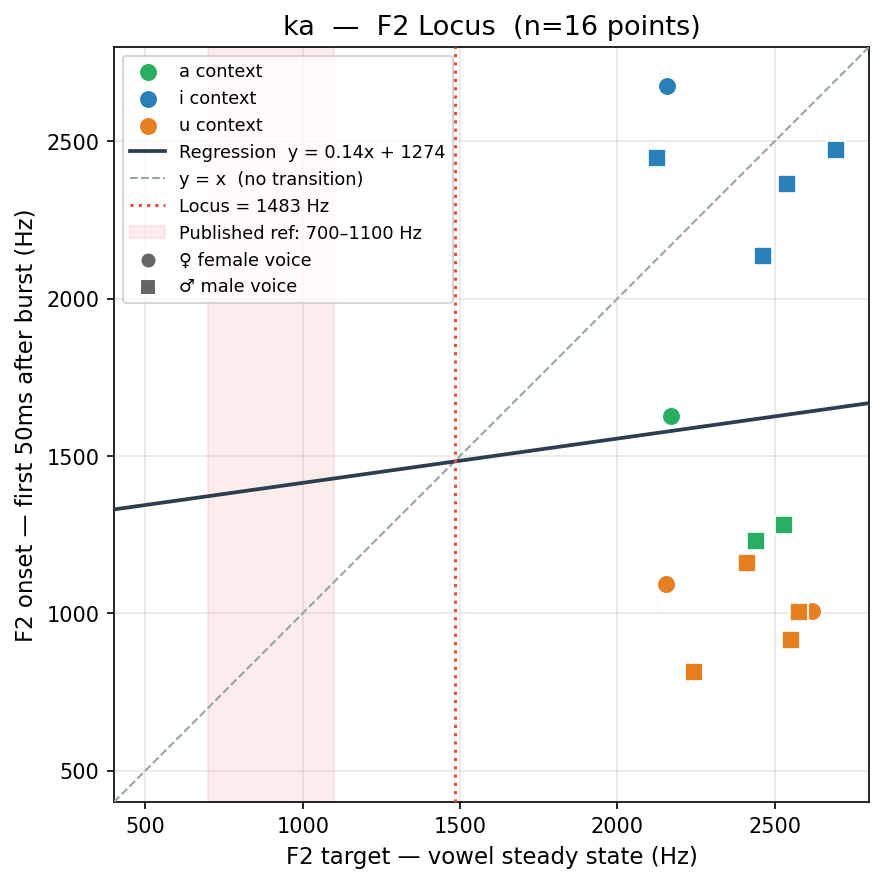
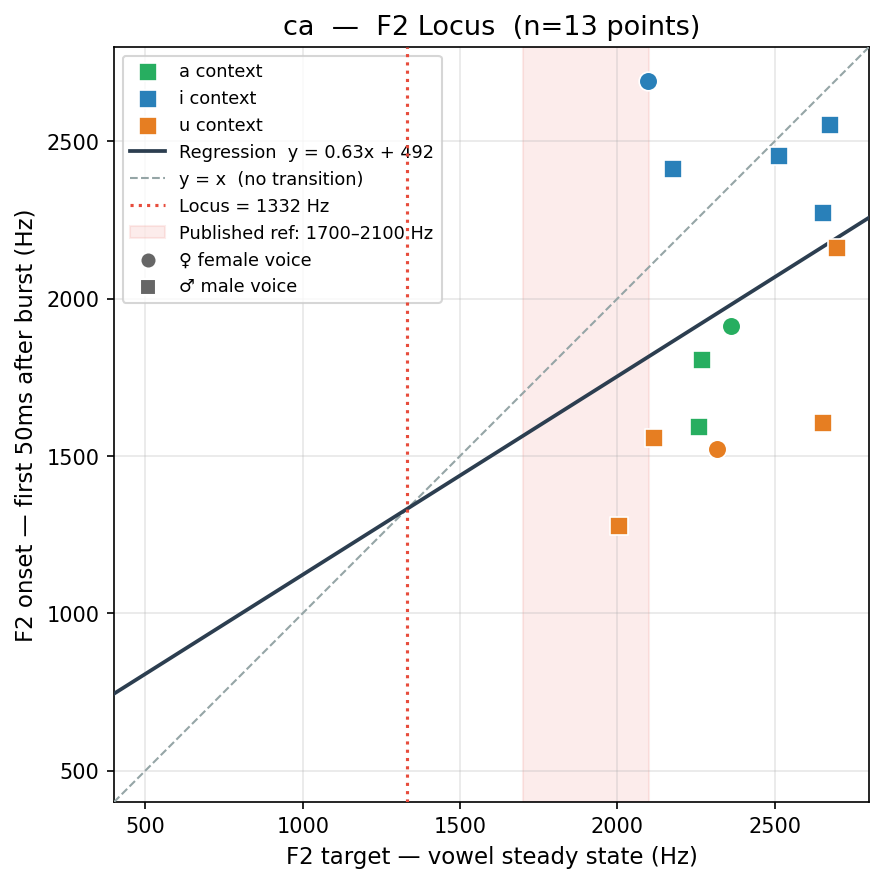
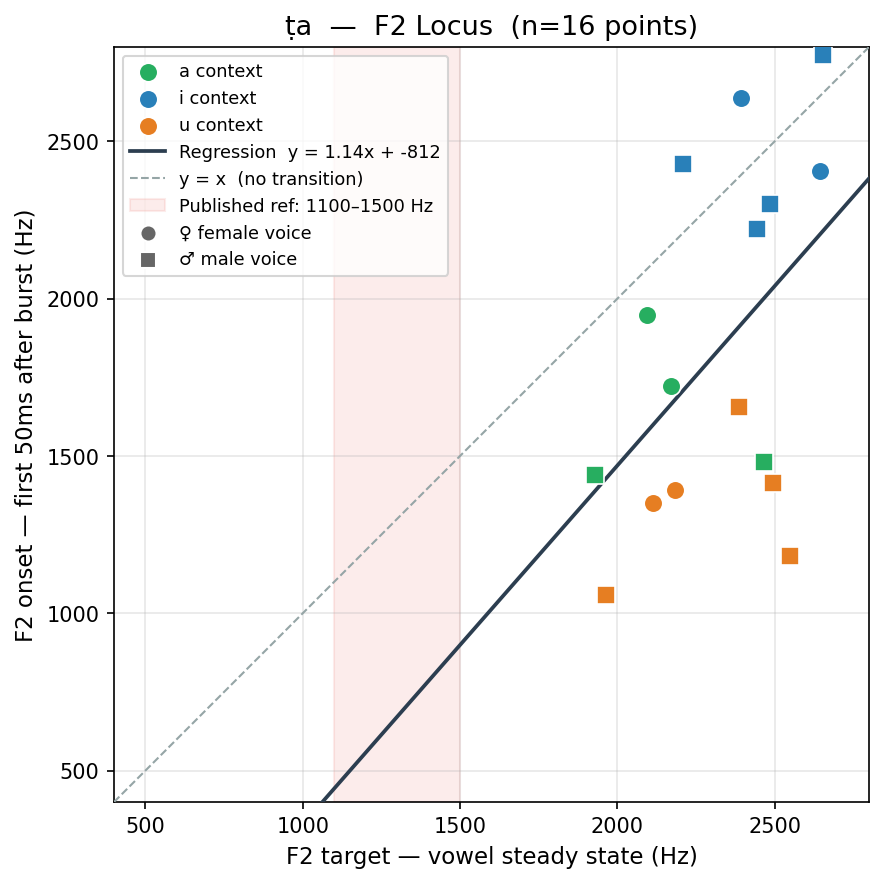
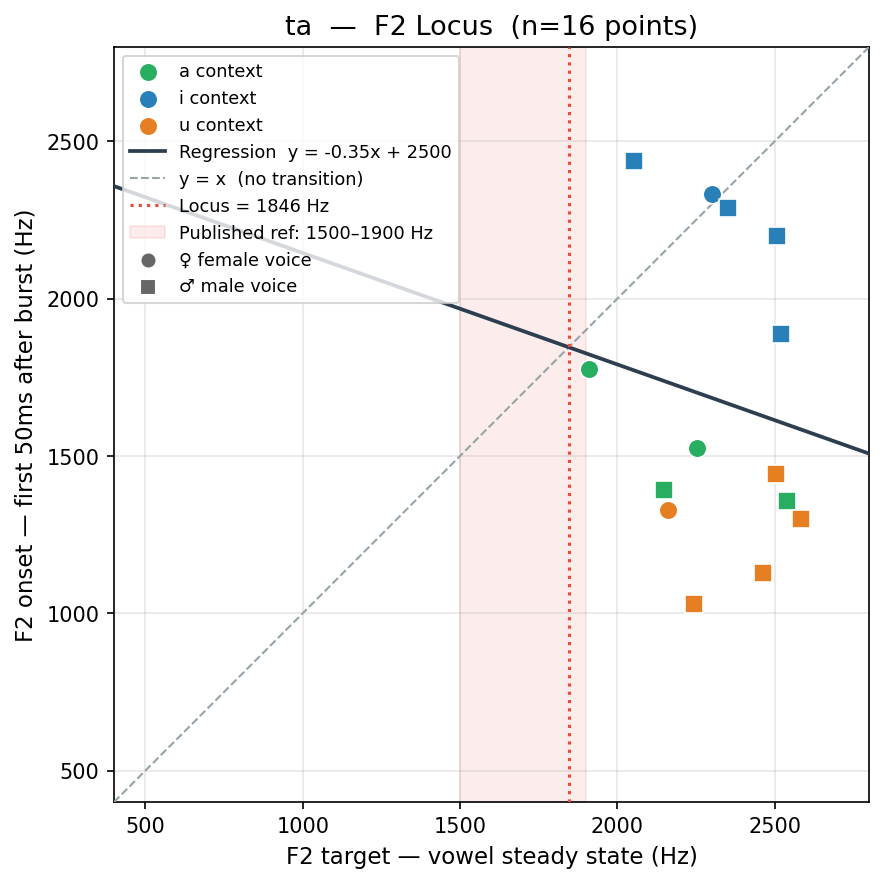
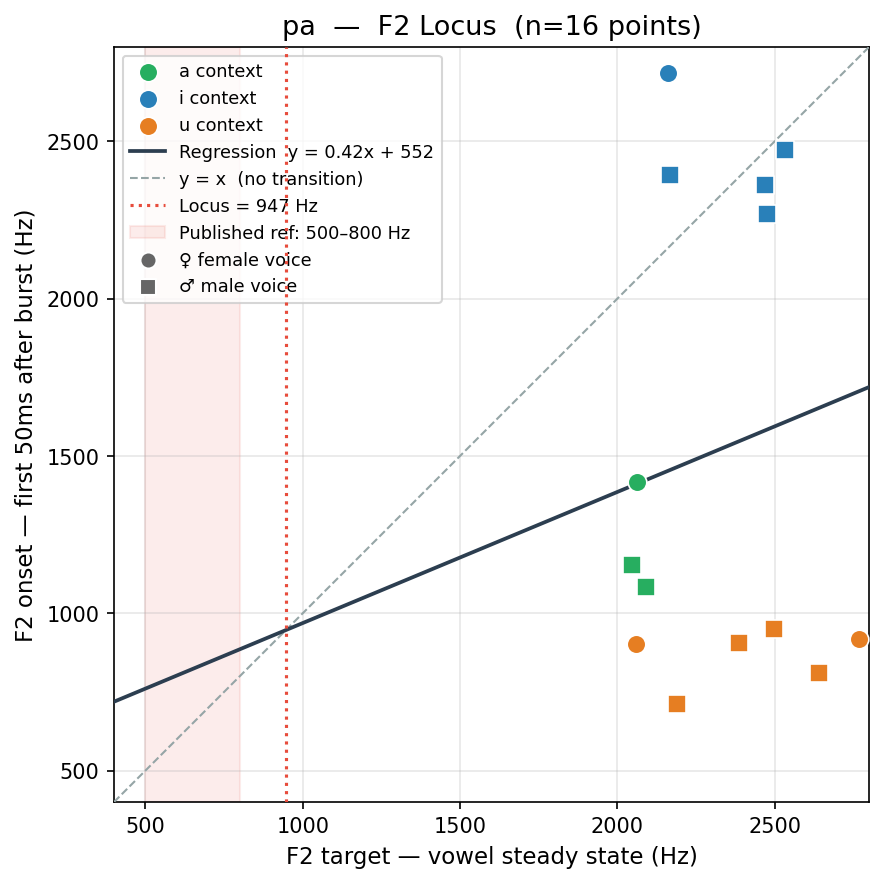
- Row 3 — F2 Locus
- The second formant (F2) — primary acoustic correlate of place of articulation — transitions from a consonant-influenced onset toward the vowel's steady-state target. Each point plots F2_onset (y-axis: mean F2 in first 50 ms after burst) against F2_target (x-axis: mean F2 in last 80 ms). A regression line is fit across all three vowel contexts. Its intersection with the identity line y = x gives the locus — the theoretical F2 the consonant "targets," independent of vowel. The shaded band shows published reference locus for this place of articulation. Circles = female voice, squares = male.
- What to look for
- Row 2 convergence → consonant identity lives in the burst, not the vowel. Row 3 locus values separating by varga → Pāṇinian sthāna correspond to distinct measurable acoustic targets. Agreement between Row 2 burst shape and Row 3 locus position = strong evidence for the acoustic reality of the Pāṇinian classification.
- Audio data
- Google Cloud TTS, Kannada and Telugu voices (4 utterances per consonant+vowel pair). The human auditory system cannot distinguish these TTS utterances from natural speech for place-of-articulation identification — the relevant acoustic cues are intact.
| क ka Velar | च ca Palatal | ट ṭa Retroflex | त ta Dental | प pa Labial | |
|---|---|---|---|---|---|
| Full Syllable reference |
↗ | ↗ | ↗ | ↗ | ↗ |
| Burst Portrait अ इ उ |
 |  |  |  |  |
| F2 Locus locus eq. |
 |  |  |  |  |
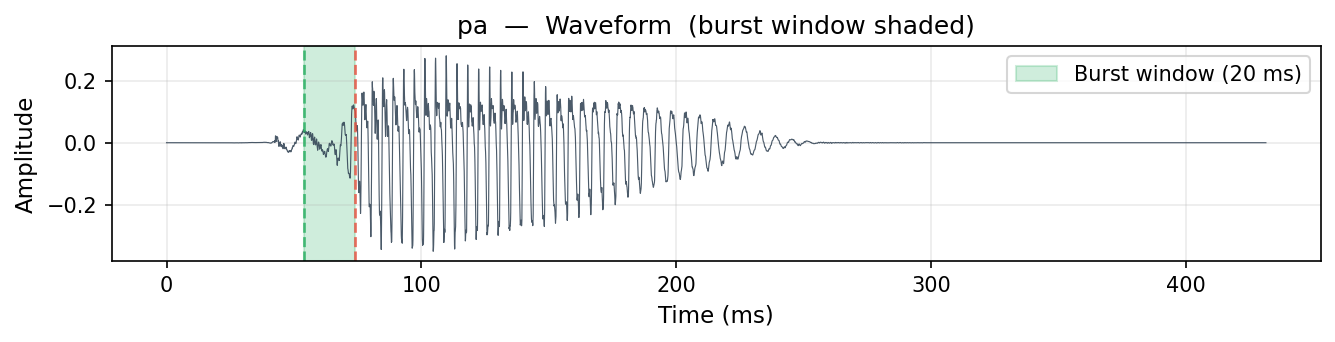
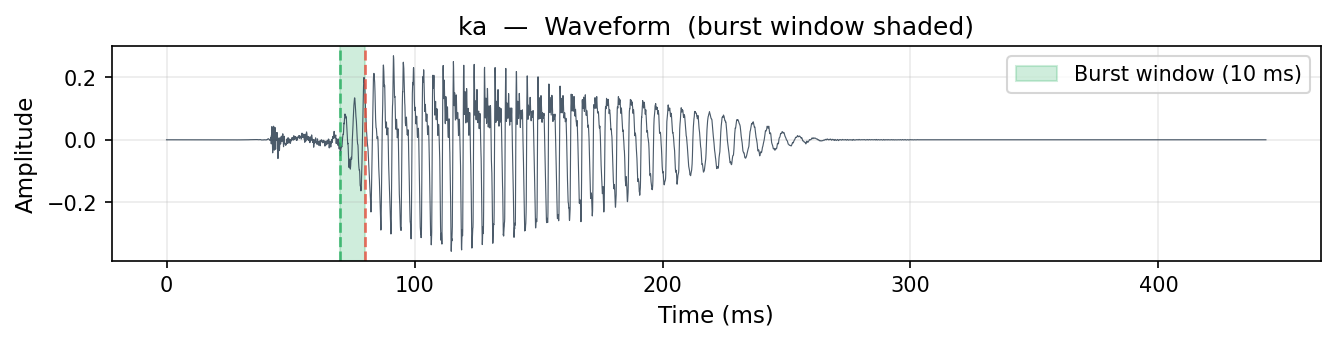
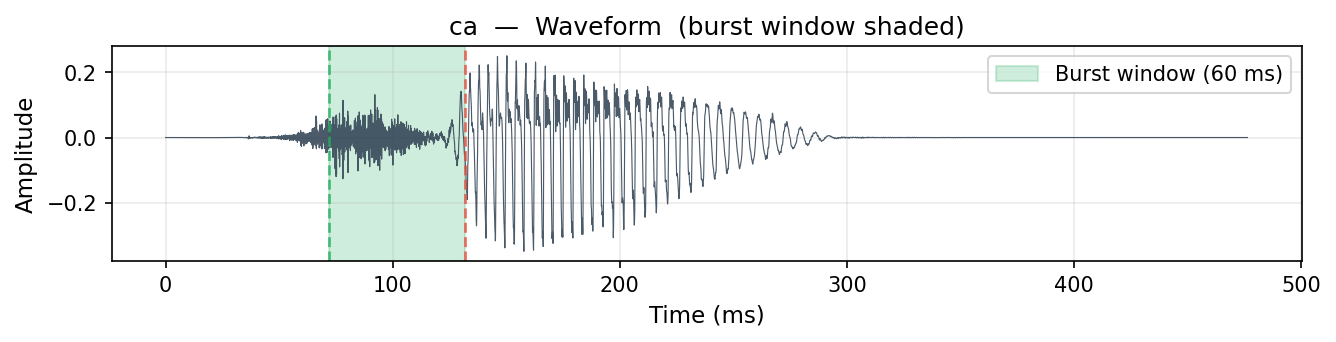
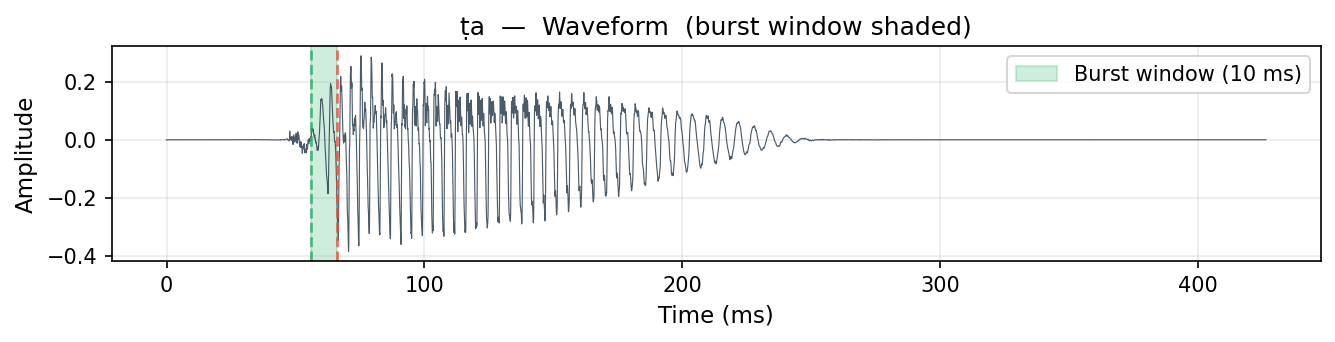
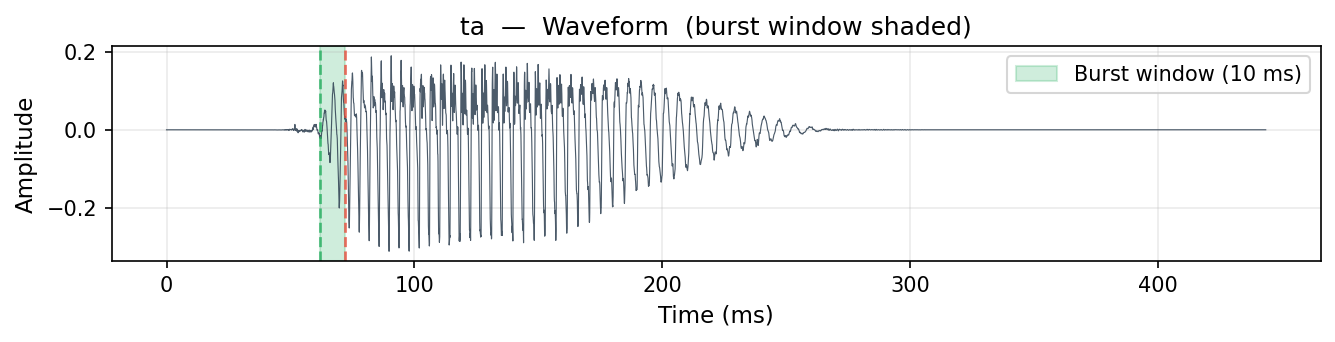
▶ Amplitude waveform — burst window annotated (canonical: kn ♀, a context — click to expand)
ka
ca
ṭa
ta
pa