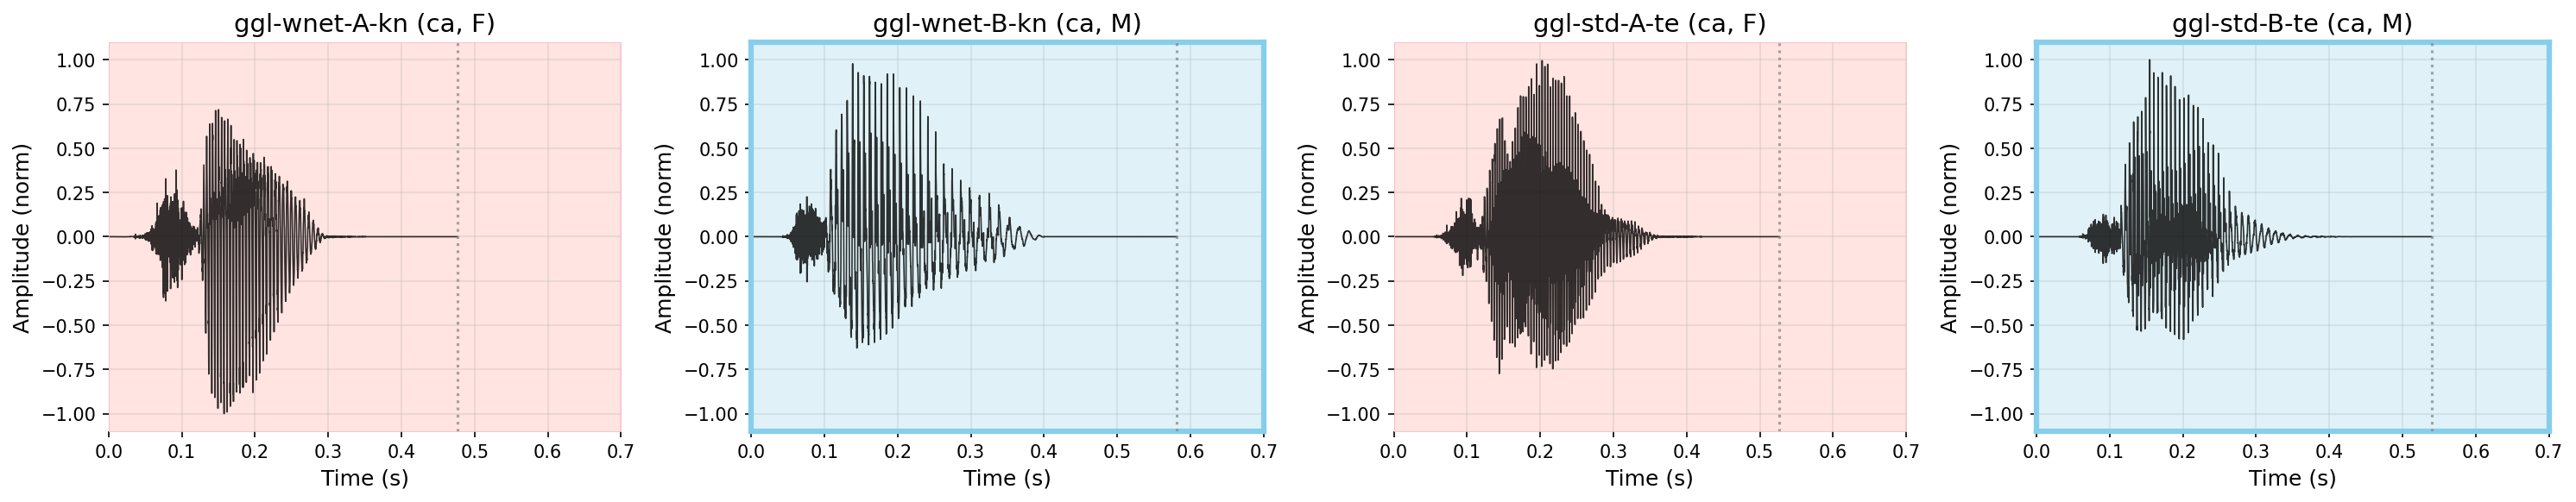
▼ Waveform (Amplitude vs Time)
Definition: Raw acoustic signal showing amplitude variation over time.
Reveals consonant bursts (sharp peaks), voicing patterns (oscillations), and vowel steady-state regions (regular oscillations).
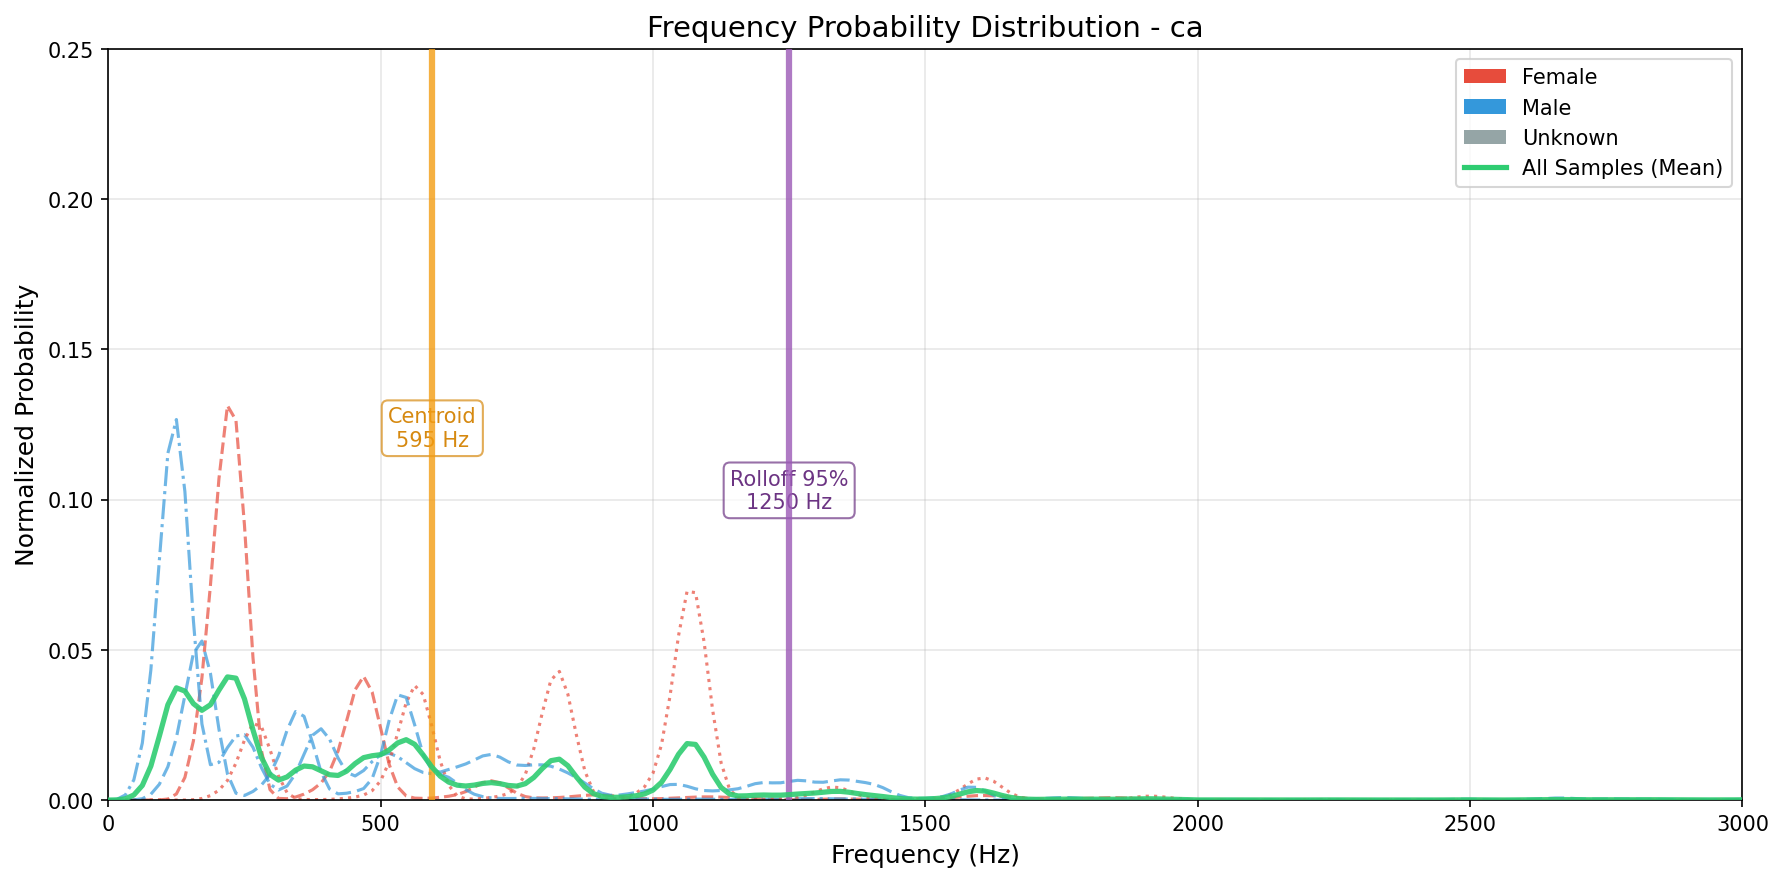
▼ Frequency Probability Distribution
Definition: Normalized frequency energy distribution showing the relative power at each frequency.
Each curve represents one utterance. The area under the curve integrates to 1 (probability distribution).
- Spectral Centroid (dotted line): Weighted mean frequency—indicates the "center of mass" of the spectrum. Higher centroid = brighter sound (more high-frequency energy).
- Spectral Rolloff 95% (dashed line): Frequency containing 95% of the total energy. Captures the high-frequency cutoff of the sound.
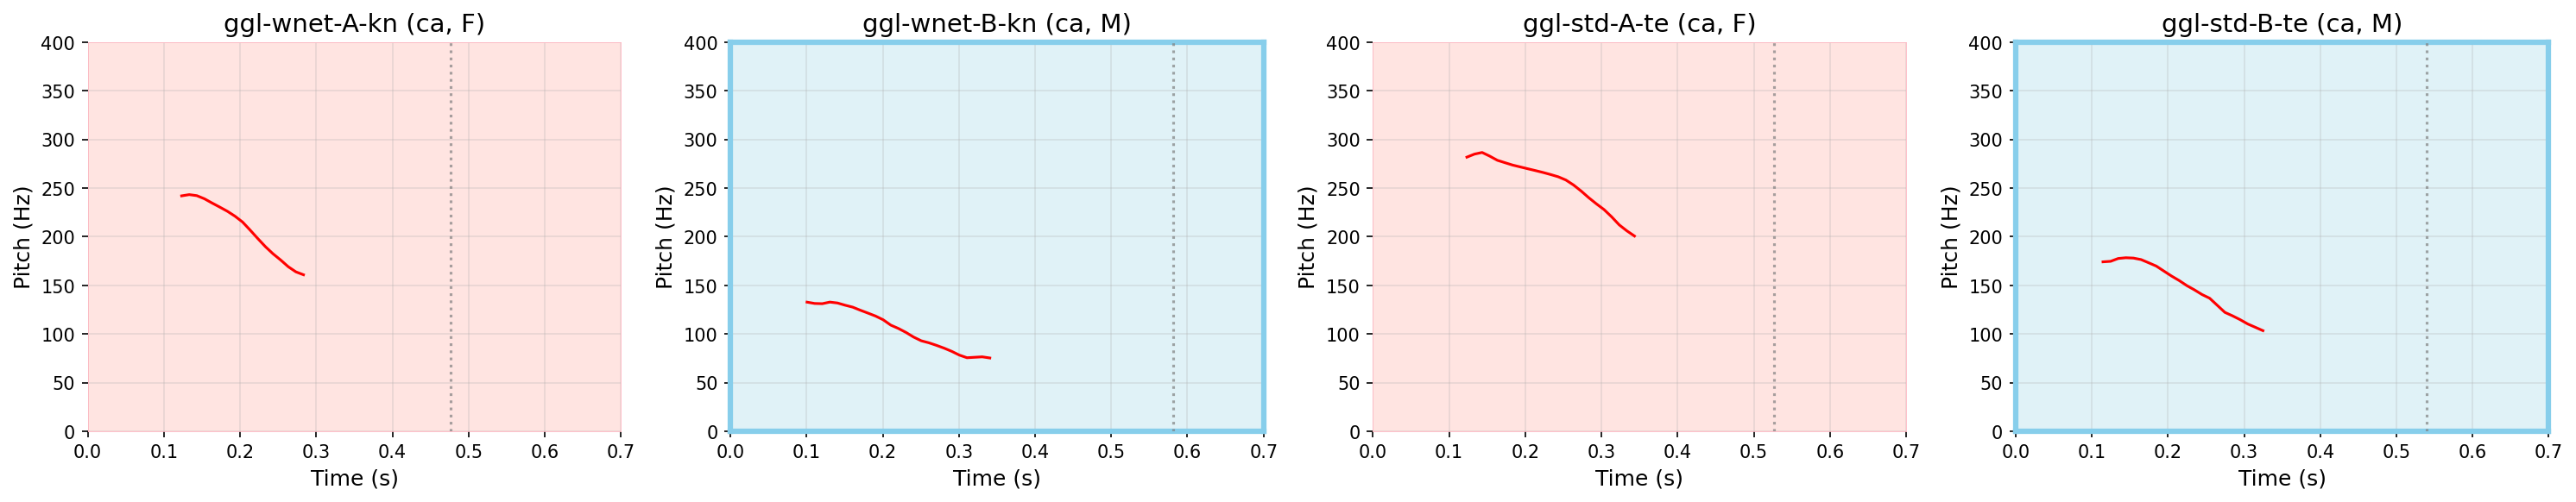
▼ Pitch vs Time
Definition: Fundamental frequency (F0) in Hertz.
Represents the perceived tone or "musical note" of the voice. Higher Hz = higher pitch.
▼ Power vs Time
Definition: Sound intensity (RMS amplitude) normalized to 0-1.
Shows the loudness of the sound over time. Higher values indicate louder portions of the speech.

▼ Formants vs Time
Definition: Vocal tract resonances in Hertz.
F1 (lowest) relates to tongue height, F2 to tongue position (front/back), F3 to lip rounding.
Different vowels have characteristic F1/F2 patterns that distinguish them acoustically.

▼ Formant Space (F1 vs F2)
Definition: Traditional vowel space visualization.
X-axis (F2): front vowels (high F2) ← → back vowels (low F2).
Y-axis (F1): close vowels (low F1) ← → open vowels (high F1), inverted for traditional display.
Points closer together indicate similar vowel quality.

▶ Interactive Formant Space (Click to Play Audio)
▼ Spectrograms
Definition: Time-frequency representation showing energy distribution across frequencies.
The spectrogram displays which frequencies are present in the sound at each moment in time.
Brighter colors indicate higher energy at that frequency.

▼ Findings & Statistics: ca
Acoustic Summary for ca (Overall)
Overall Statistics (n=4 files)
F1 (Formant 1)
Mean ± SD: 929 ± 427 Hz
F2 (Formant 2)
Mean ± SD: 1968 ± 546 Hz
F3 (Formant 3)
Mean ± SD: 3214 ± 373 Hz
Pitch (across all frames)
Range: 75 - 287 Hz
Mean ± SD: 177 ± 64 Hz
Duration
Range: 0.476 - 0.581 s
Mean ± SD: 0.531 ± 0.037 s
By Gender:
Female (n=2)
F1: 962 ± 52 Hz
F2: 1983 ± 22 Hz
F3: 3257 ± 90 Hz
Pitch: 232 ± 23 Hz
Male (n=2)
F1: 901 ± 105 Hz
F2: 1957 ± 79 Hz
F3: 3171 ± 24 Hz
Pitch: 127 ± 21 Hz
▼ Observations: ca
Automated Analysis for ca
Programmatically inferred patterns from the acoustic data
Consistency & Variance
Within-group homogeneity and overall variance patterns
• F1 shows substantial variance (CV=0.46), suggesting heterogeneous voice characteristics or synthesis inconsistencies.
• Female voices (n=2) show very tight F1 consistency (CV=0.05), suggesting systematic pronunciation.
Gender Differences
Acoustic differences between male and female voices
• F1 gender difference is moderate (61 Hz / 6.6%, d=0.74).
• F2 gender difference is moderate (26 Hz / 1.3%, d=0.45).
Phonetic Analysis
Formant validation against expected vowel properties
• Formant analysis: F1=929 Hz (open), F2=1968 Hz (front-central).
Duration Patterns
Temporal characteristics and uniformity
• Duration shows low variance (CV=0.07, range 0.476-0.581s). TTS temporal control is tight, possibly unnaturally uniform compared to natural speech.
TTS Quality
Synthesis consistency and prosodic control
• ggl shows high pitch variance (σ=57 Hz), which may indicate natural-sounding variation or control instability.
Guide for Interpretation
- Coefficient of Variation (CV): Ratio of standard deviation to mean. CV < 0.1 indicates tight clustering, CV > 0.2 indicates high variance.
- Cohen's d: Standardized effect size (difference ÷ pooled SD). Measures how many standard deviations apart two groups are. d < 0.2 is negligible, 0.2-0.5 is small, 0.5-0.8 is medium, d > 0.8 is large.
- Relative differences: Reported as "absolute Hz / percentage of mean" to show both raw and scaled differences (e.g., 48 Hz / 8.5% means 48 Hz is 8.5% of the average F1 value).
- Formant validation: Expected ranges based on IPA vowel space: close vowels (F1 < 400 Hz), front vowels (F2 > 2000 Hz), back vowels (F2 < 1000 Hz).
- Natural speech baselines: Gender differences typically show F1 ~100 Hz, F2 ~150 Hz; TTS may deviate from these.
- TTS quality indicators: Pitch stability (σ < 25 Hz = excellent), formant consistency (lower variance = better control).