148
Total Utterances
TTS: 148
Human: 0
Human: 0
37
Unique Varnas
3 pri
8 sec
6 vya
8 sec
6 vya
1
TTS Engines
ggl
2
Scripts
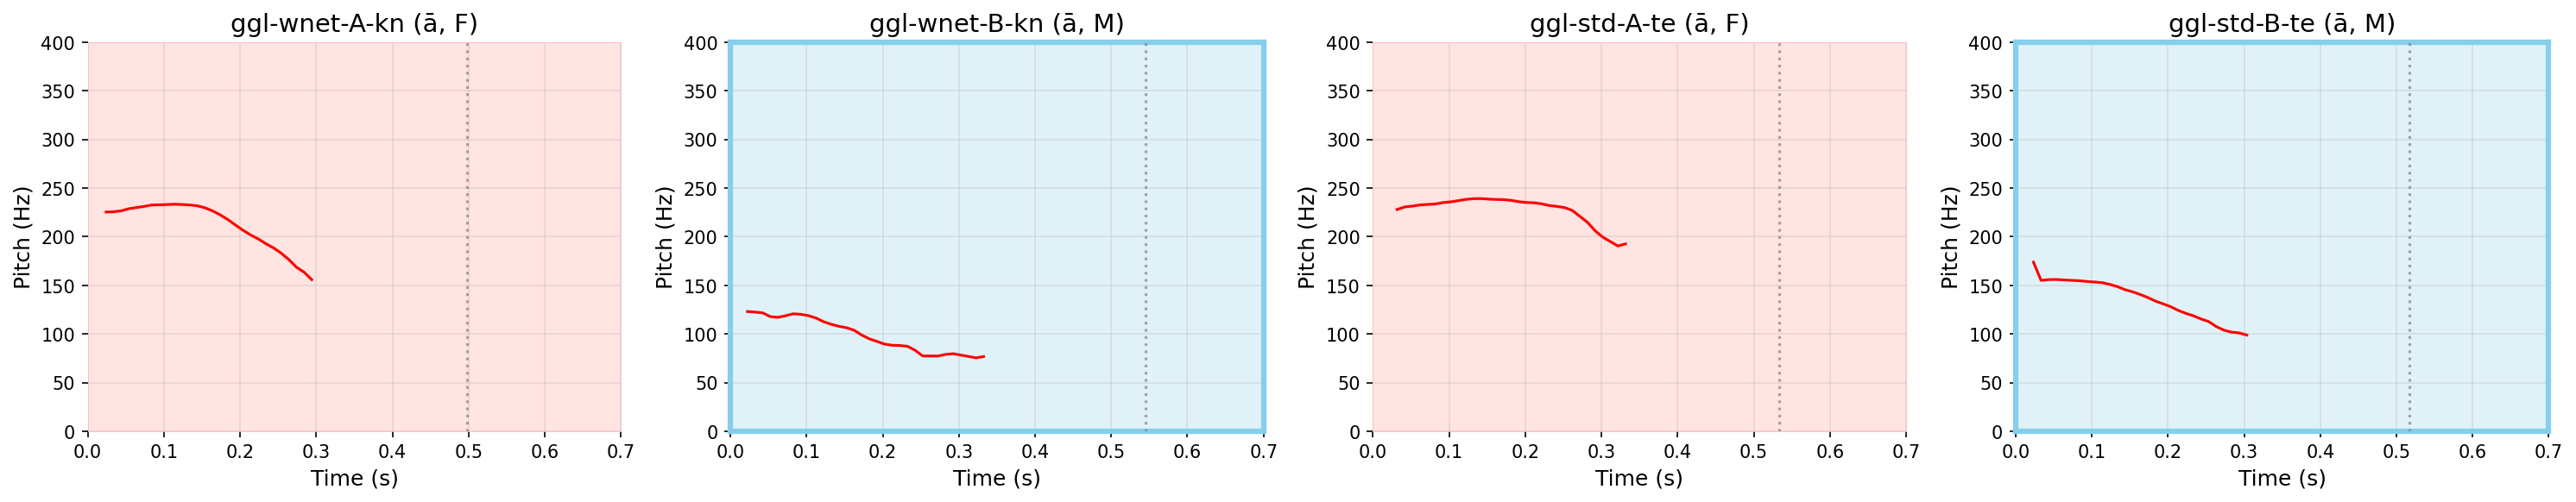
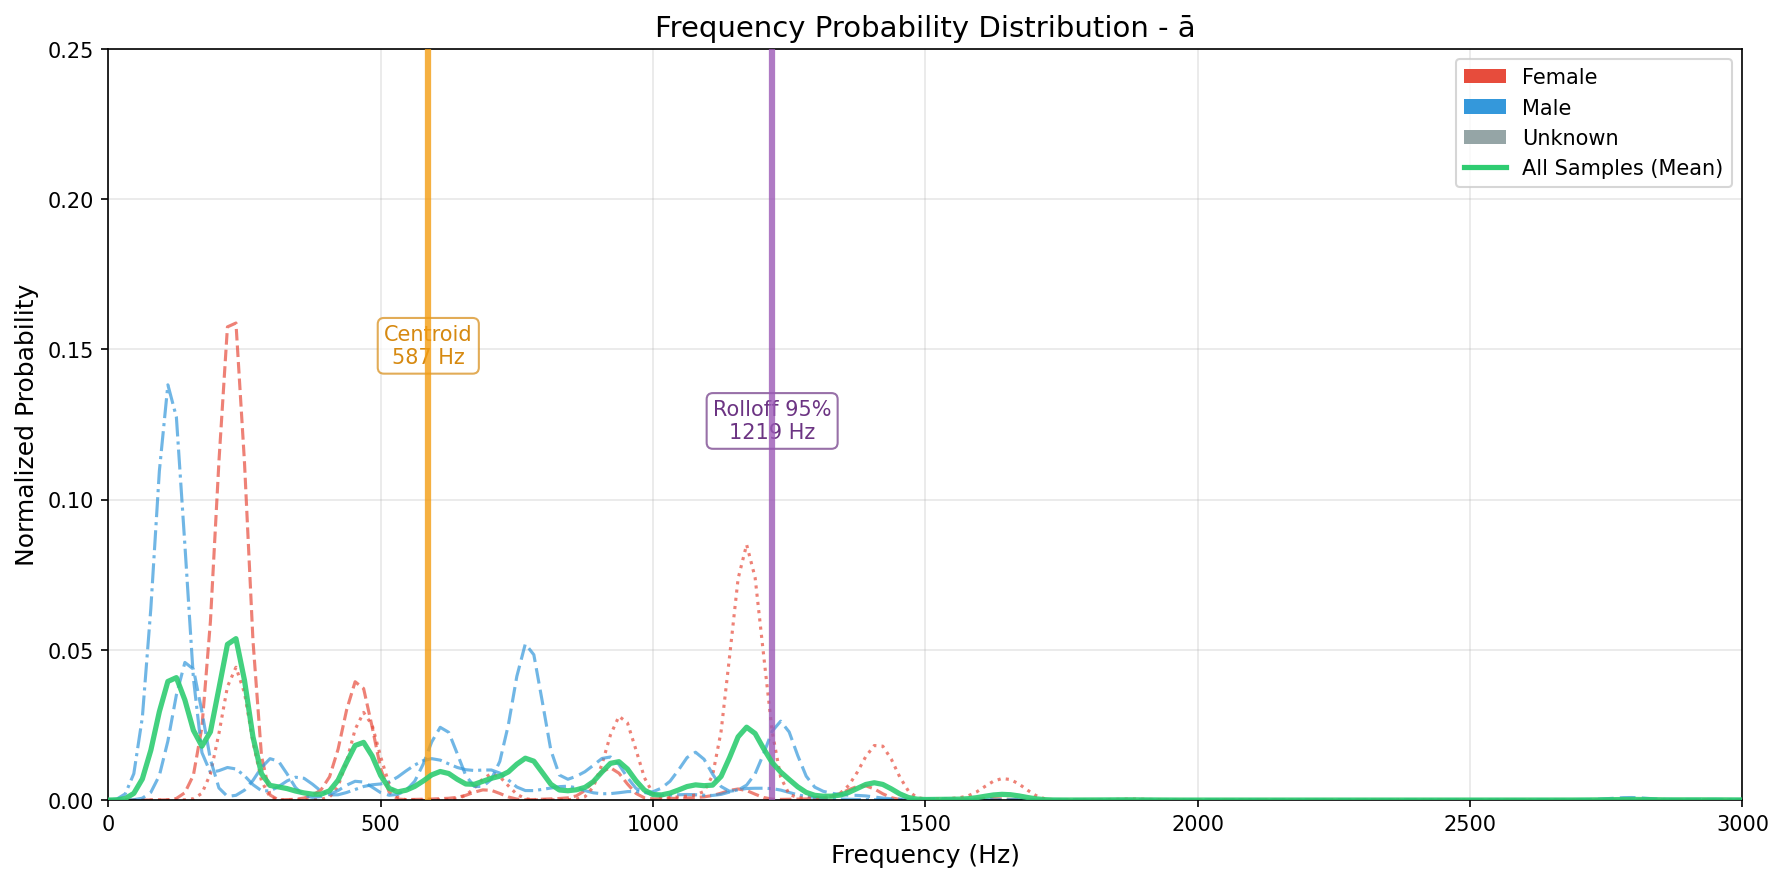
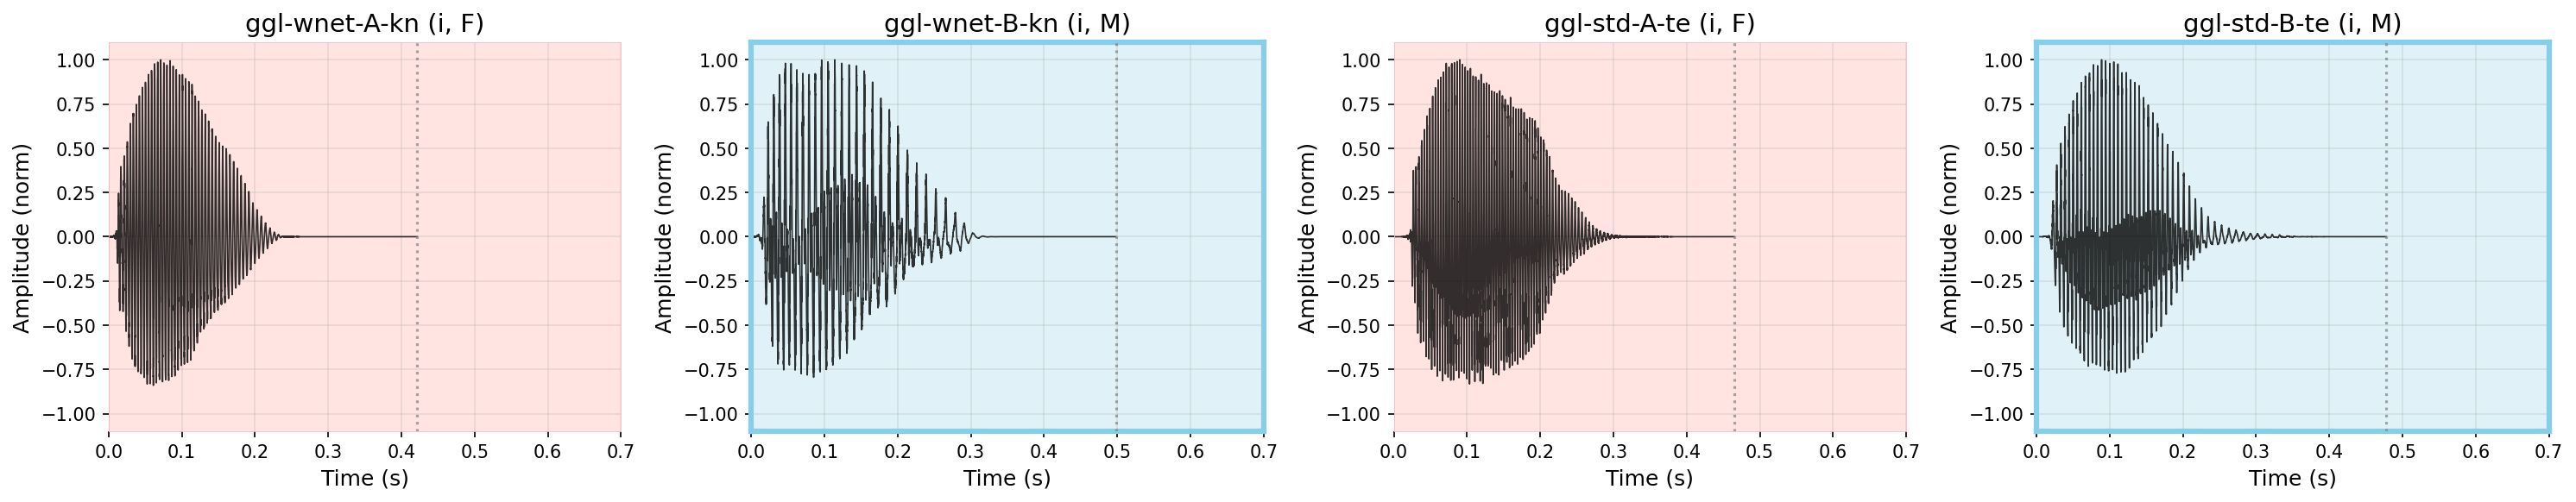
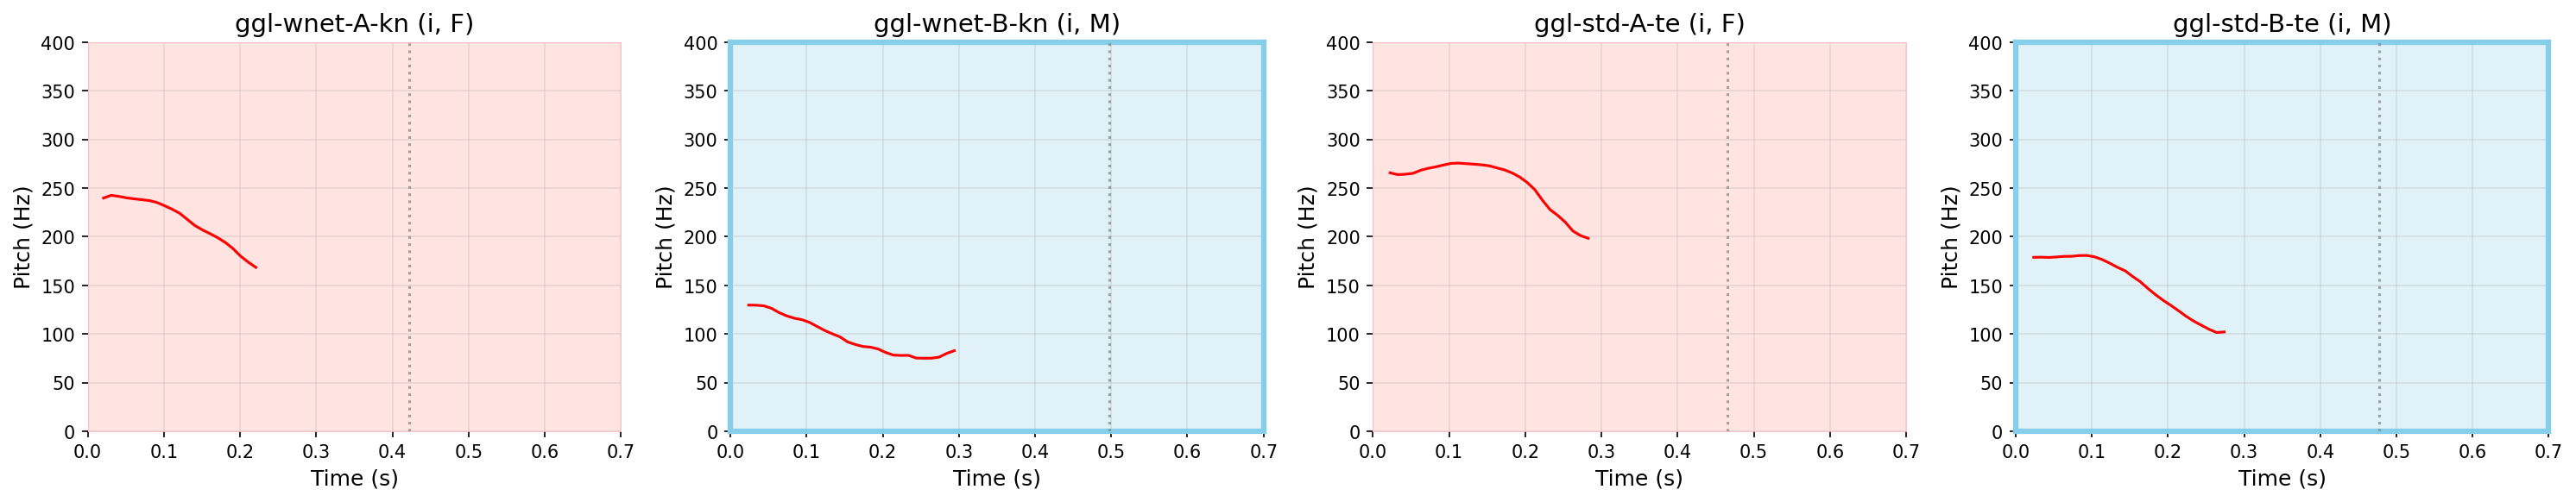
ಅ, అ
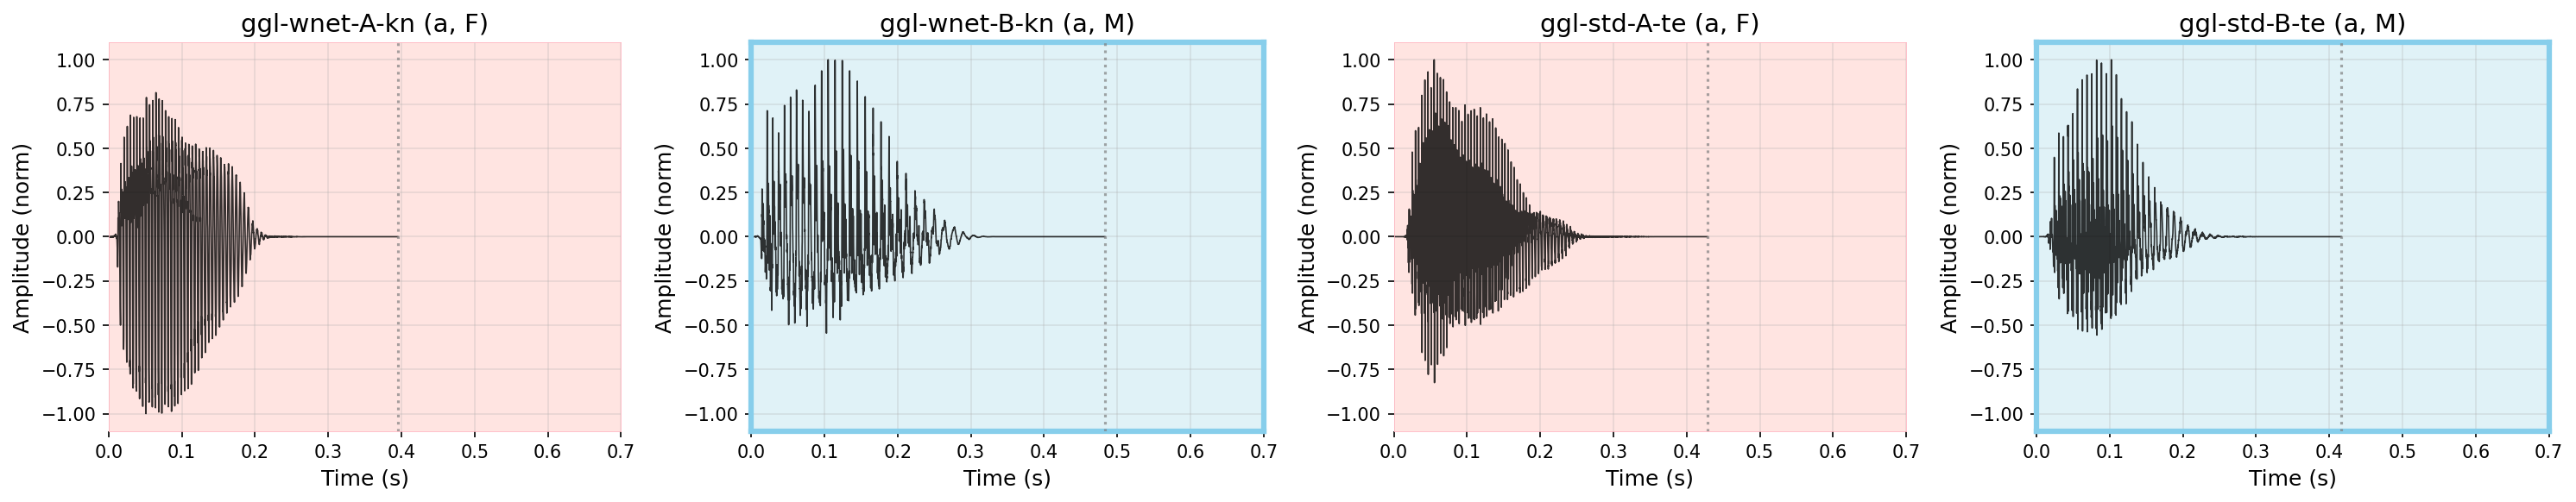
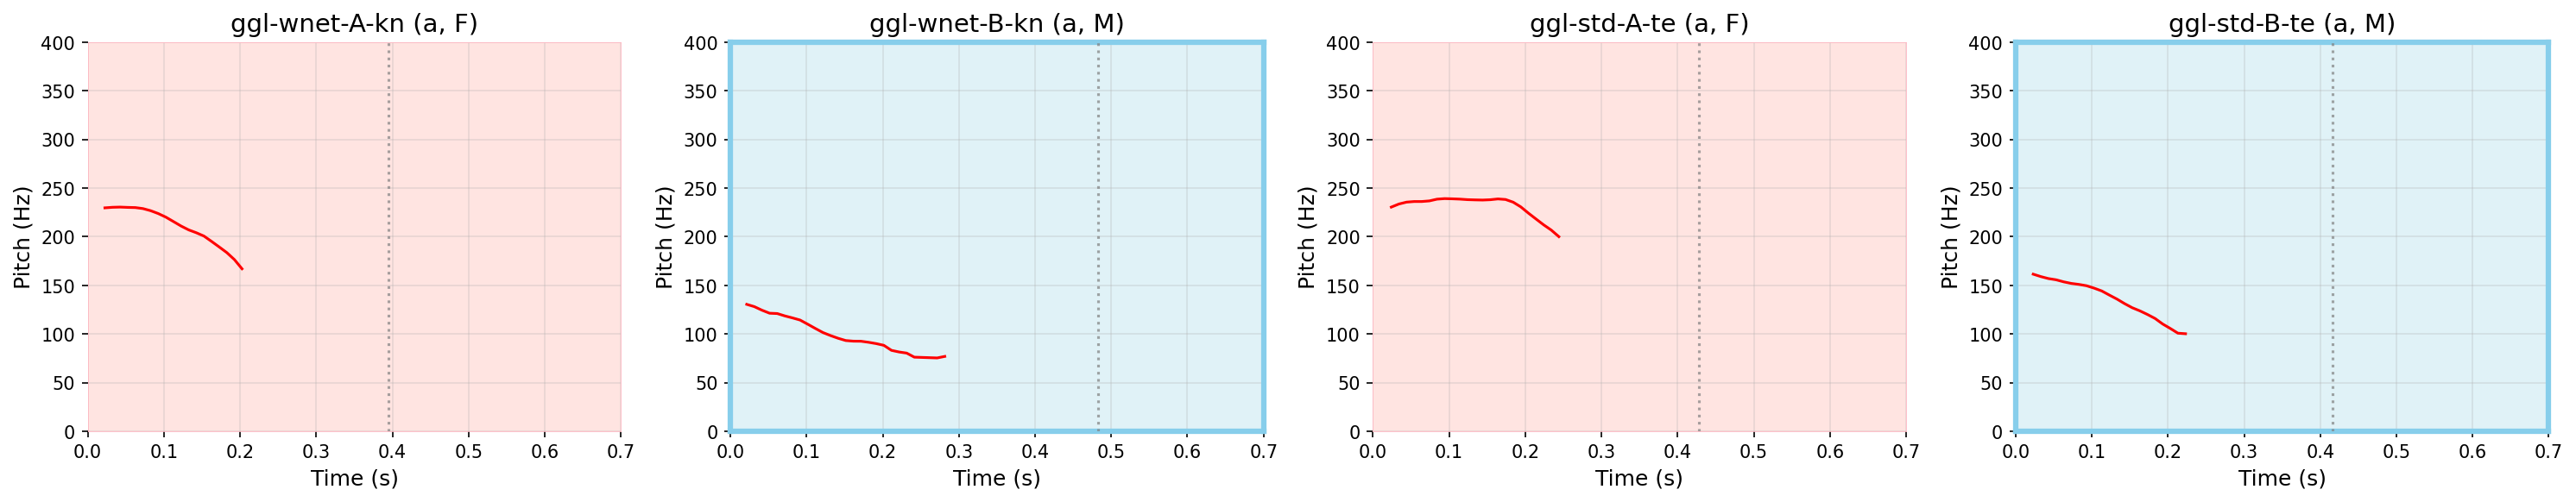
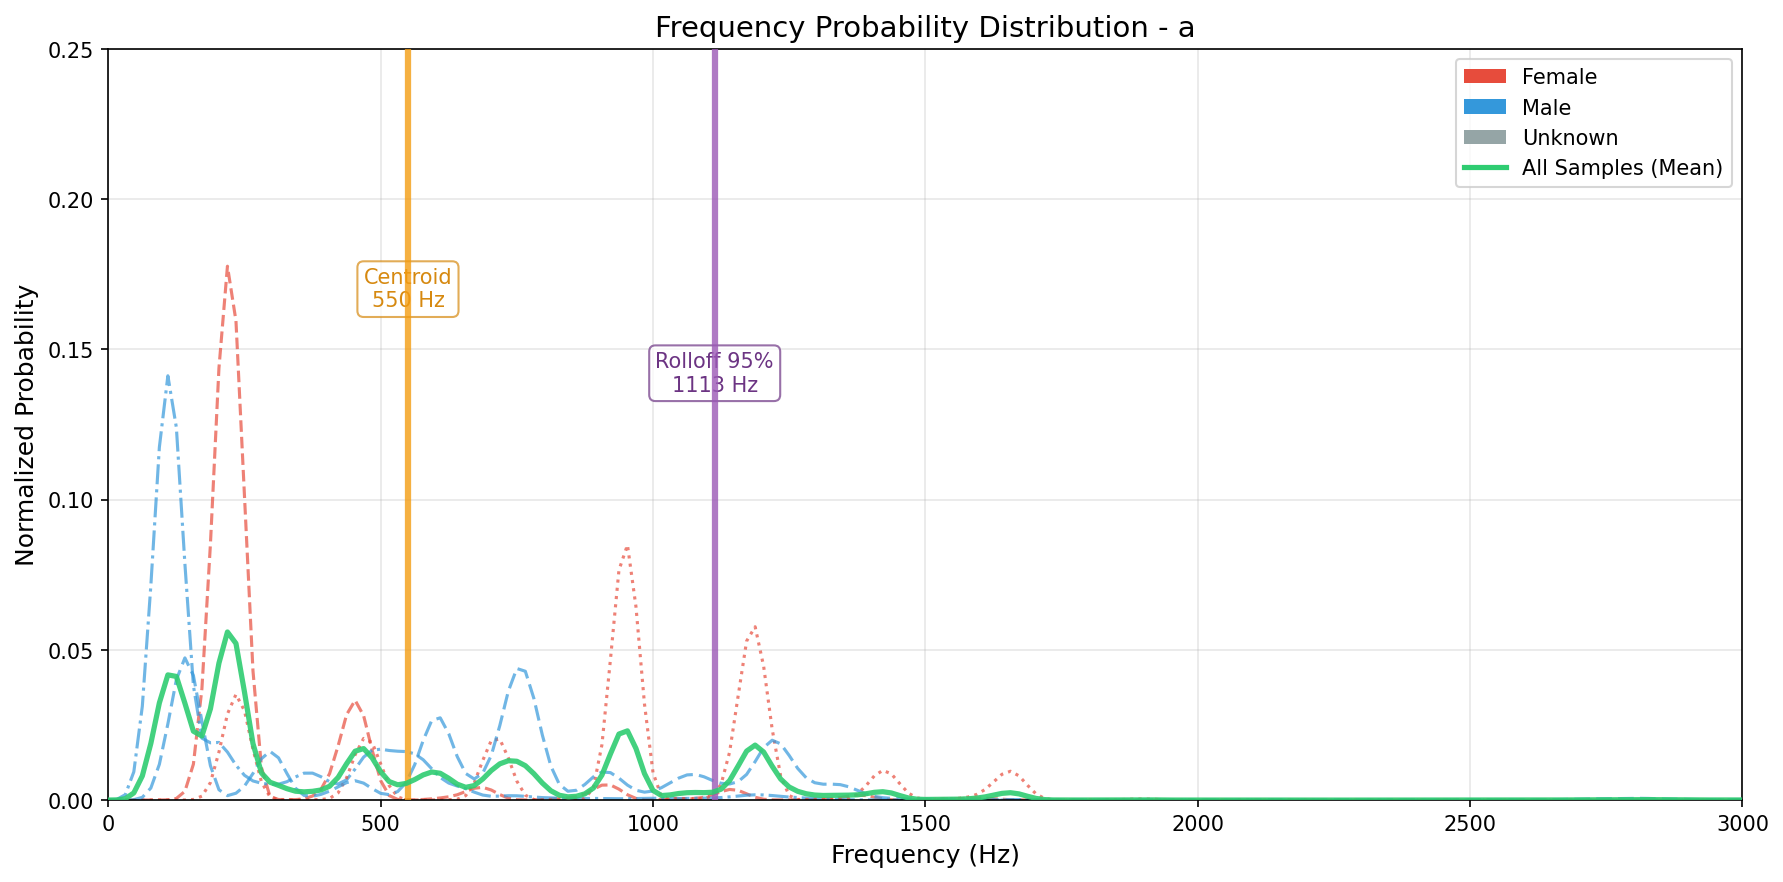
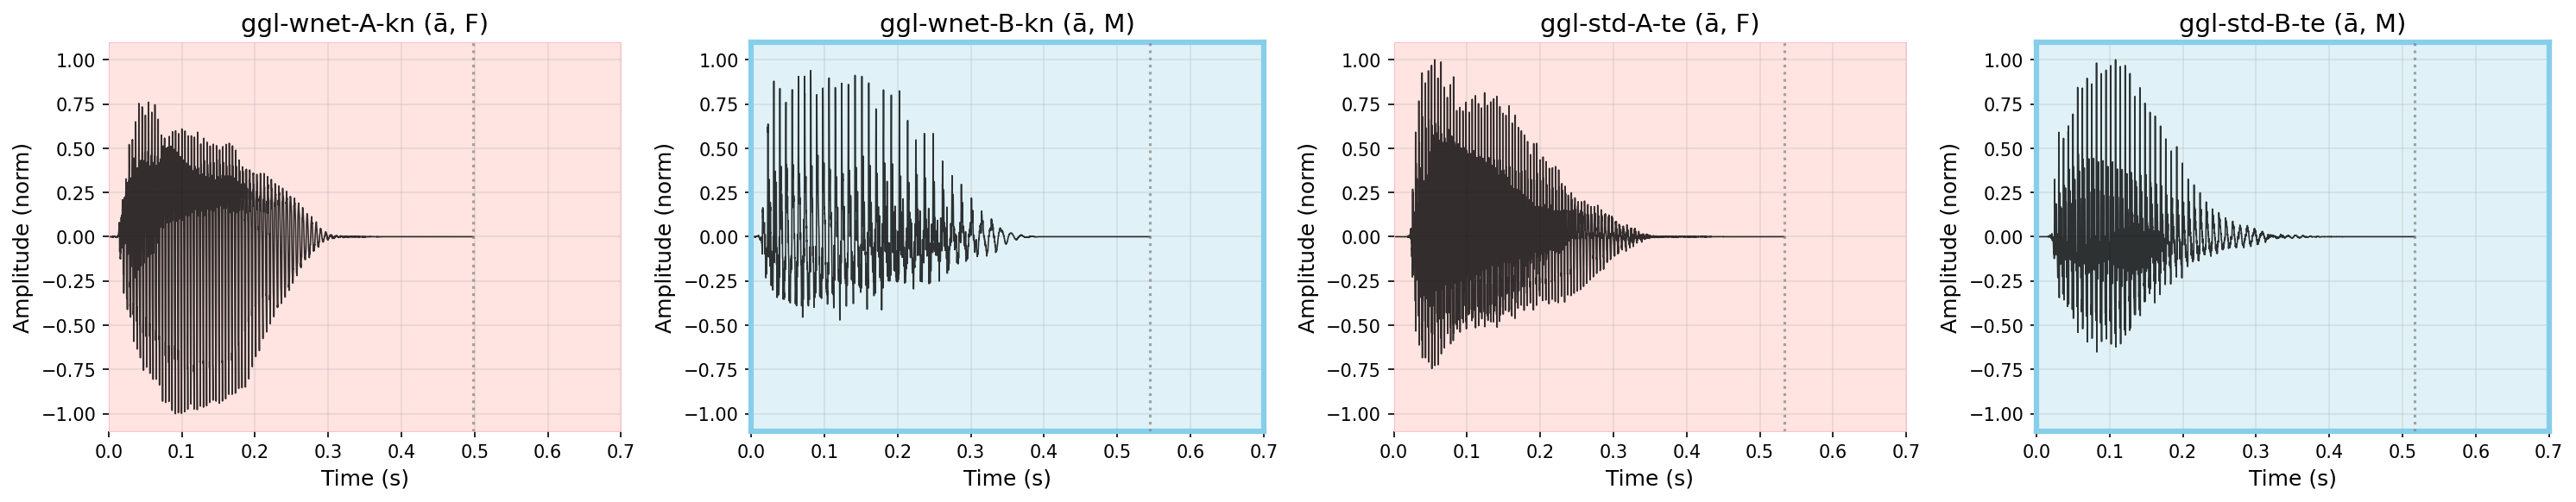
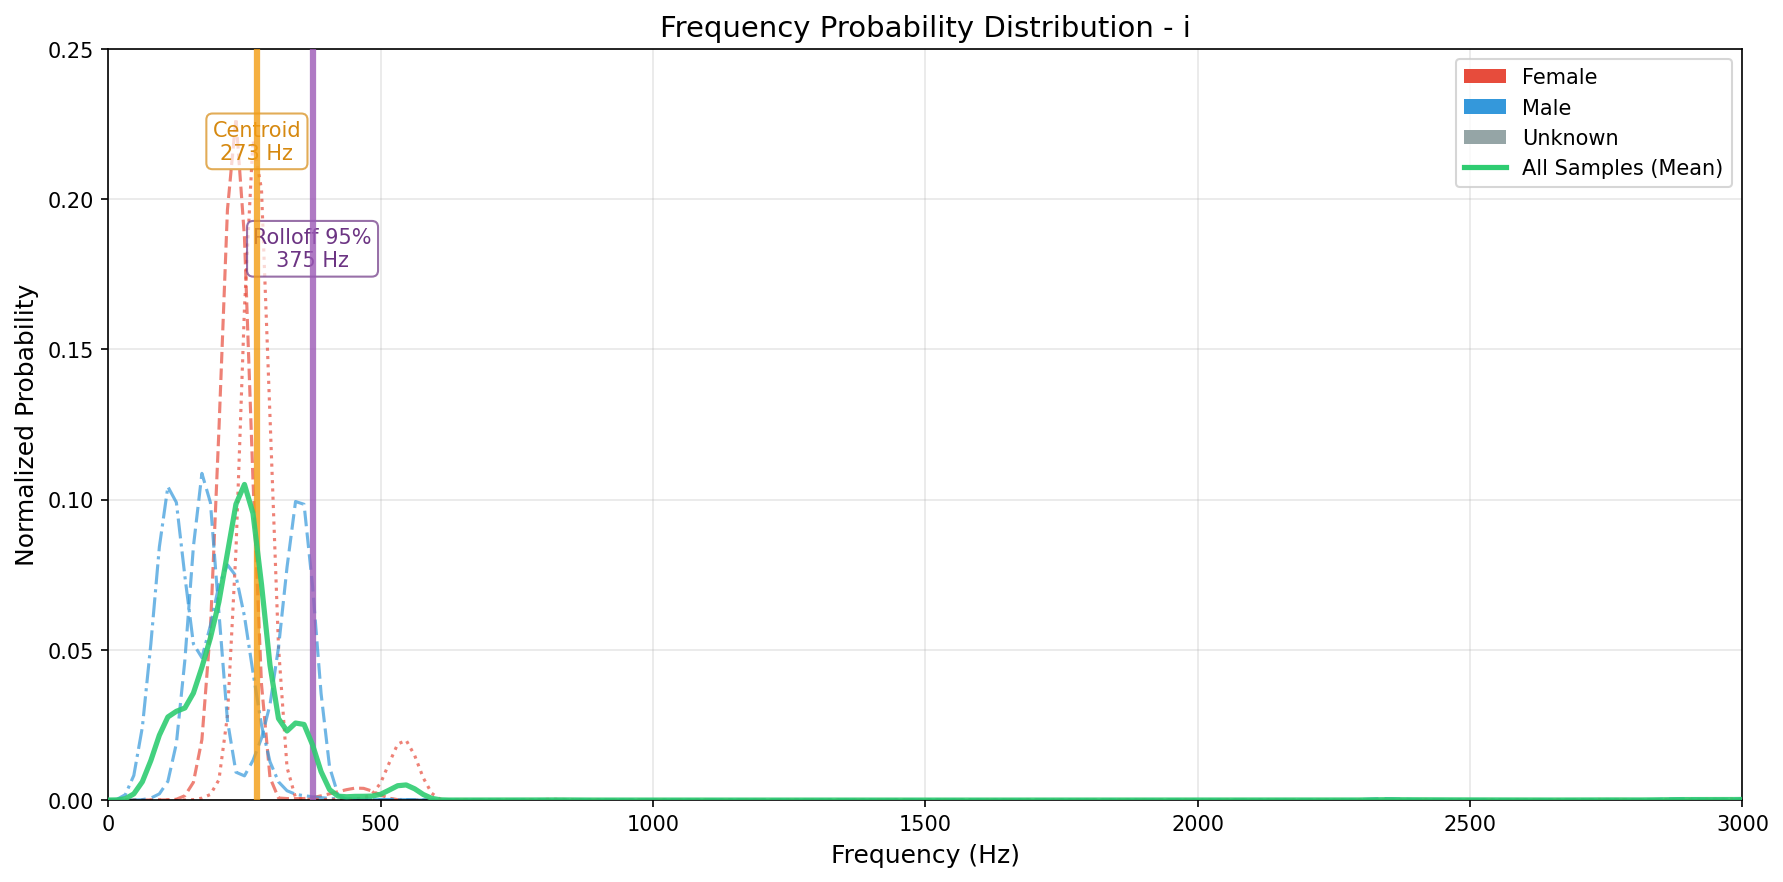
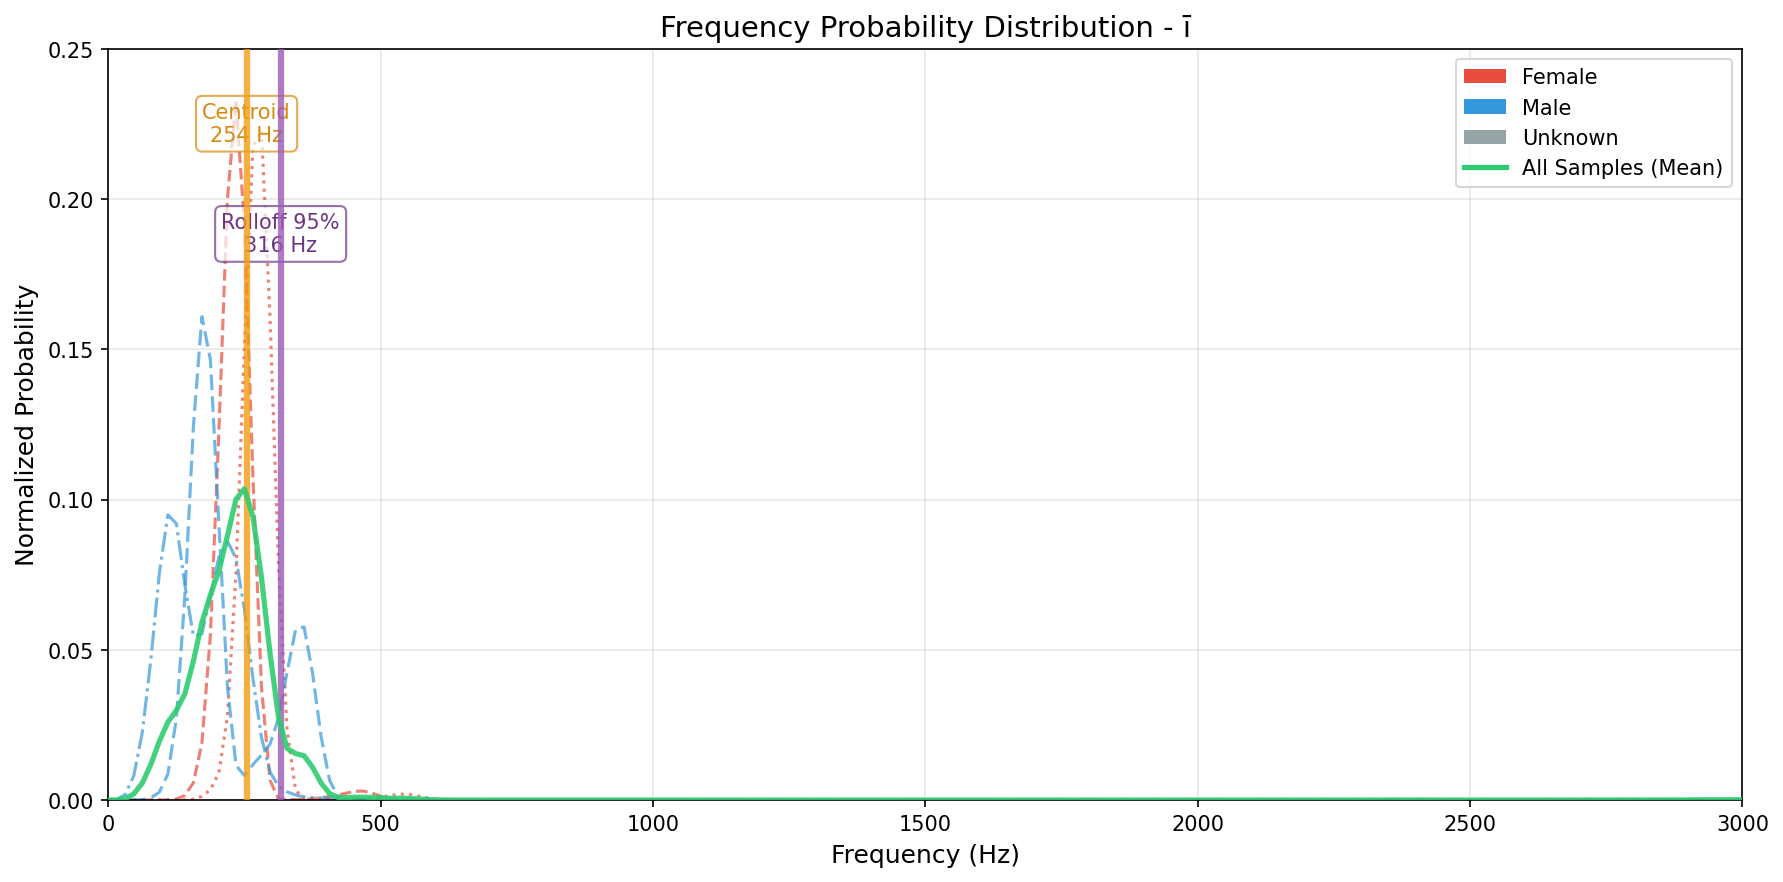
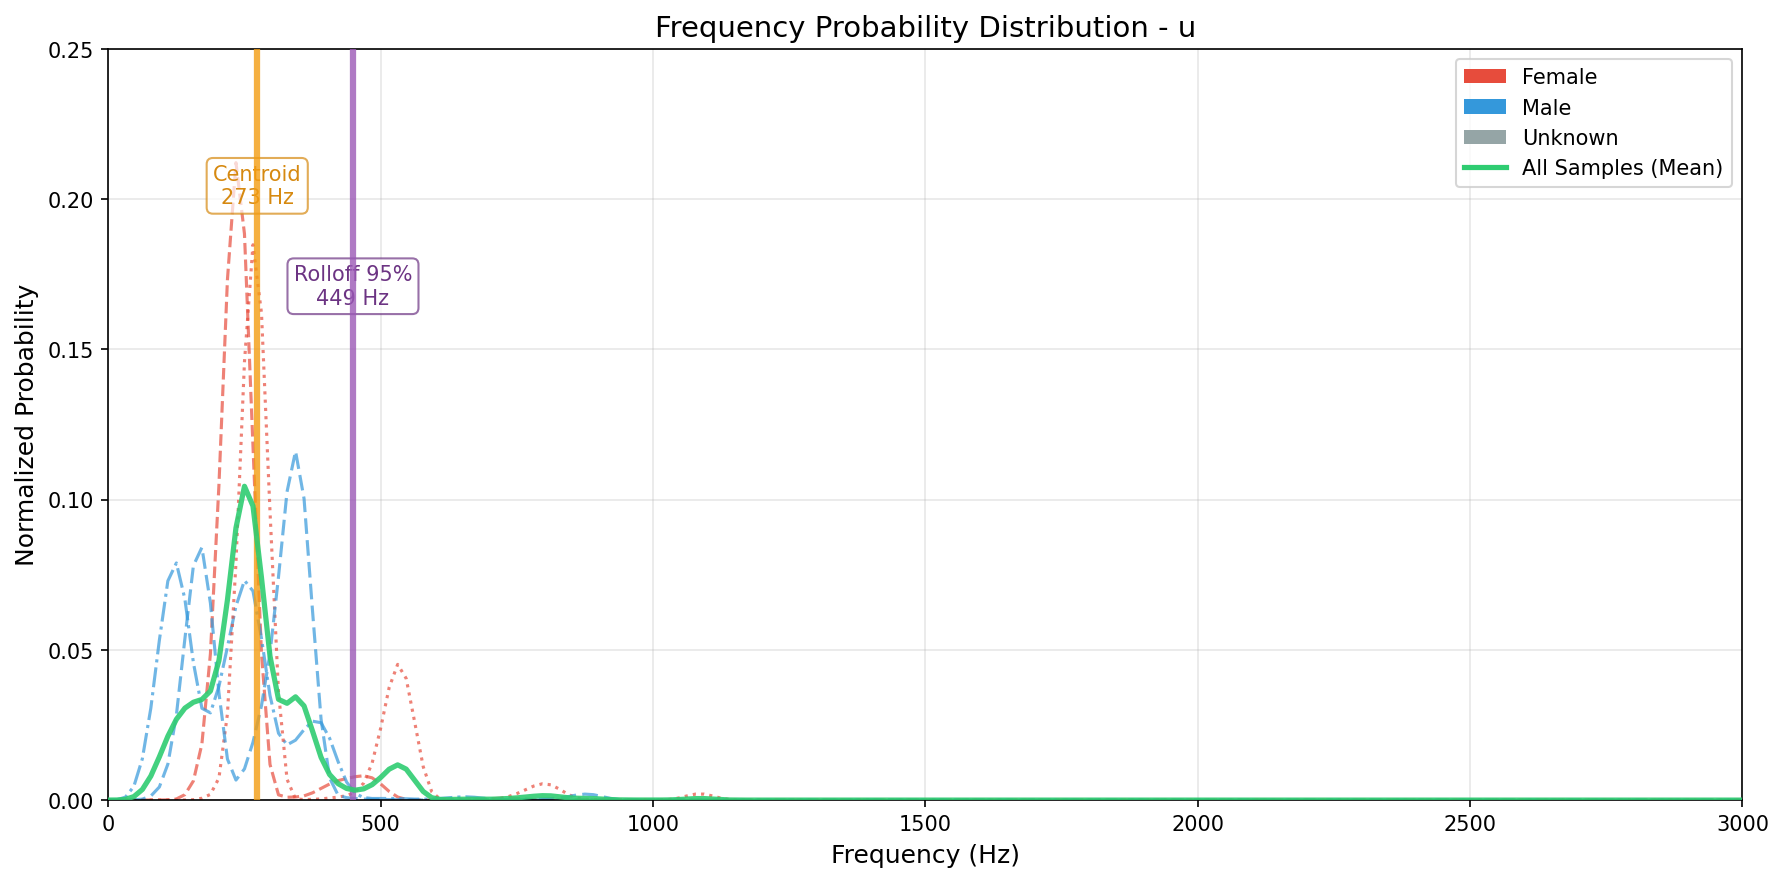
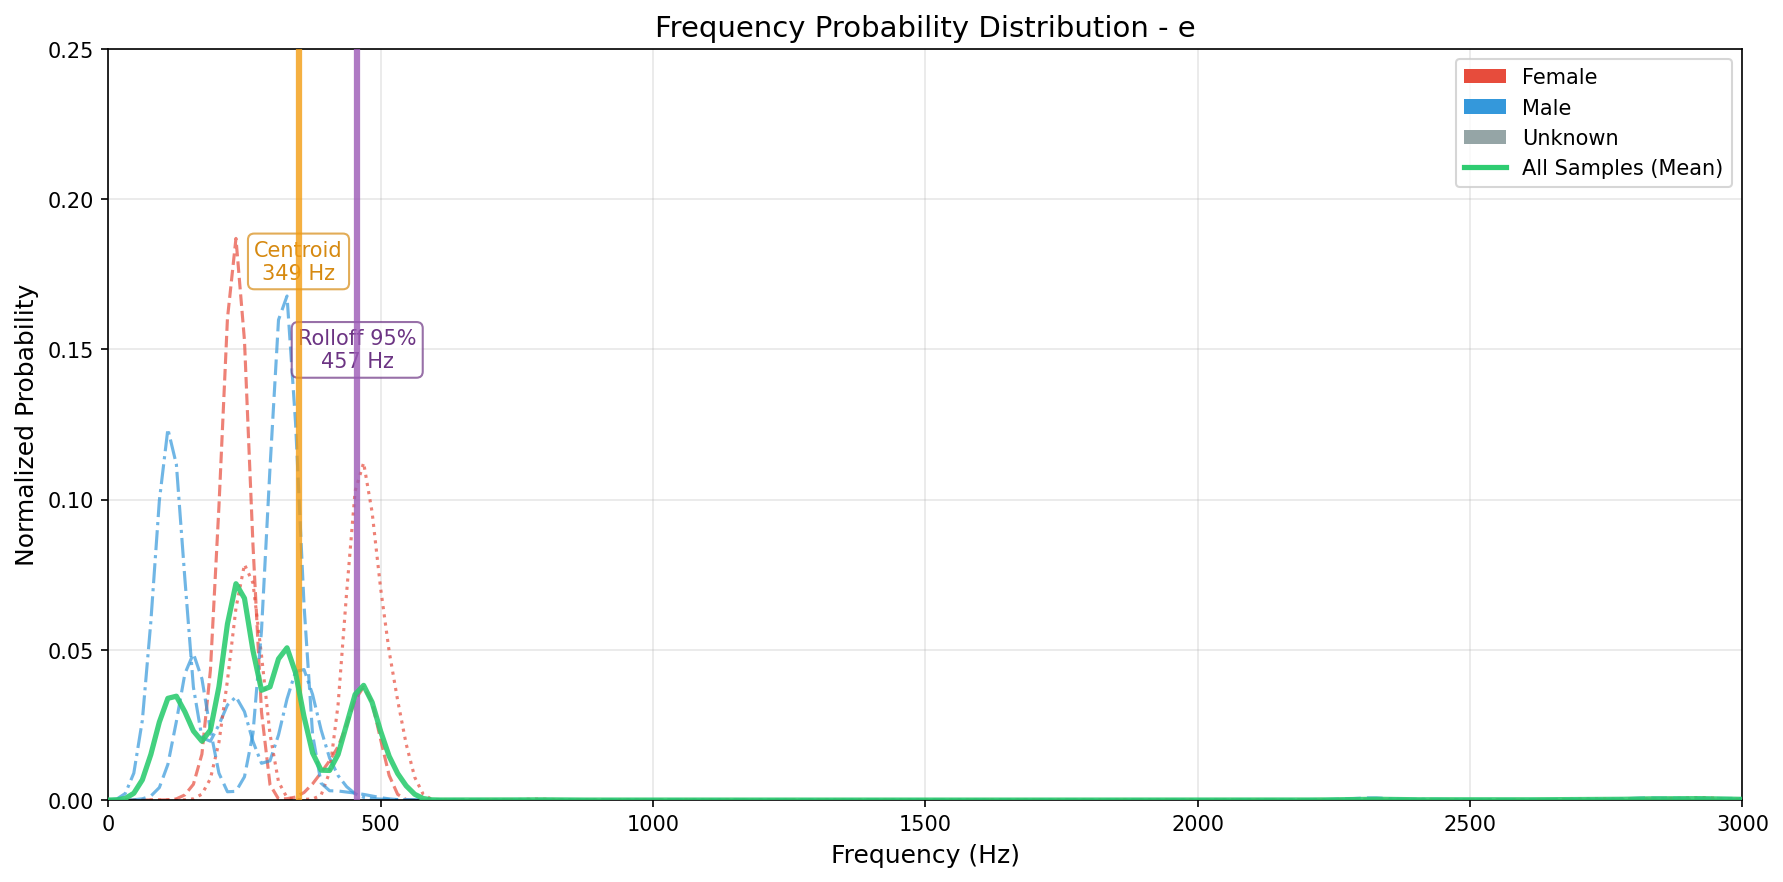
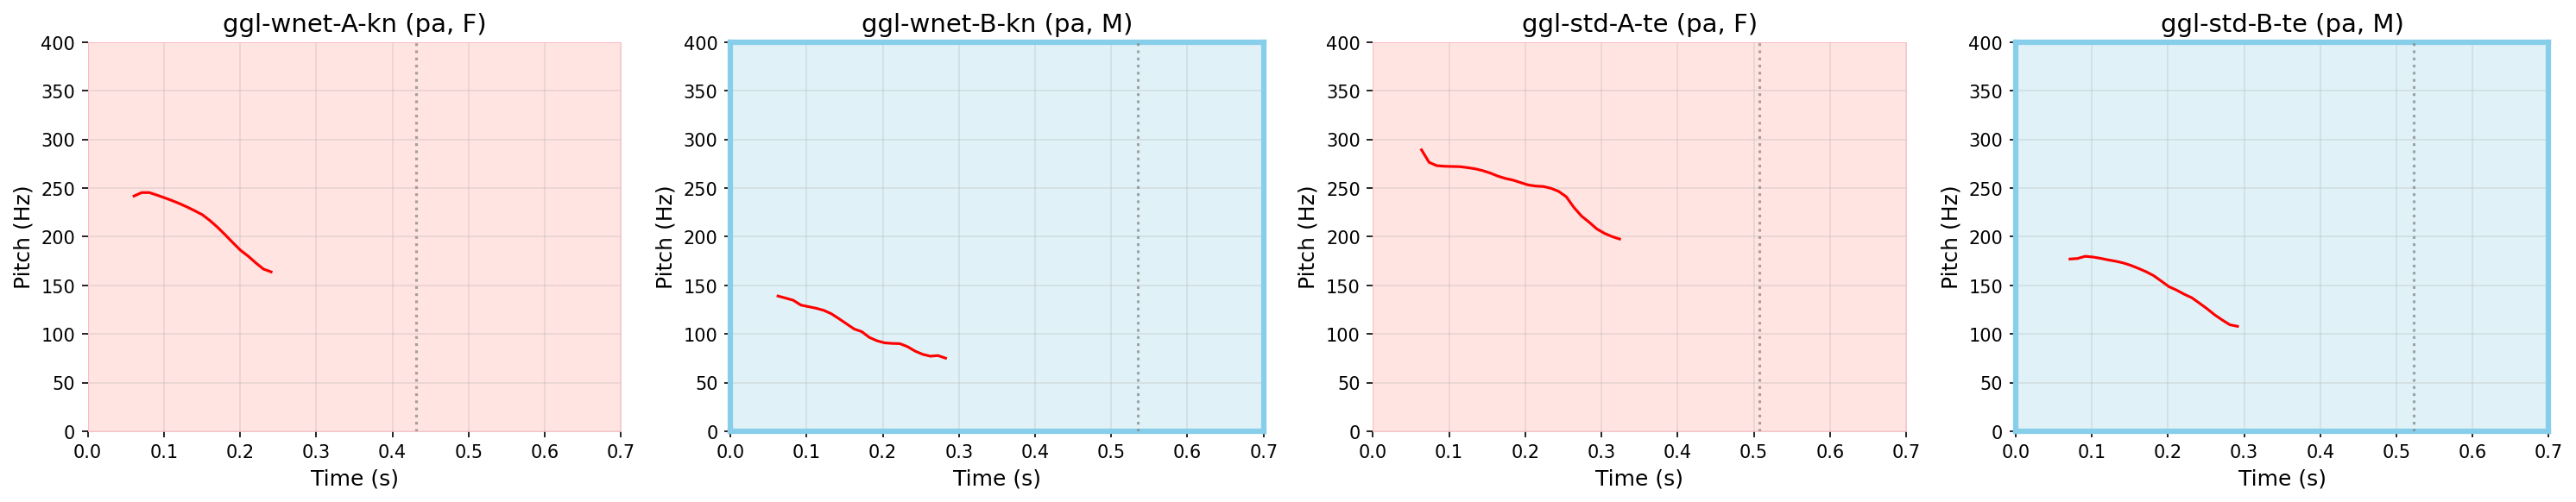
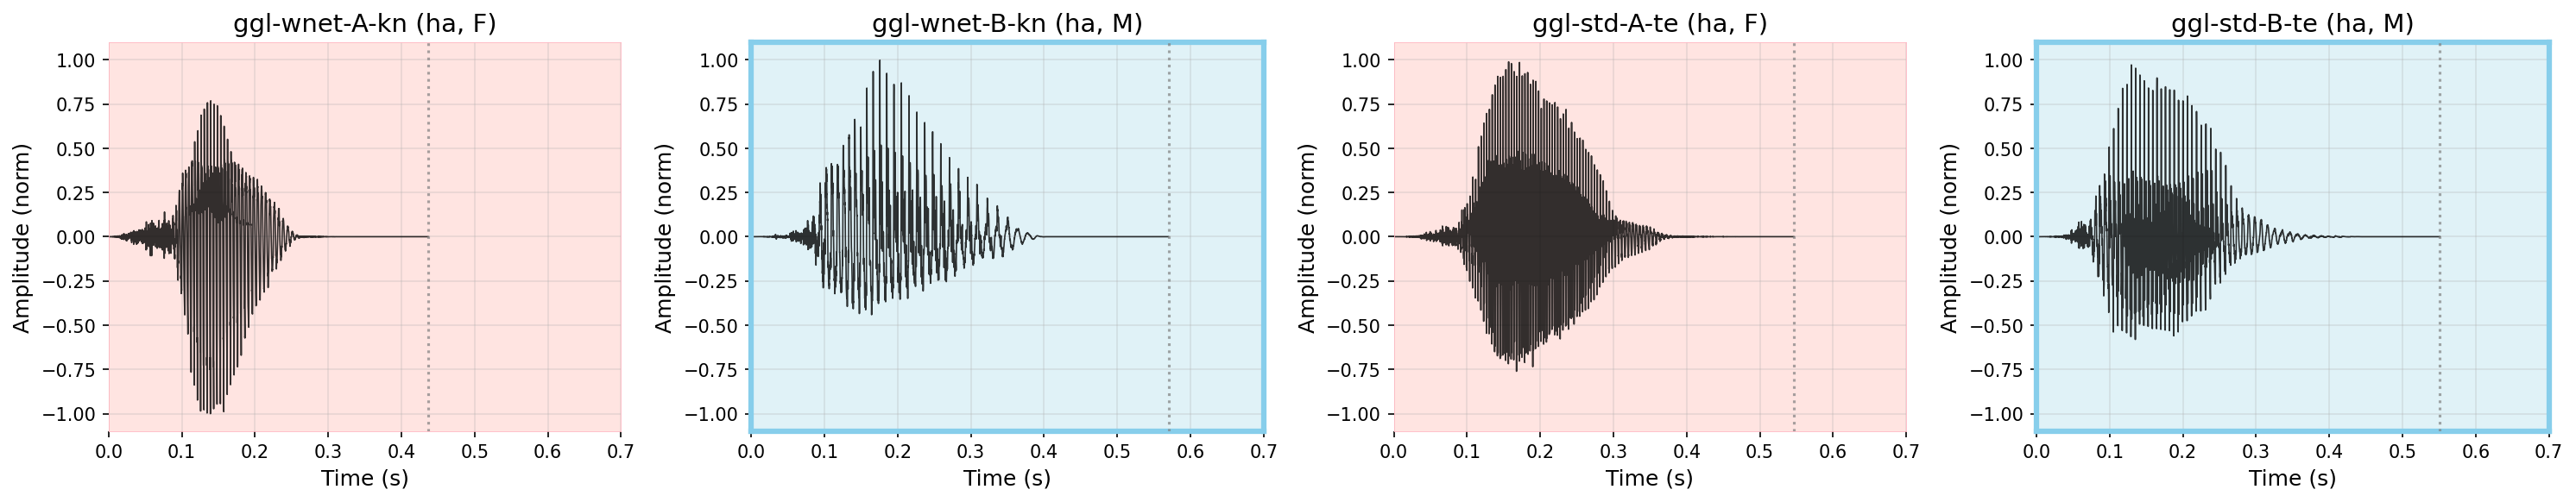
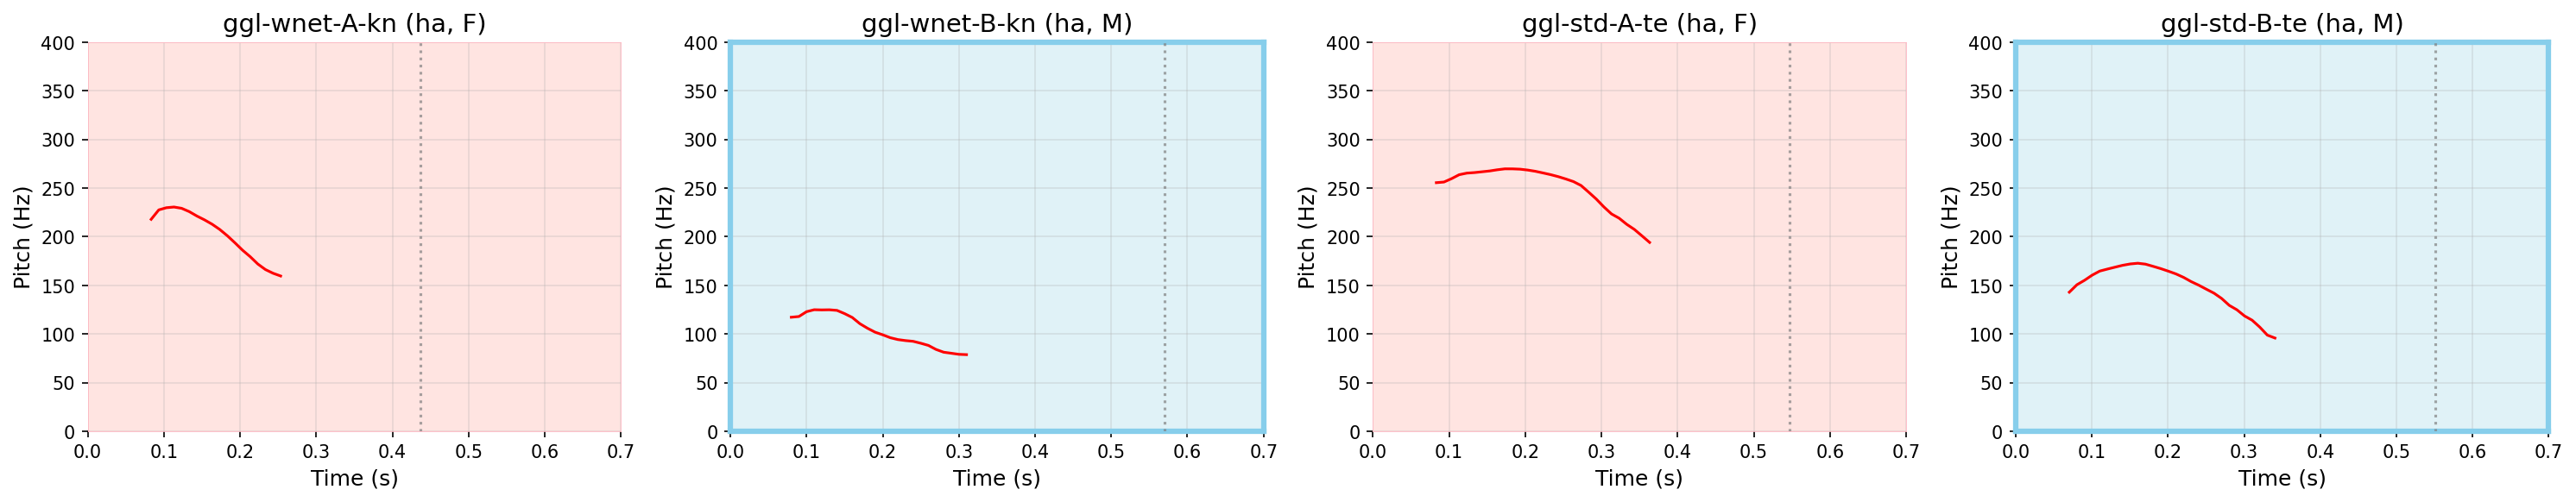
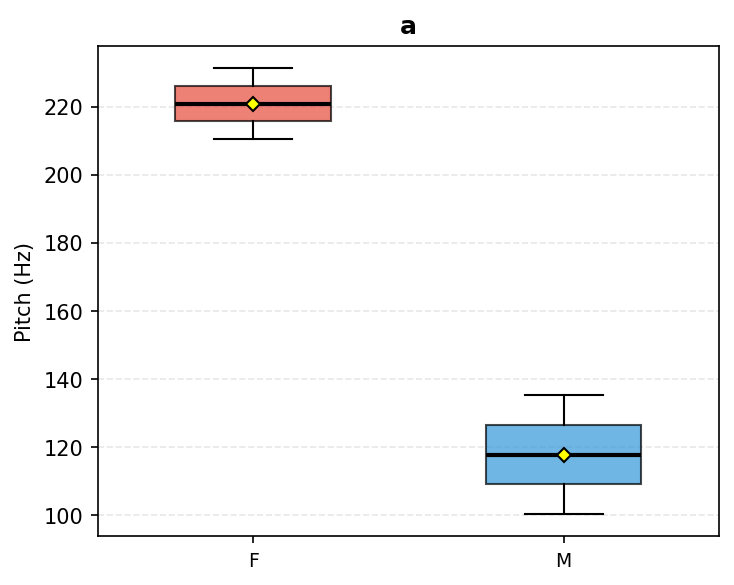
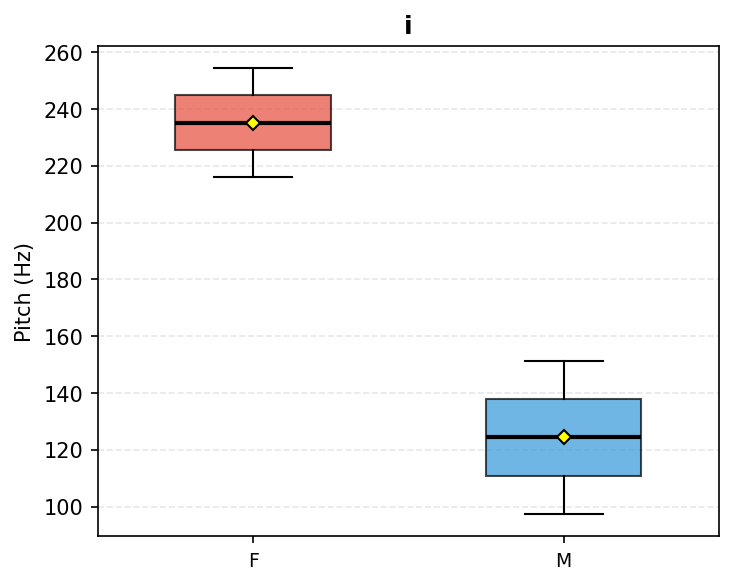
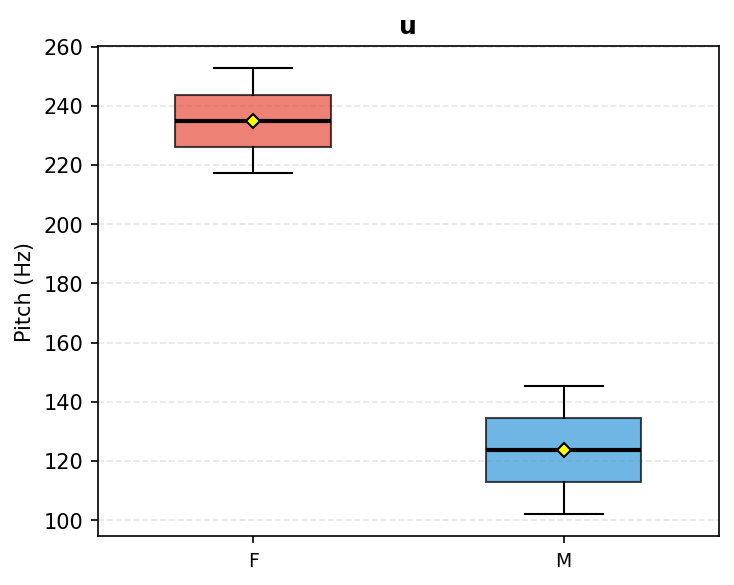
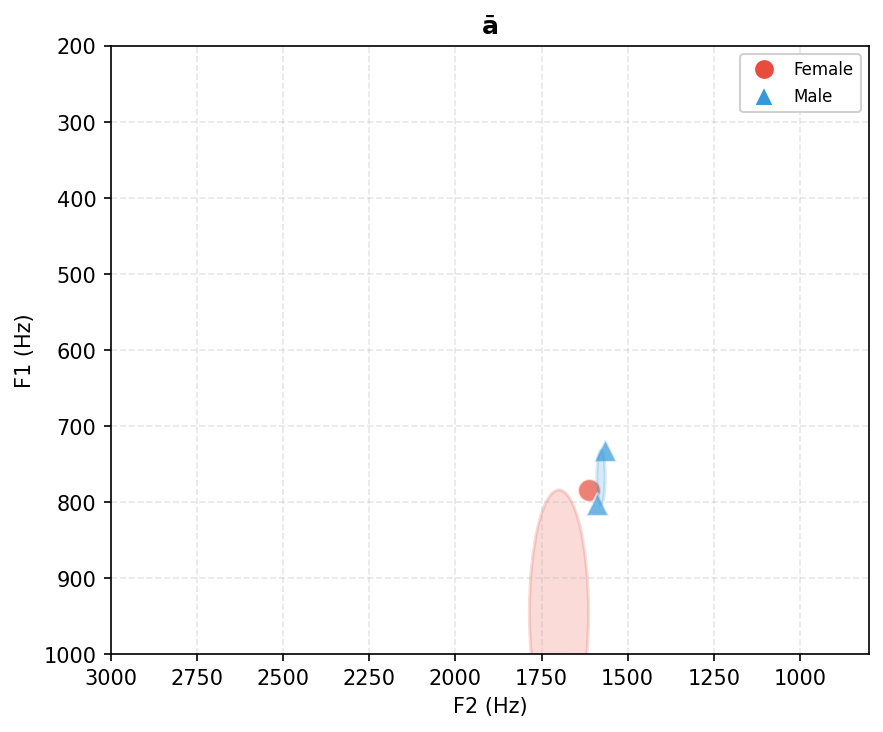
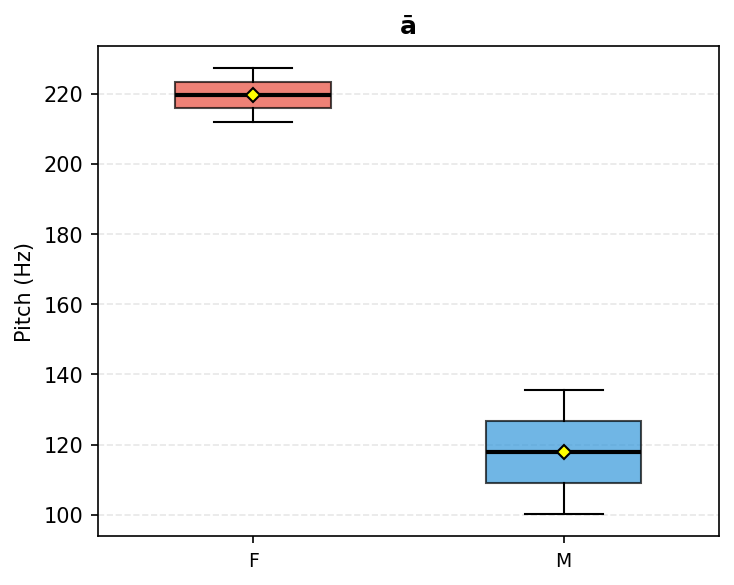
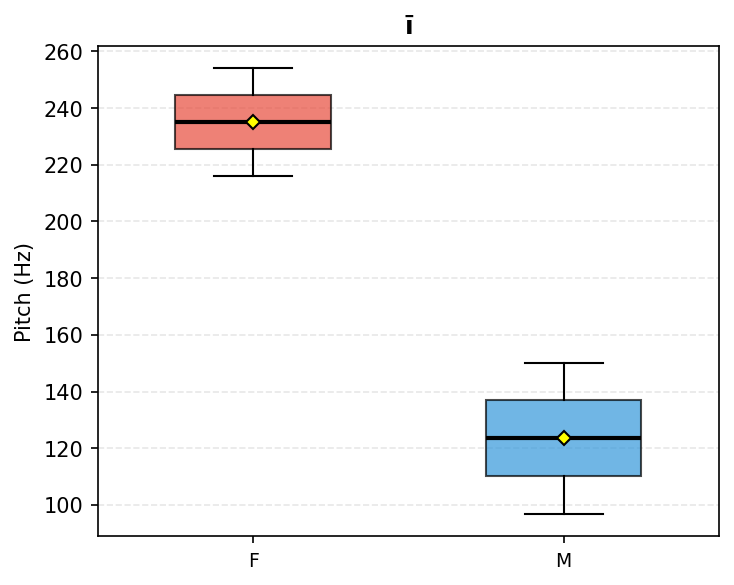
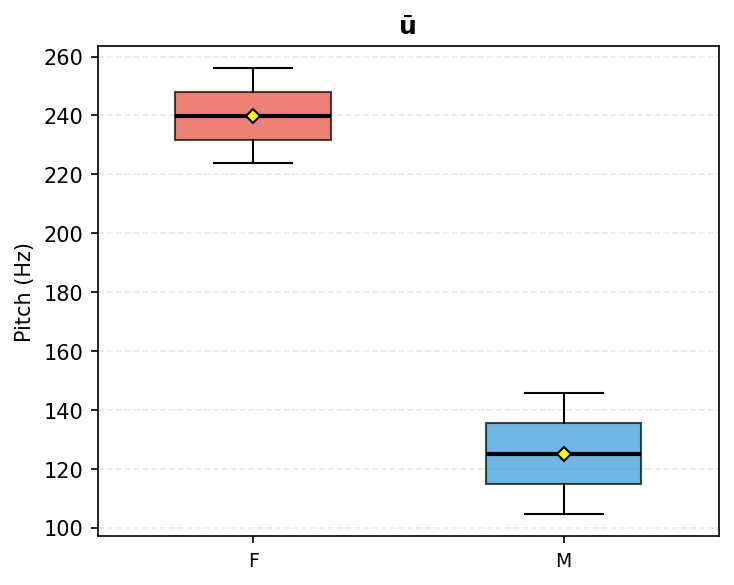
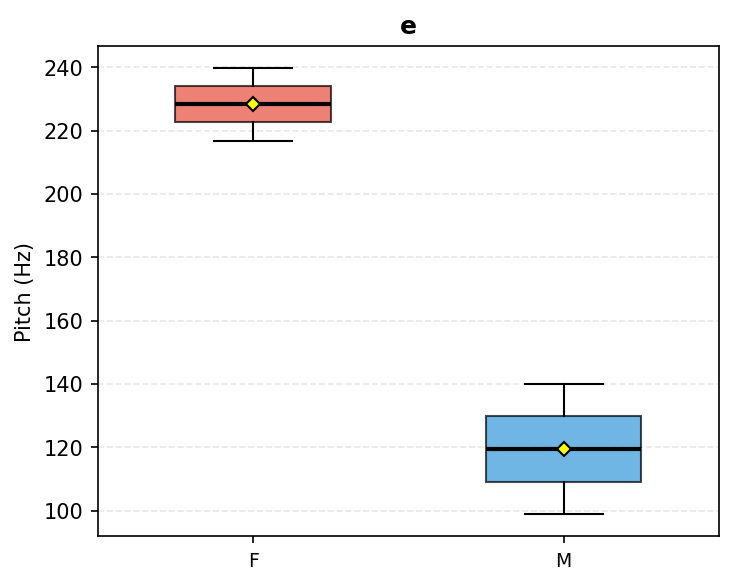
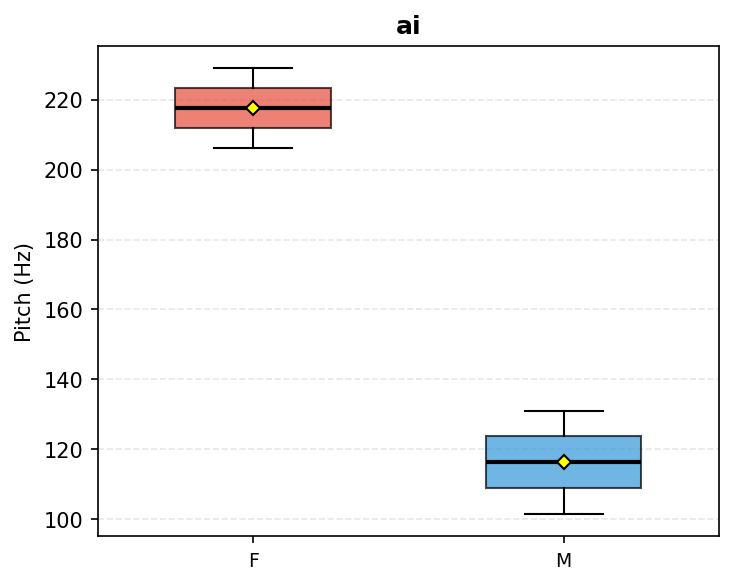
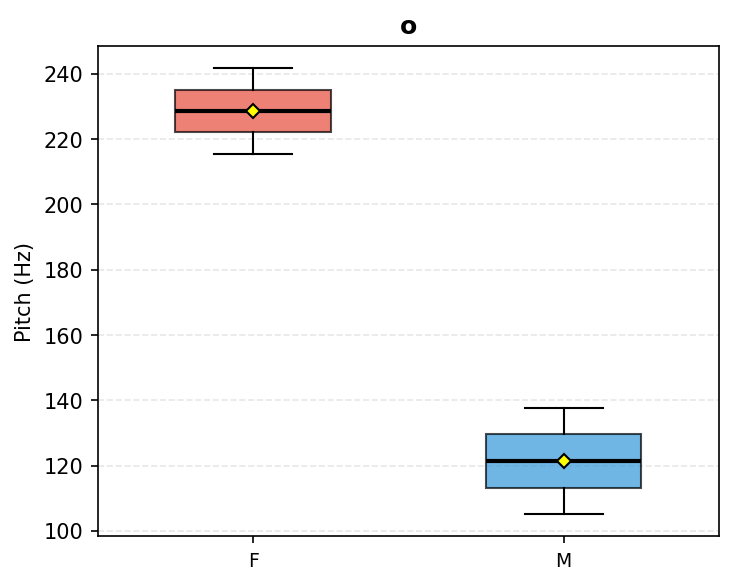
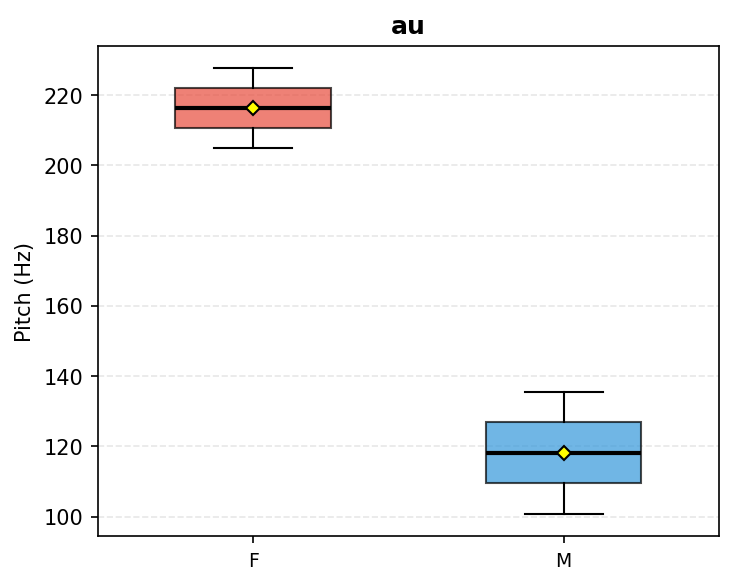
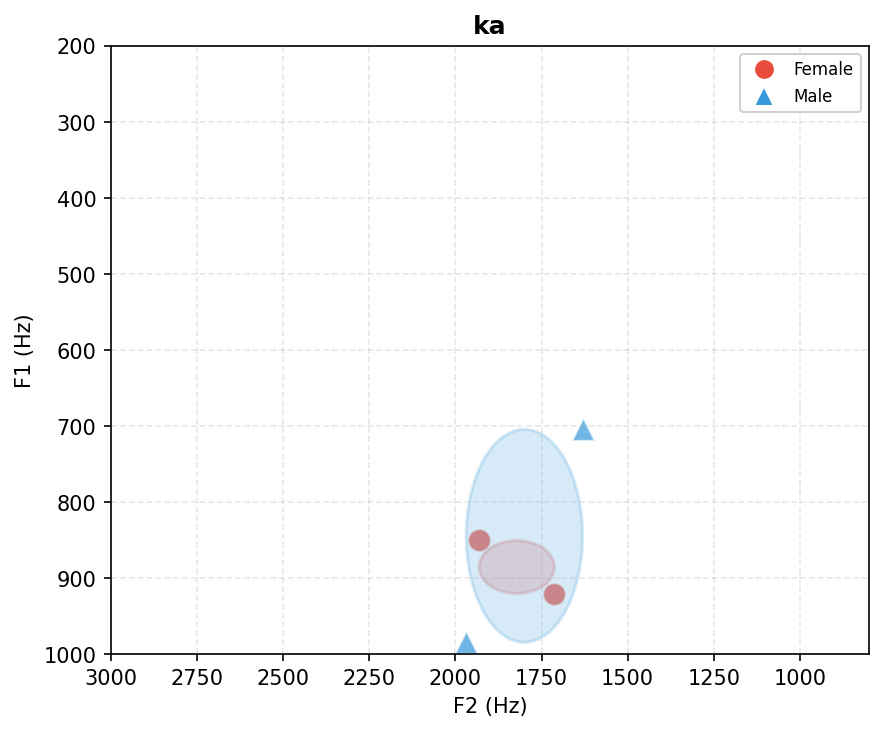
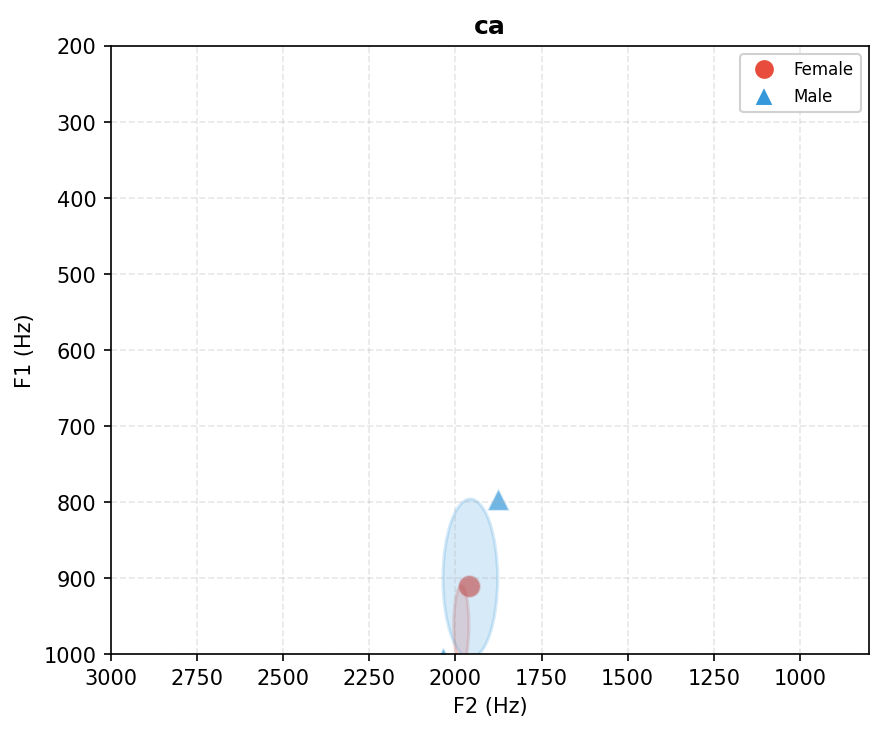
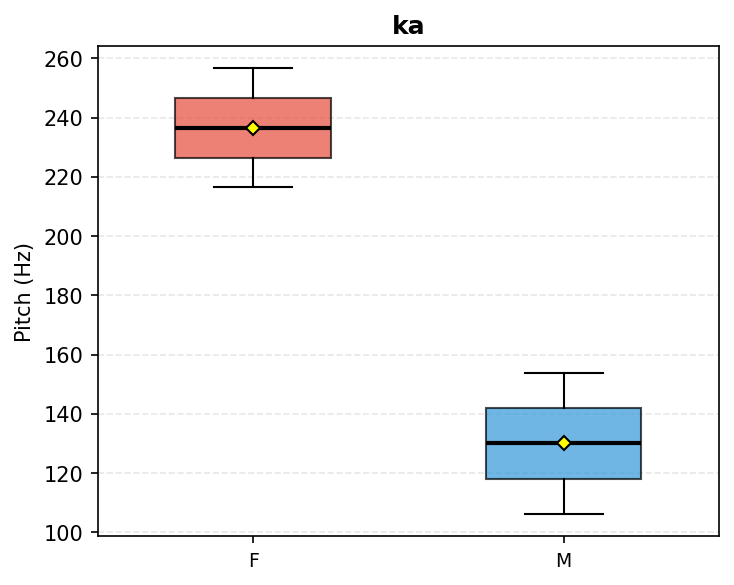
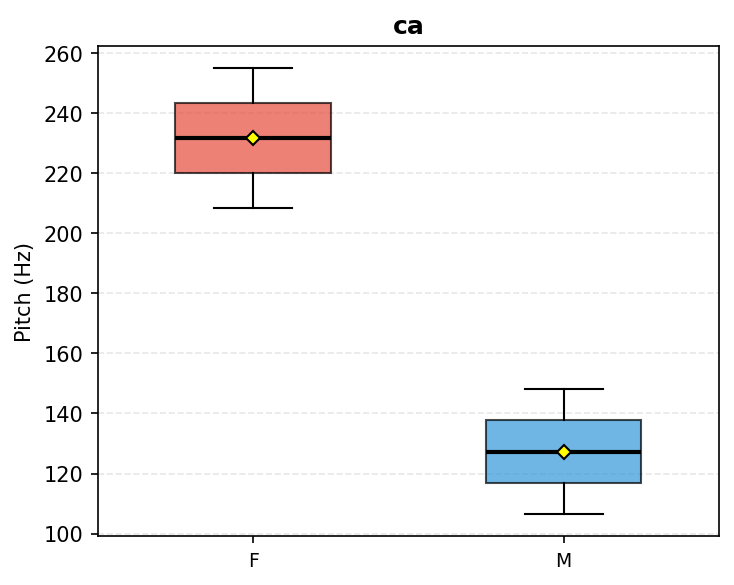
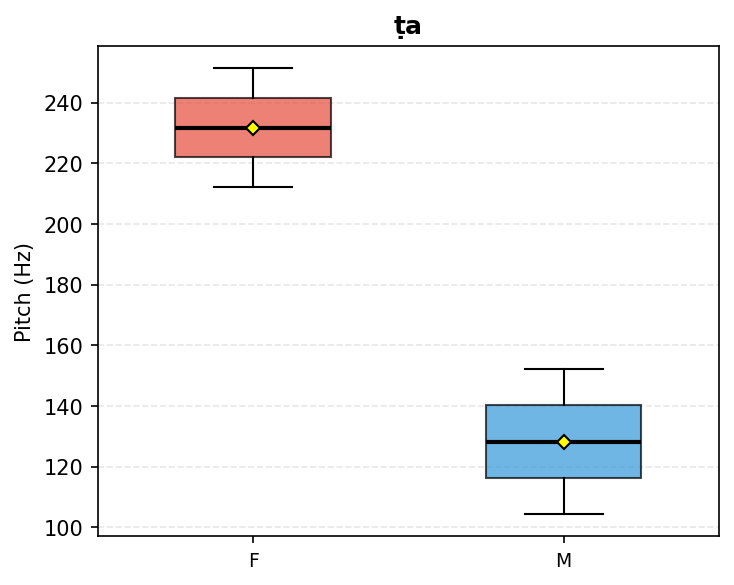
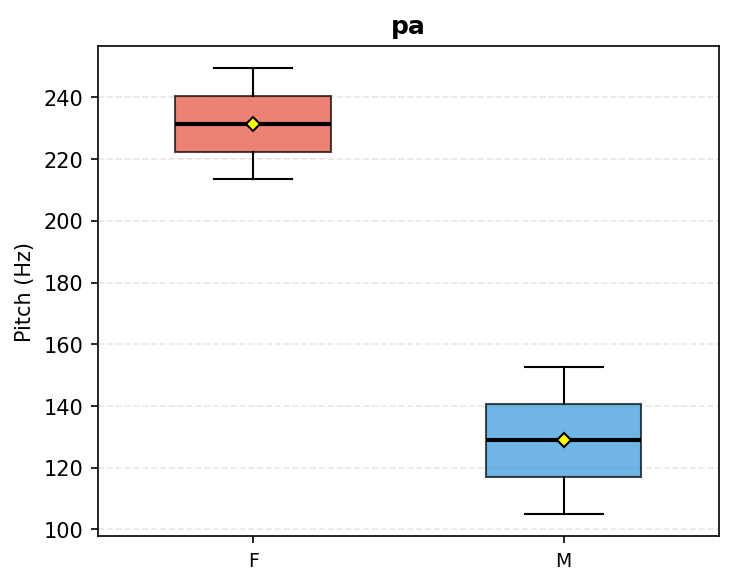
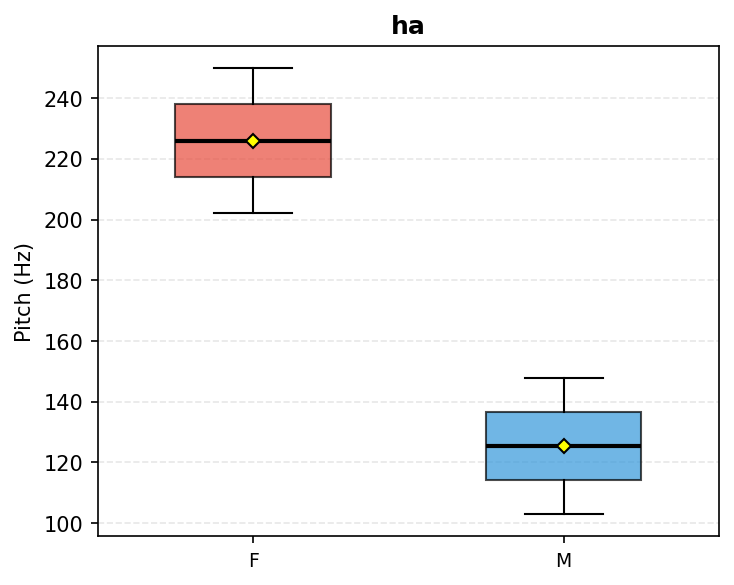
Gender Distribution: Female: 74, Male: 74