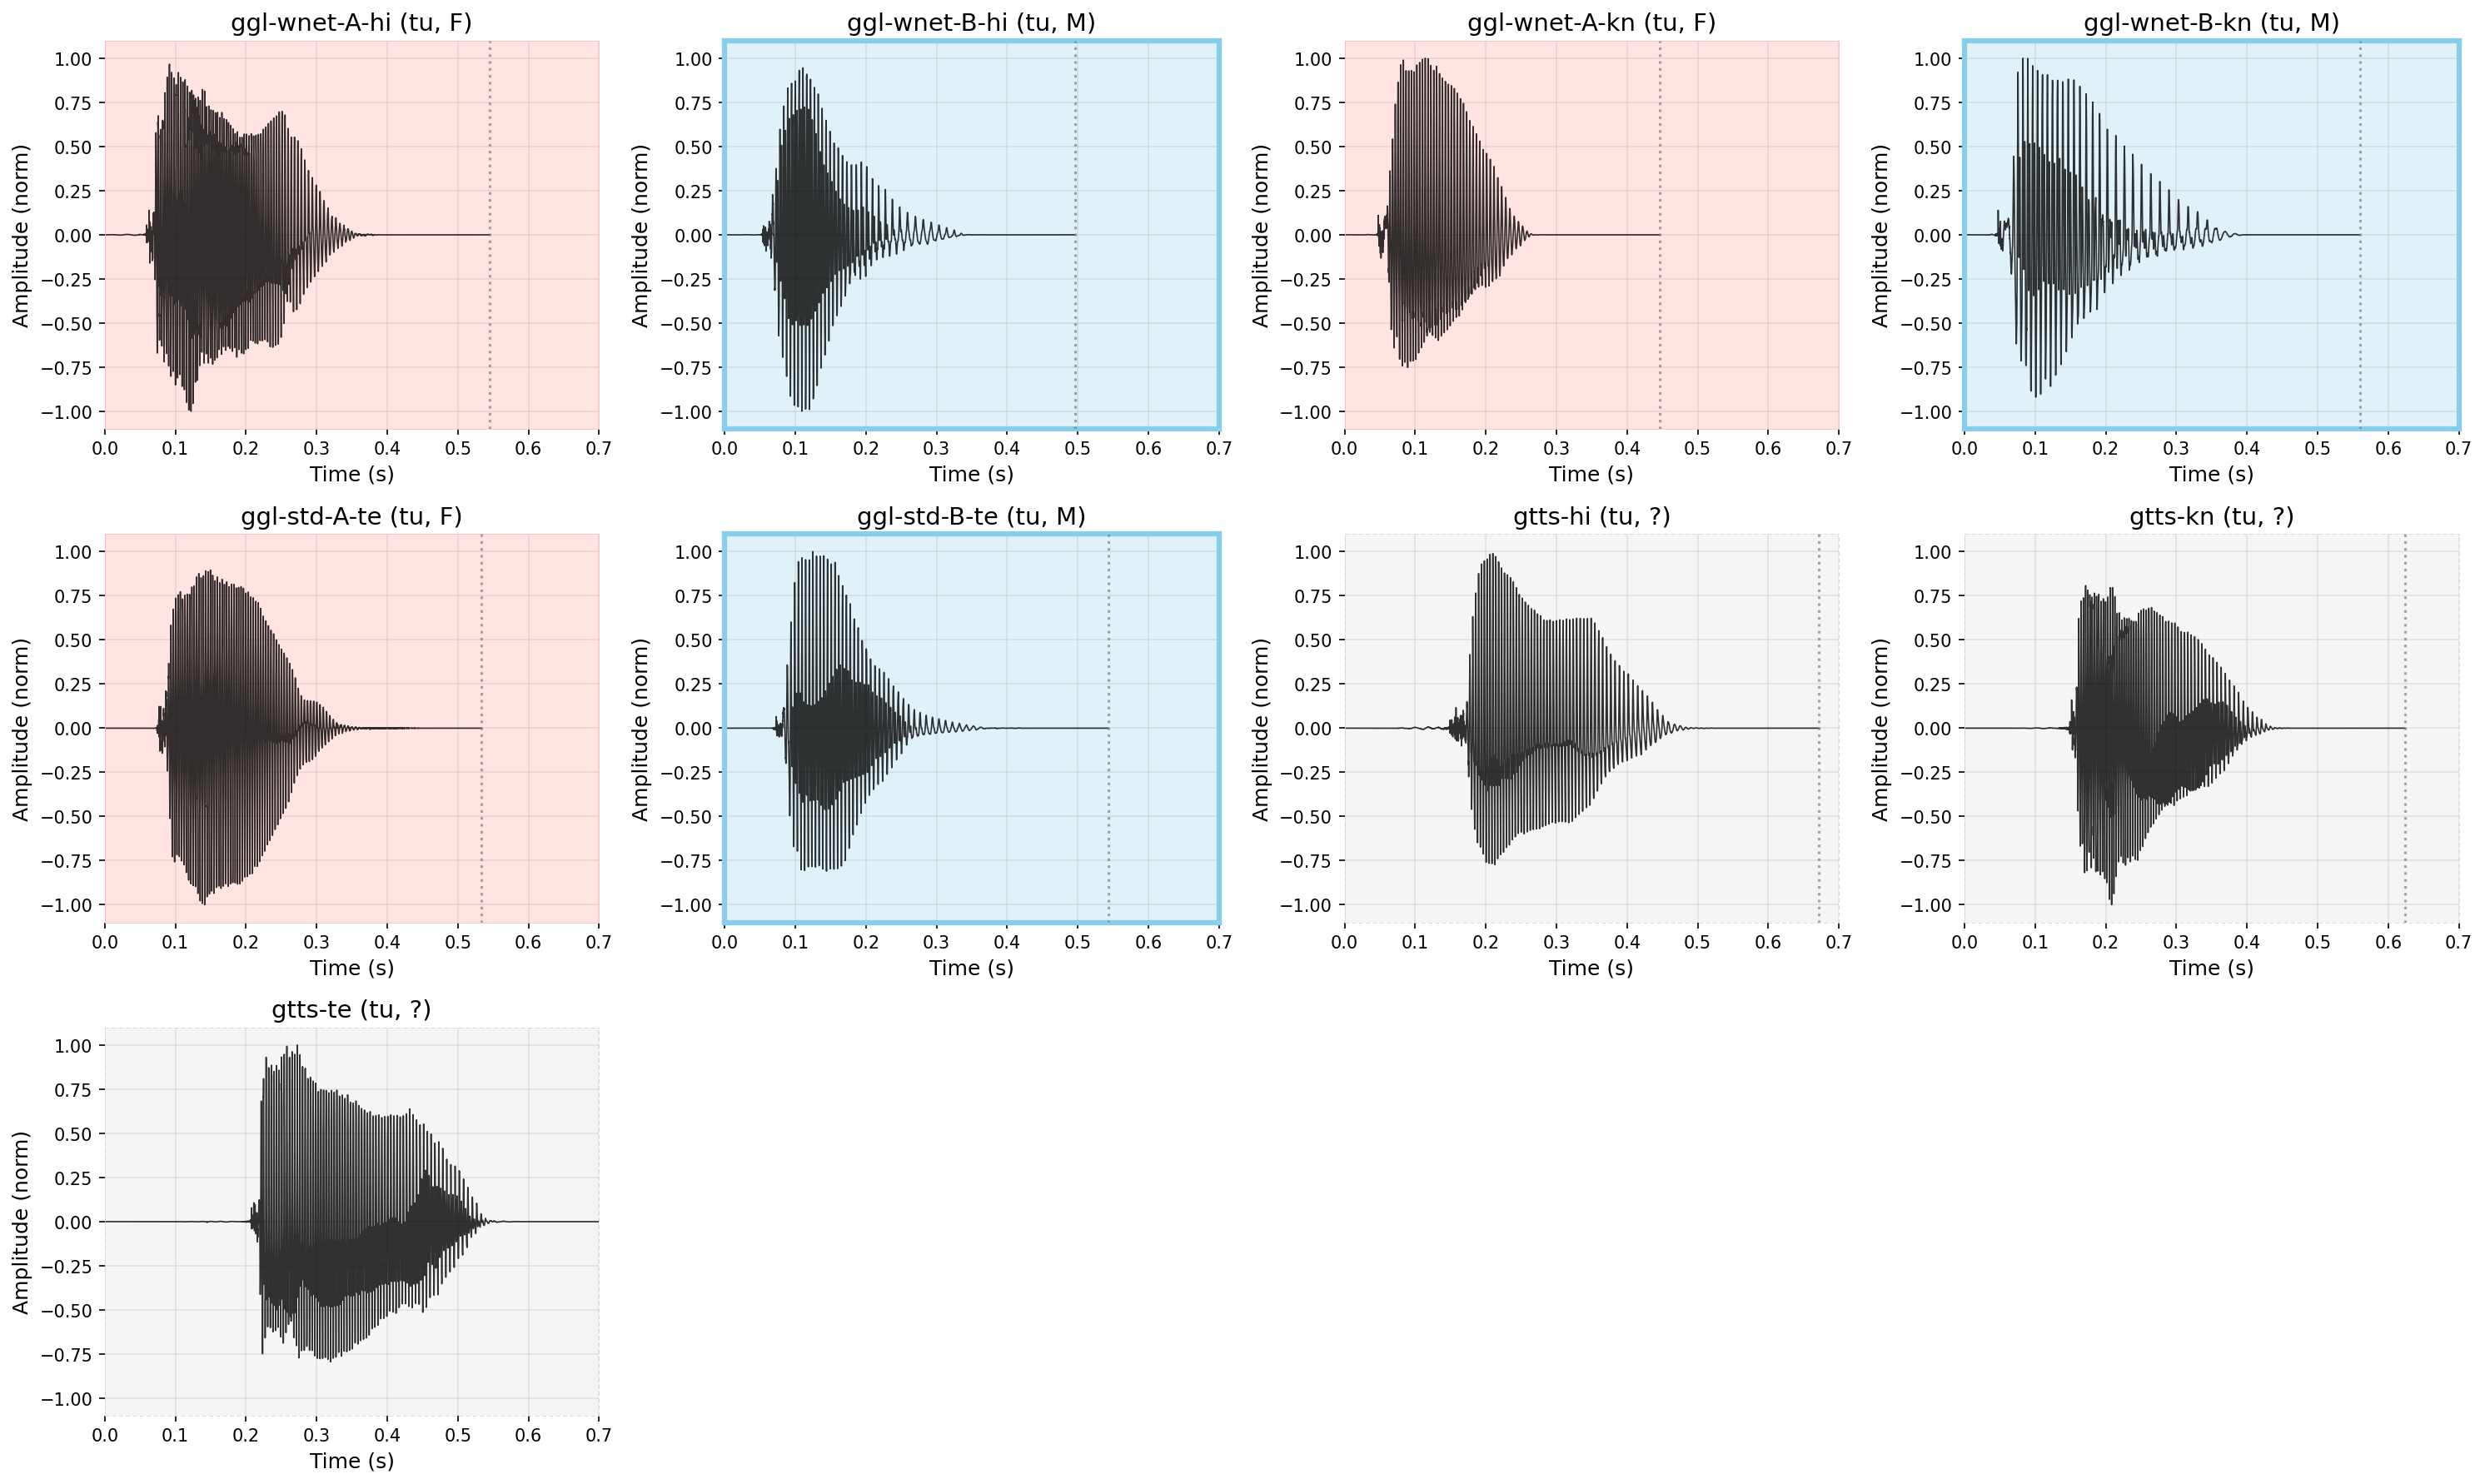
▼ Waveform (Amplitude vs Time)
Definition: Raw acoustic signal showing amplitude variation over time.
Reveals consonant bursts (sharp peaks), voicing patterns (oscillations), and vowel steady-state regions (regular oscillations).
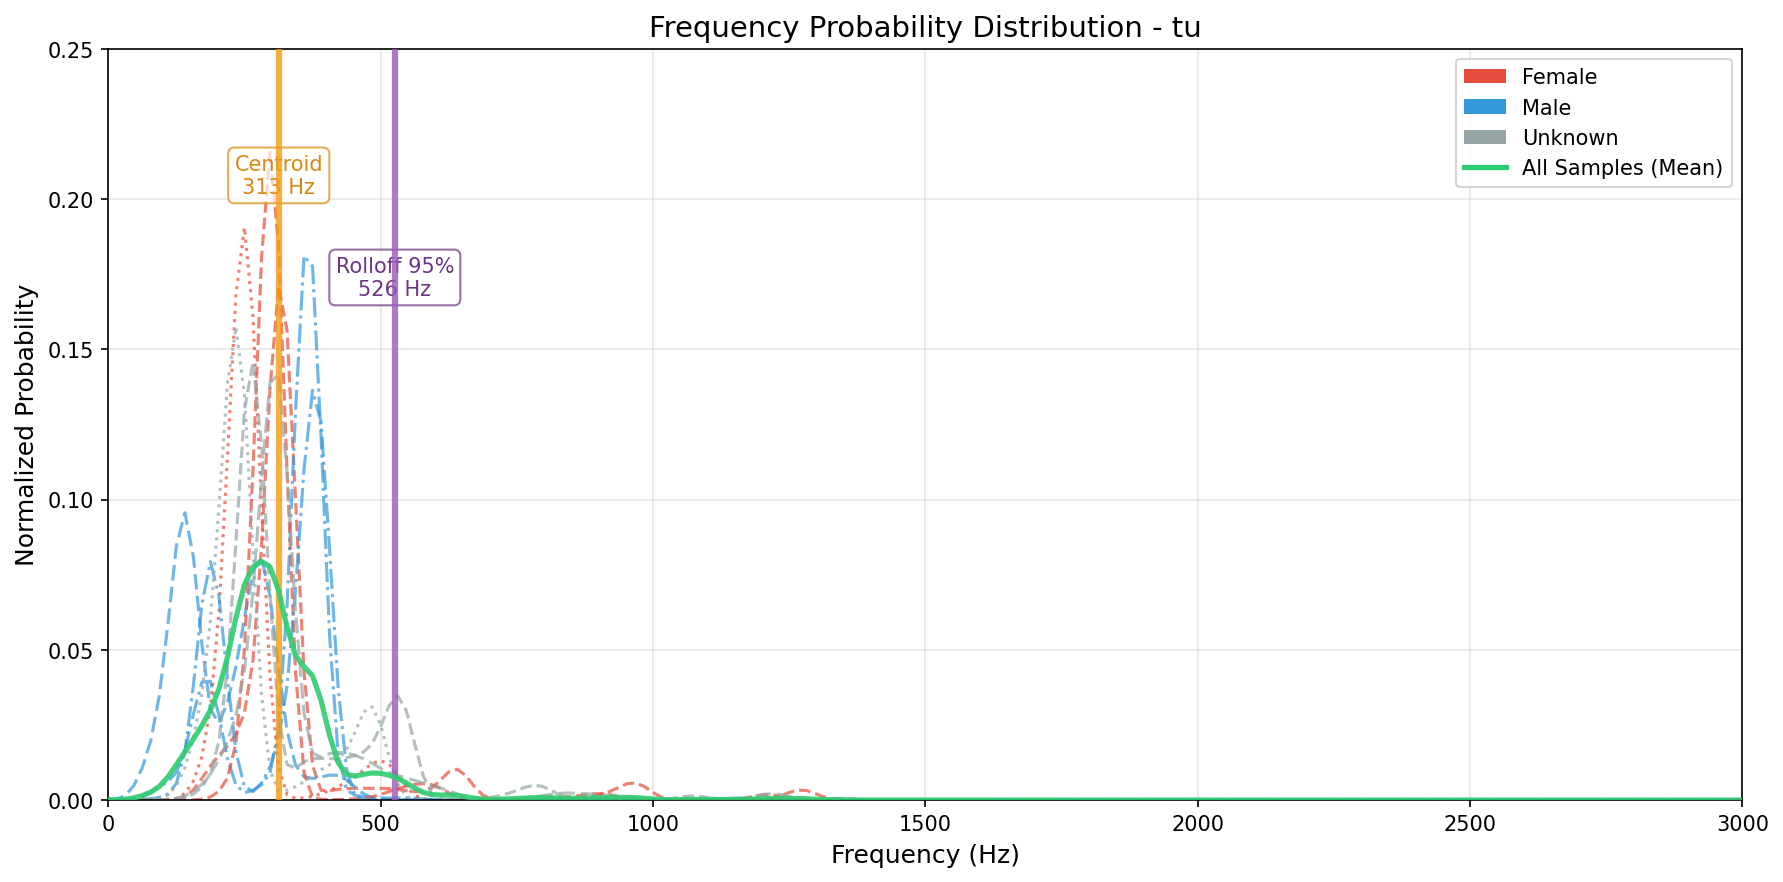
▼ Frequency Probability Distribution
Definition: Normalized frequency energy distribution showing the relative power at each frequency.
Each curve represents one utterance. The area under the curve integrates to 1 (probability distribution).
- Spectral Centroid (dotted line): Weighted mean frequency—indicates the "center of mass" of the spectrum. Higher centroid = brighter sound (more high-frequency energy).
- Spectral Rolloff 95% (dashed line): Frequency containing 95% of the total energy. Captures the high-frequency cutoff of the sound.
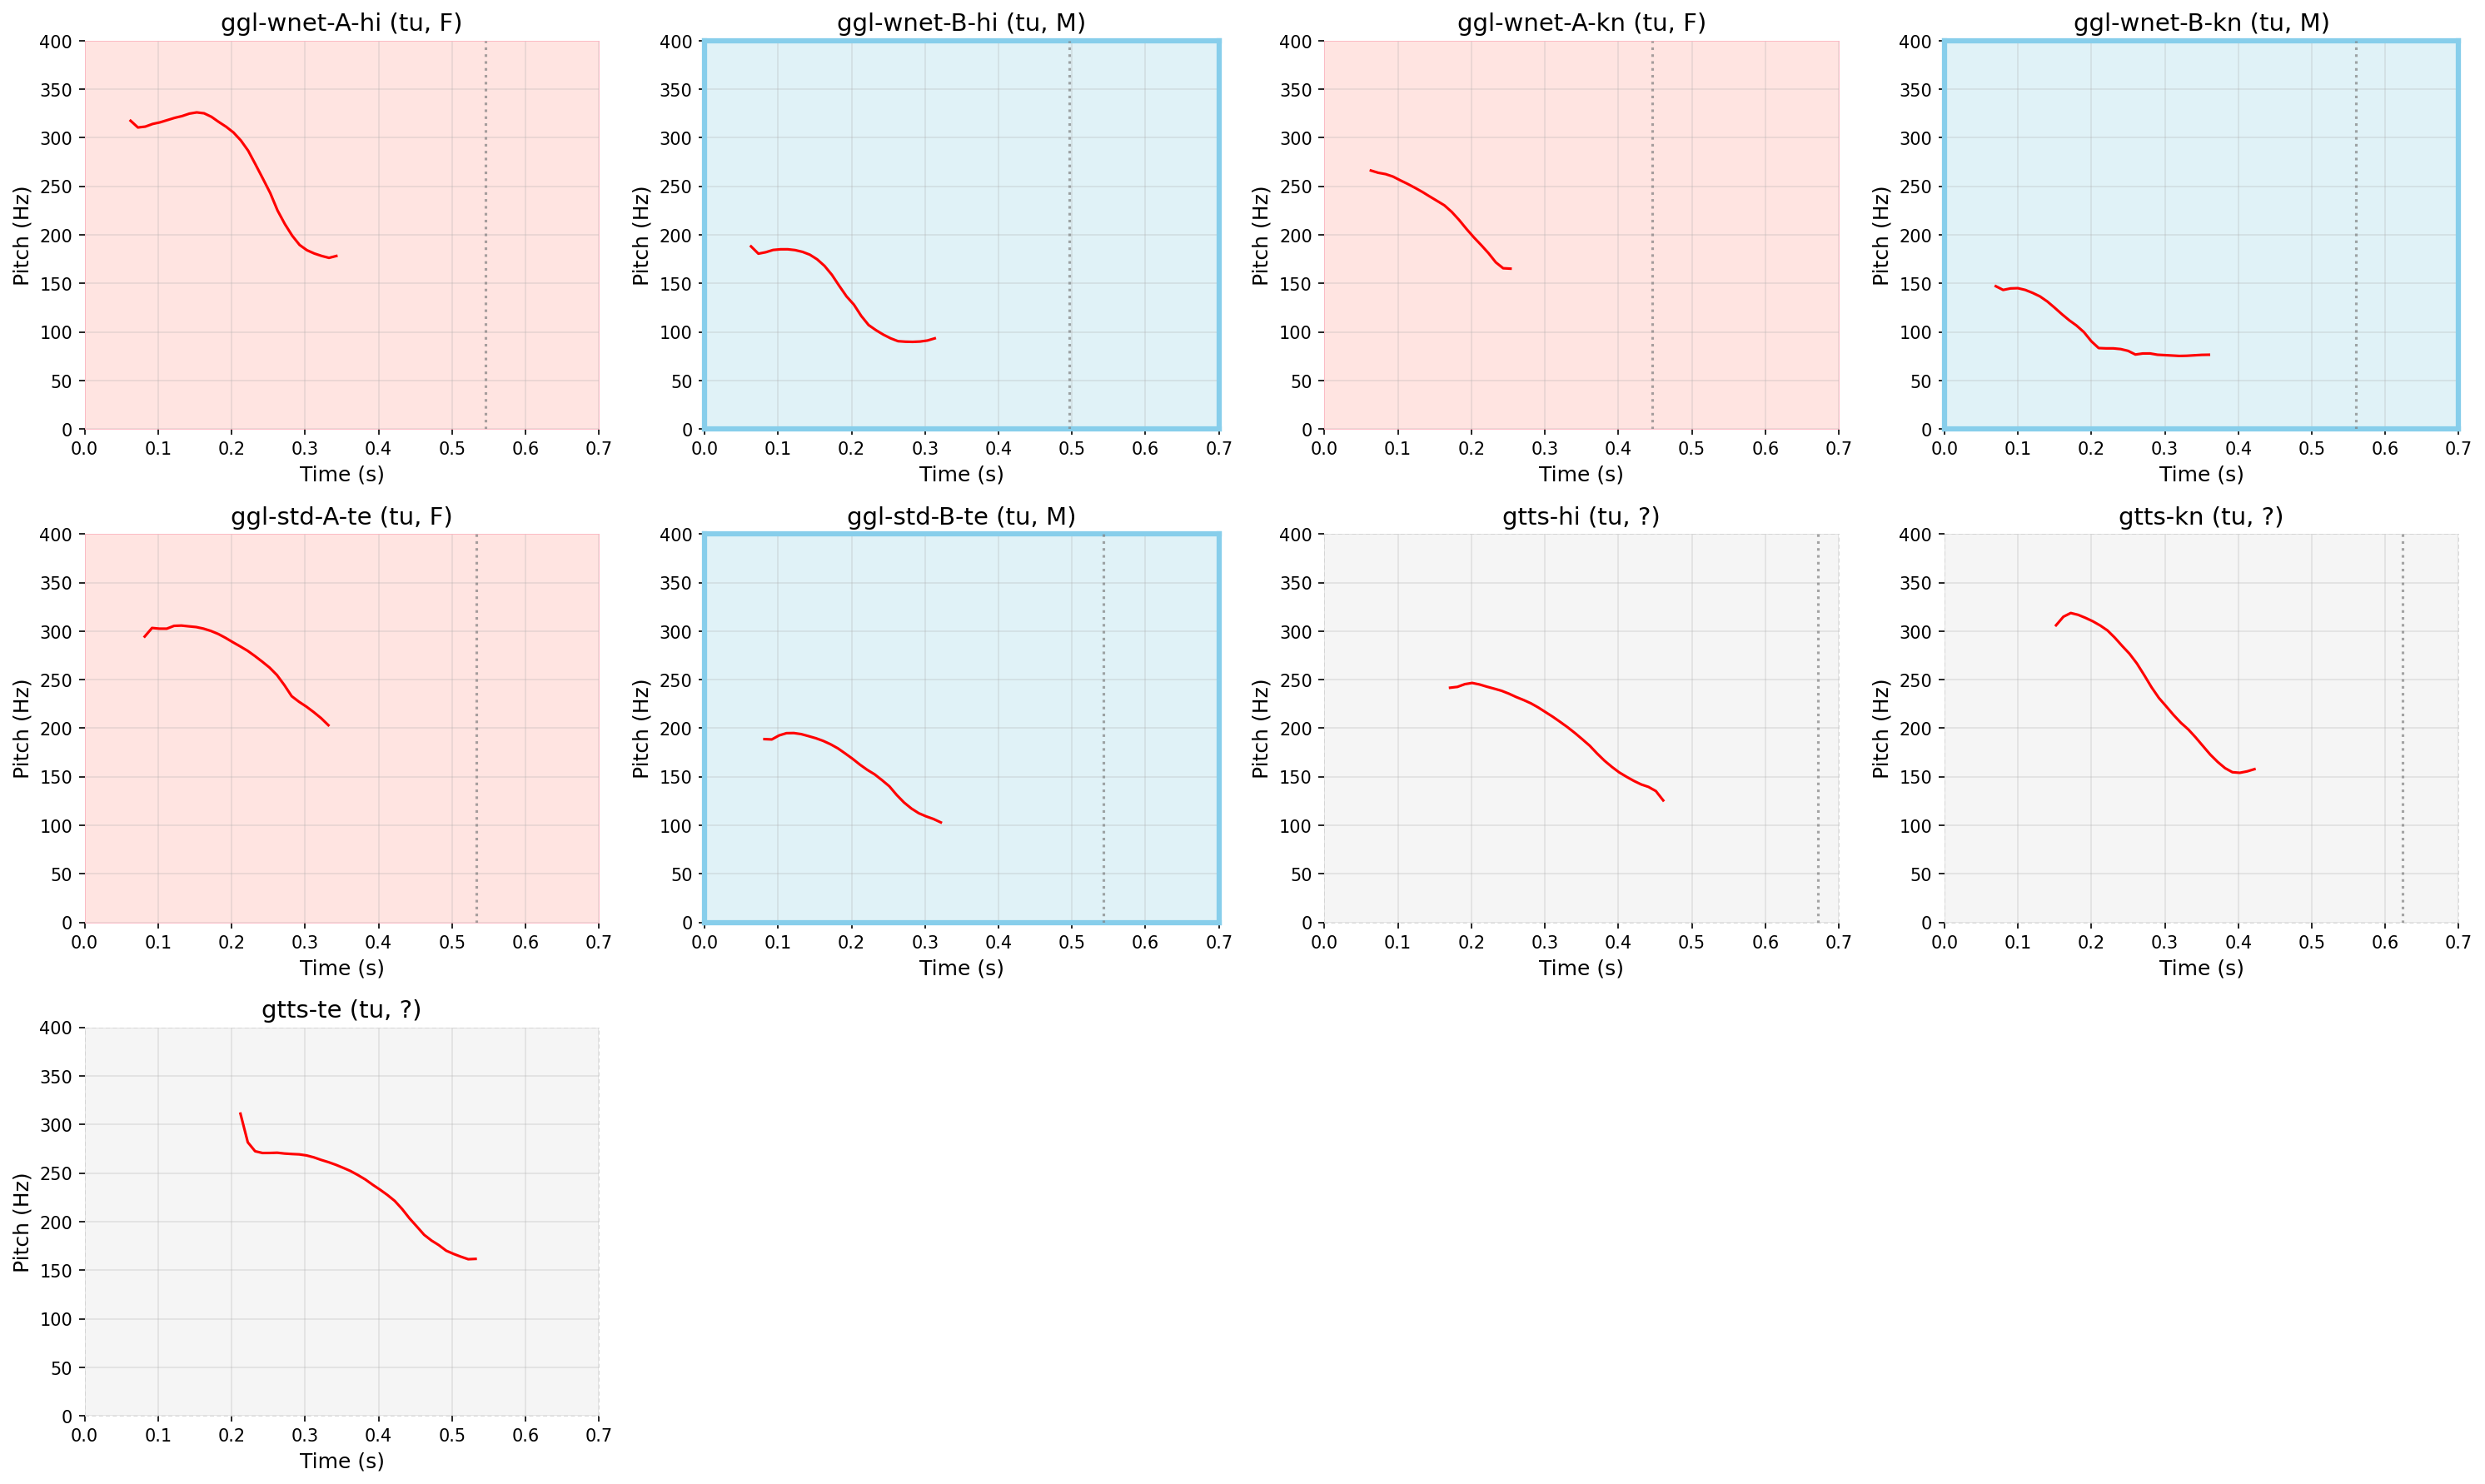
▼ Pitch vs Time
Definition: Fundamental frequency (F0) in Hertz.
Represents the perceived tone or "musical note" of the voice. Higher Hz = higher pitch.
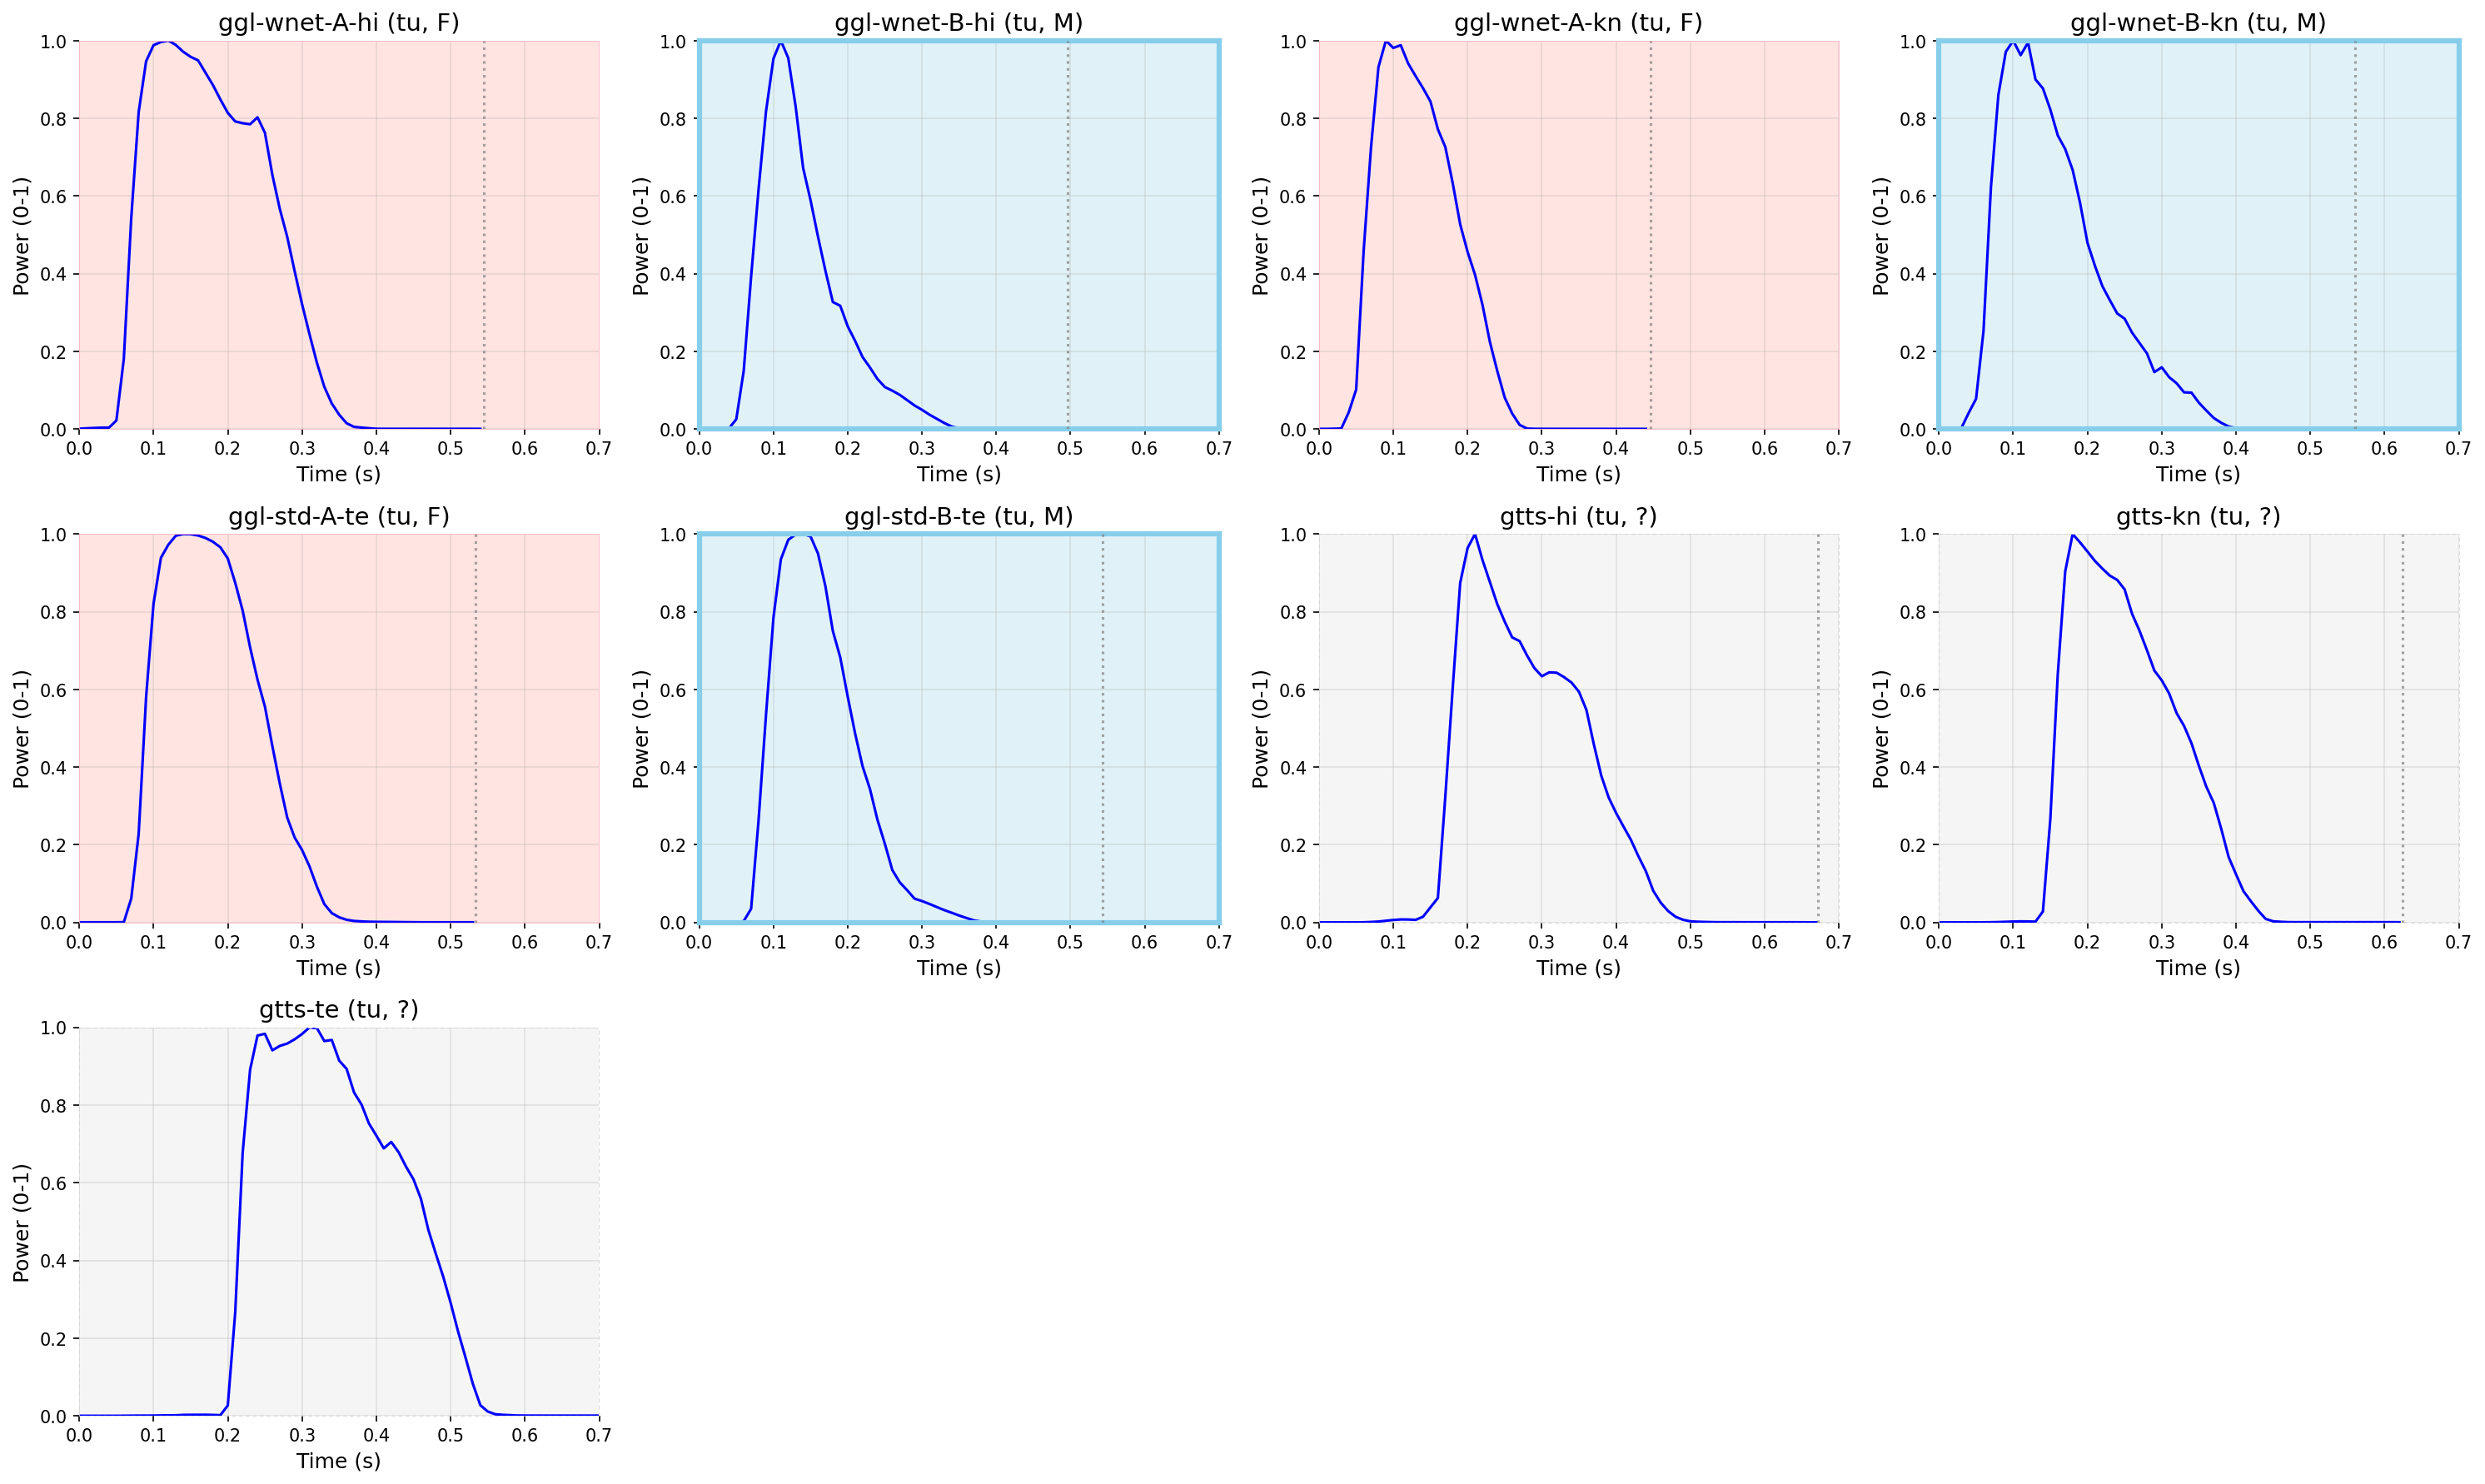
▼ Power vs Time
Definition: Sound intensity (RMS amplitude) normalized to 0-1.
Shows the loudness of the sound over time. Higher values indicate louder portions of the speech.
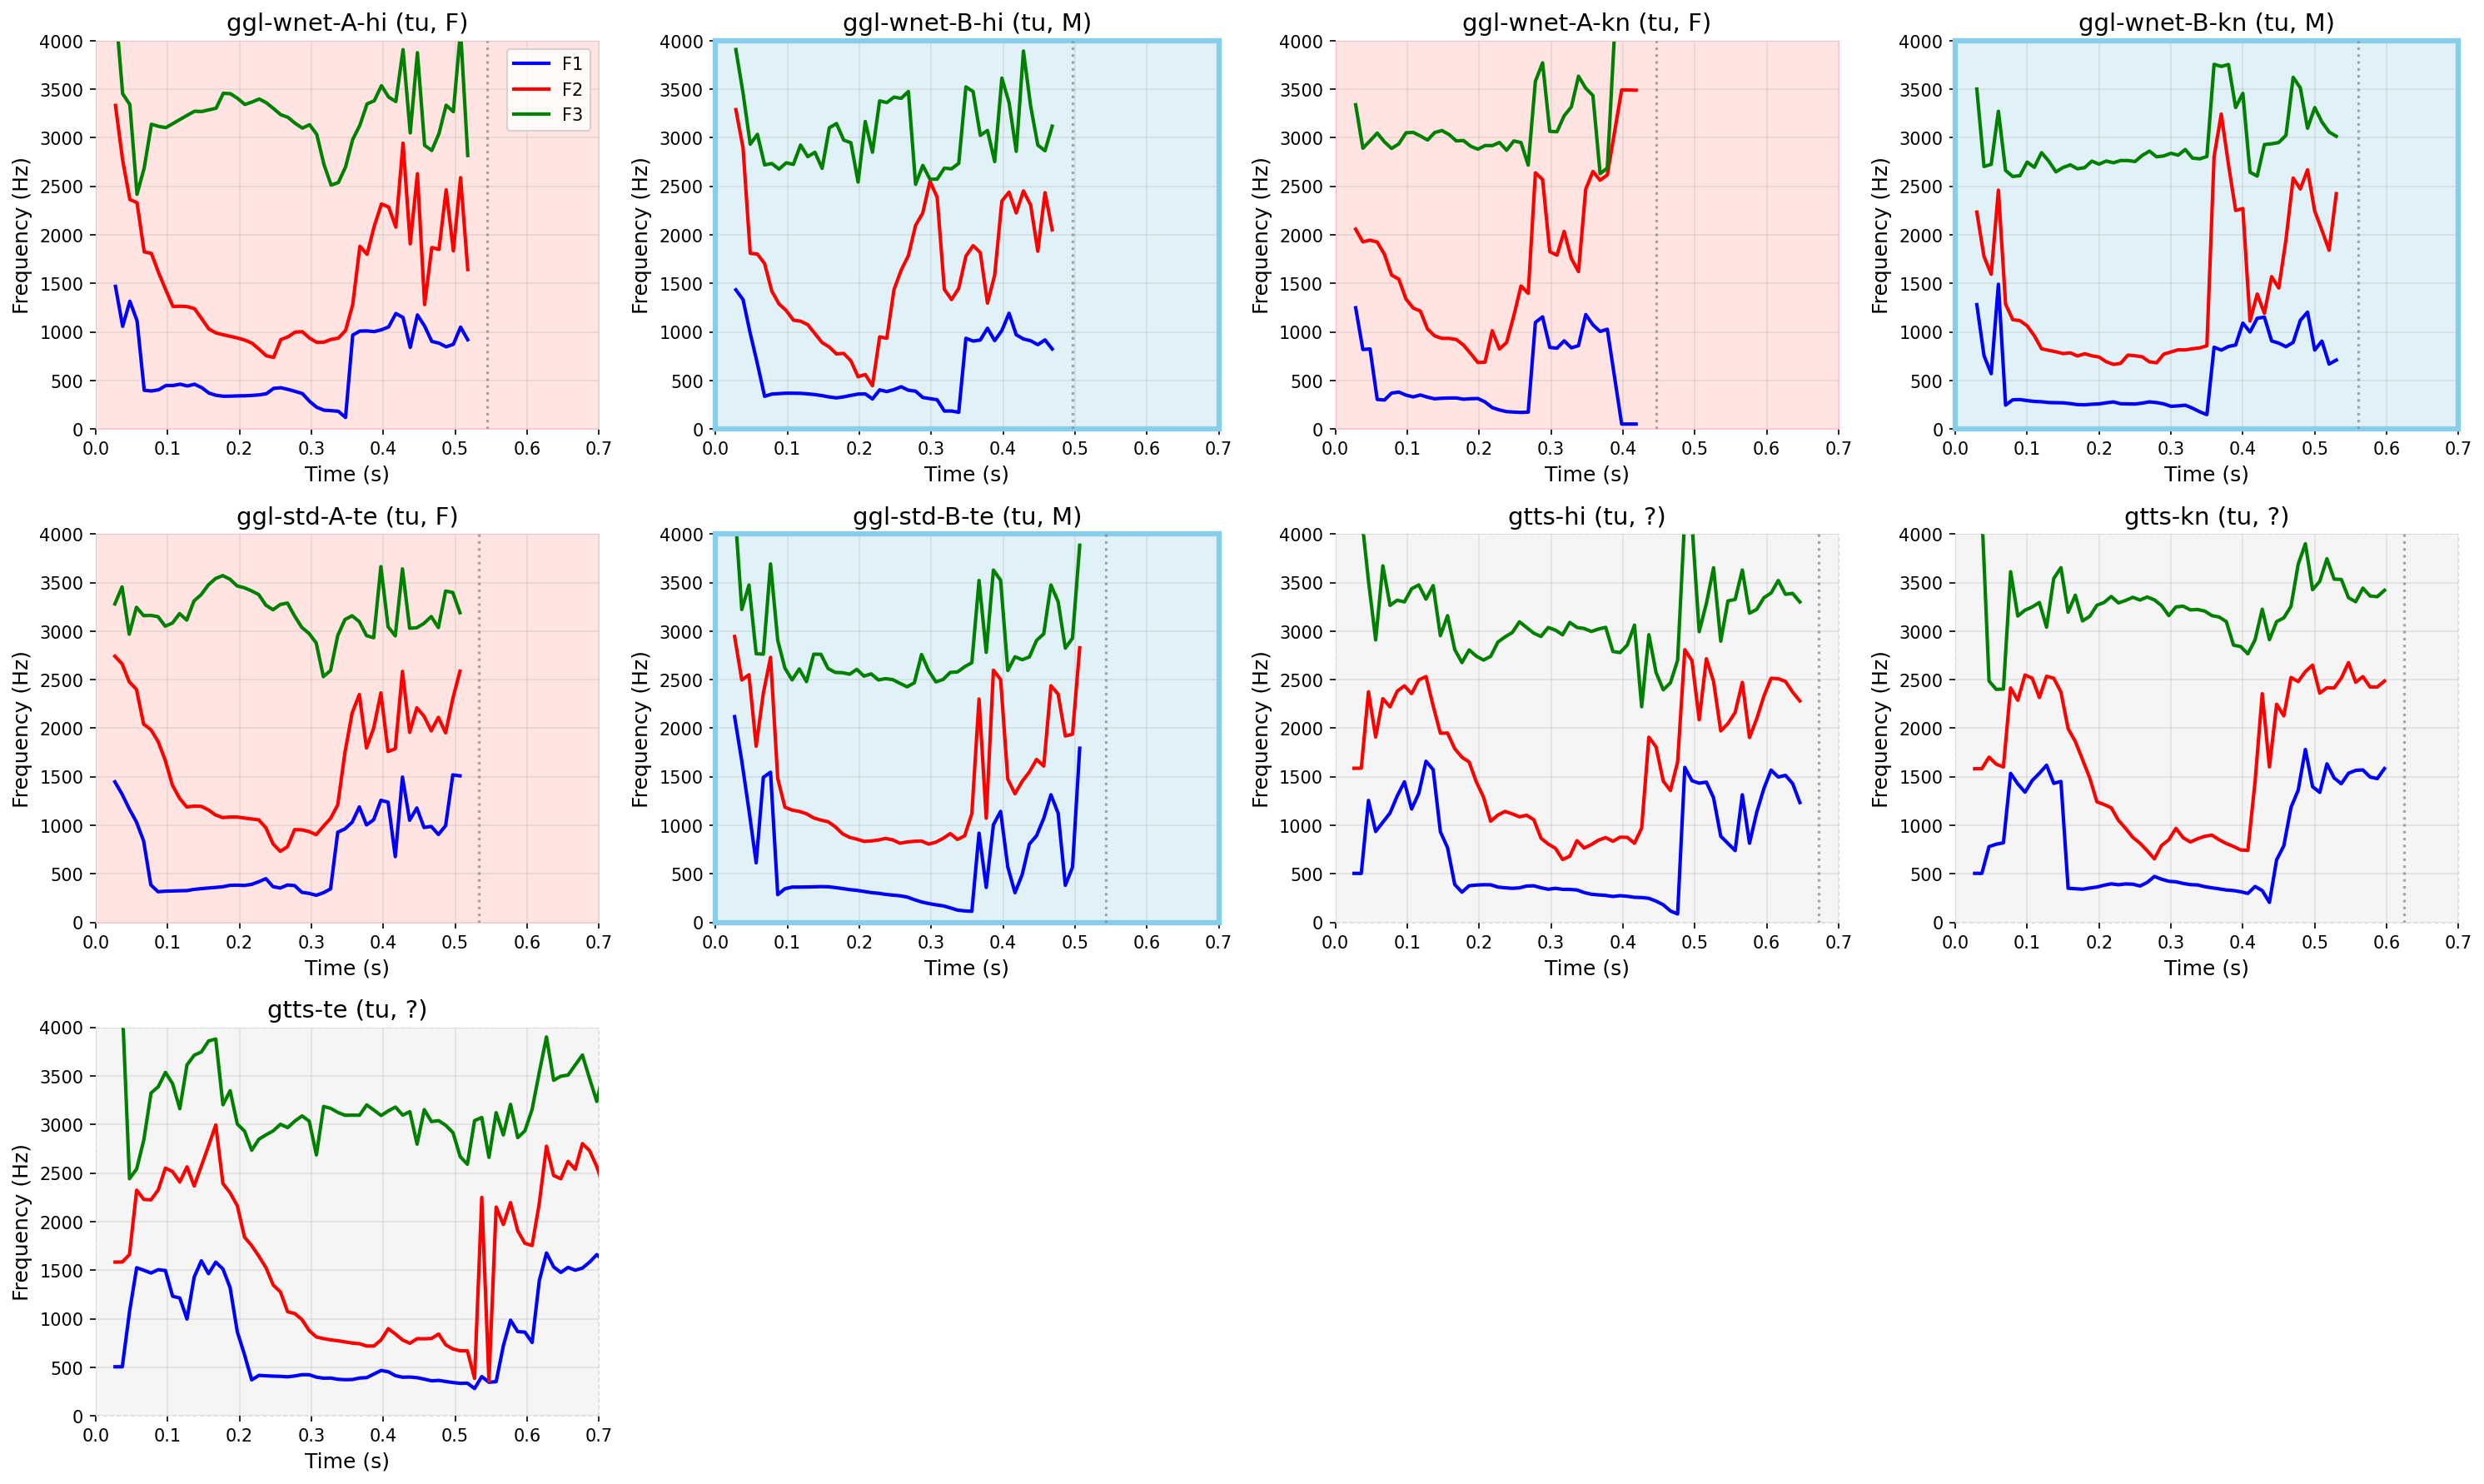
▼ Formants vs Time
Definition: Vocal tract resonances in Hertz.
F1 (lowest) relates to tongue height, F2 to tongue position (front/back), F3 to lip rounding.
Different vowels have characteristic F1/F2 patterns that distinguish them acoustically.
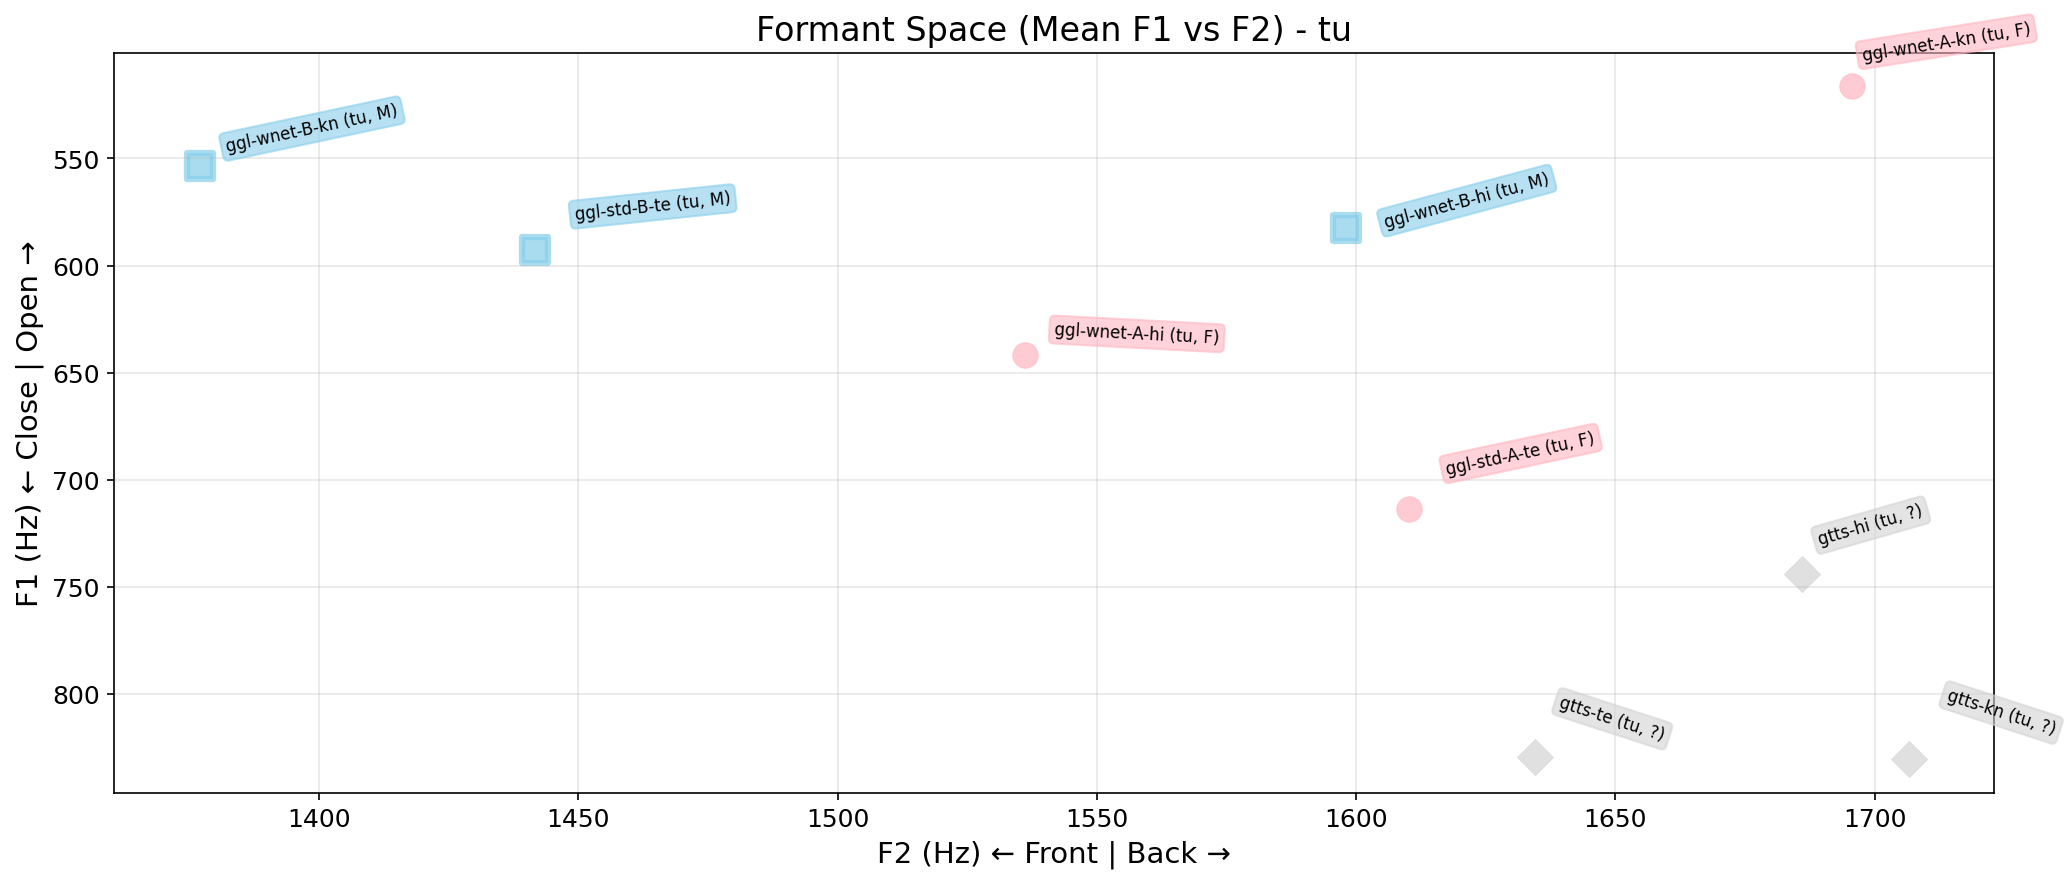
▼ Formant Space (F1 vs F2)
Definition: Traditional vowel space visualization.
X-axis (F2): front vowels (high F2) ← → back vowels (low F2).
Y-axis (F1): close vowels (low F1) ← → open vowels (high F1), inverted for traditional display.
Points closer together indicate similar vowel quality.
▶ Interactive Formant Space (Click to Play Audio)
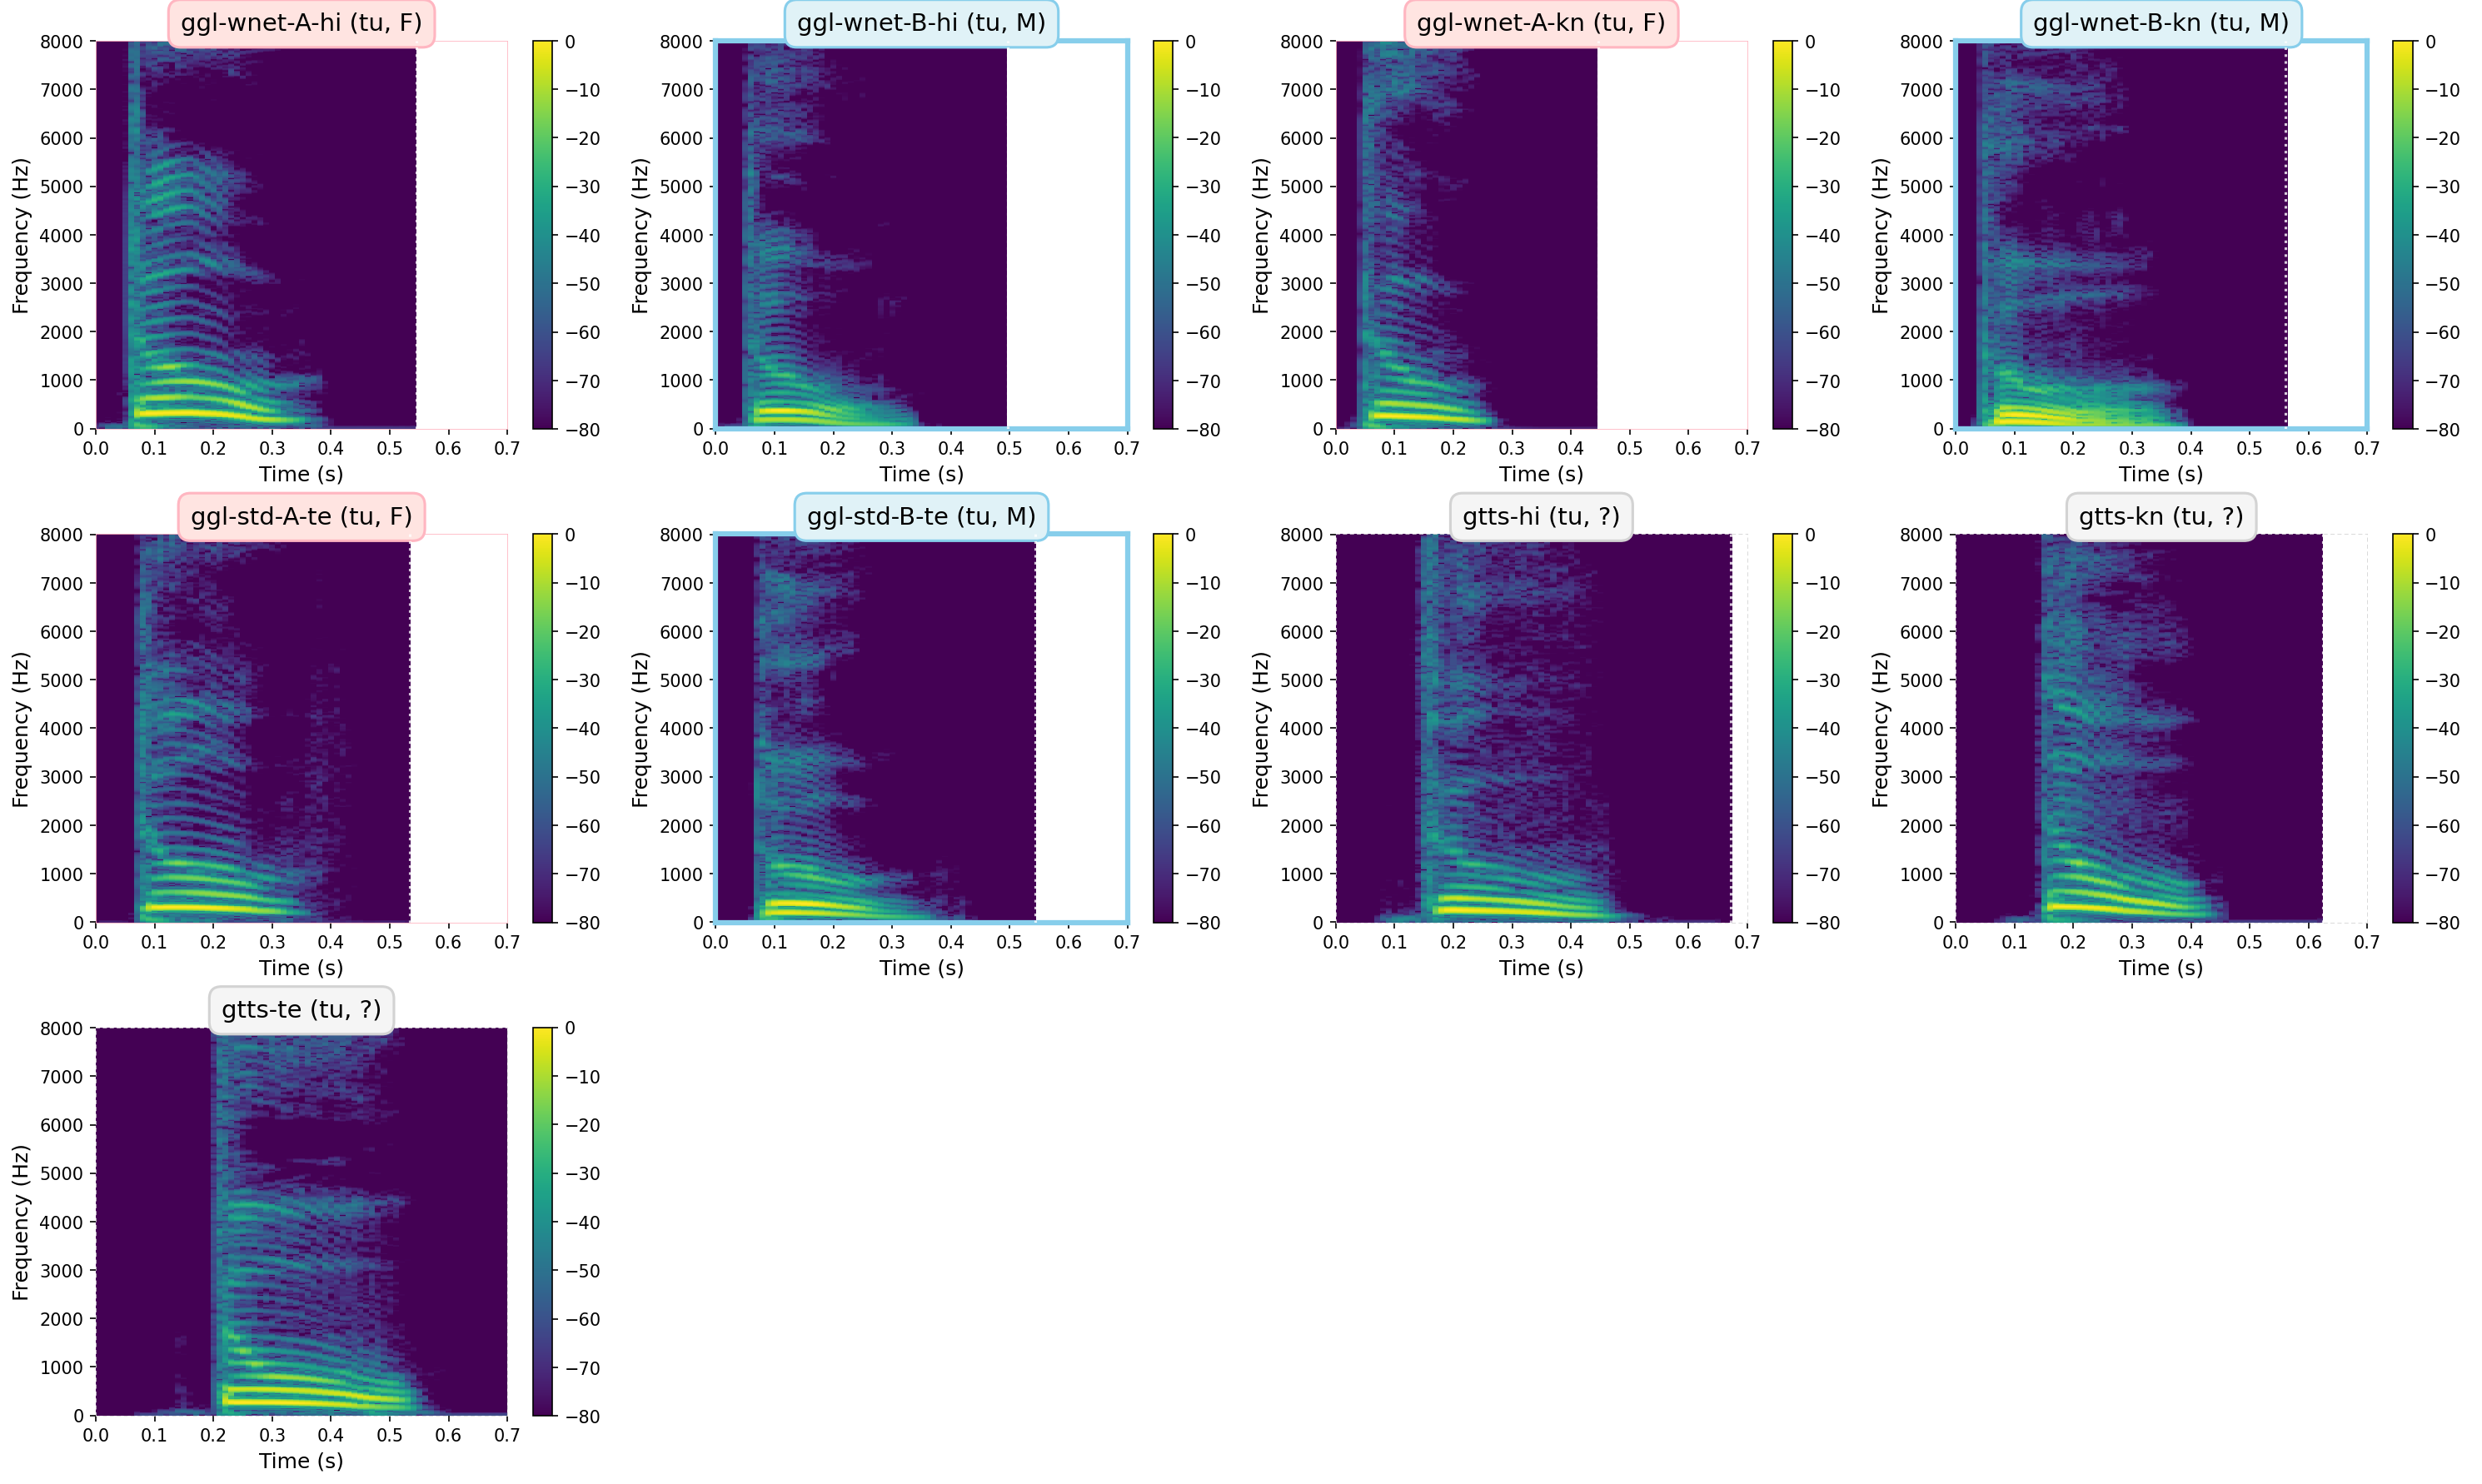
▼ Spectrograms
Definition: Time-frequency representation showing energy distribution across frequencies.
The spectrogram displays which frequencies are present in the sound at each moment in time.
Brighter colors indicate higher energy at that frequency.
▼ Findings & Statistics: tu
Acoustic Summary for tu (Overall)
Overall Statistics (n=9 files)
F1 (Formant 1)
Mean ± SD: 683 ± 459 Hz
F2 (Formant 2)
Mean ± SD: 1591 ± 710 Hz
F3 (Formant 3)
Mean ± SD: 3123 ± 418 Hz
Pitch (across all frames)
Range: 75 - 326 Hz
Mean ± SD: 206 ± 70 Hz
Duration
Range: 0.446 - 0.744 s
Mean ± SD: 0.574 ± 0.086 s
By Gender:
Female (n=3)
F1: 624 ± 82 Hz
F2: 1614 ± 65 Hz
F3: 3220 ± 22 Hz
Pitch: 255 ± 23 Hz
Male (n=3)
F1: 576 ± 17 Hz
F2: 1472 ± 93 Hz
F3: 2935 ± 78 Hz
Pitch: 134 ± 23 Hz
Unknown (n=3)
F1: 801 ± 40 Hz
F2: 1676 ± 30 Hz
F3: 3201 ± 55 Hz
Pitch: 224 ± 17 Hz
▼ Observations: tu
Automated Analysis for tu
Programmatically inferred patterns from the acoustic data
Consistency & Variance
Within-group homogeneity and overall variance patterns
• F1 shows substantial variance (CV=0.67), suggesting heterogeneous voice characteristics or synthesis inconsistencies.
• Male voices (n=3) show very tight F1 consistency (CV=0.03), suggesting systematic pronunciation.
• Unknown voices (n=3) show very tight F1 consistency (CV=0.05), suggesting systematic pronunciation.
Gender Differences
Acoustic differences between male and female voices
• F1 gender difference is large (48 Hz / 7.9%, d=0.81), consistent with natural speech patterns.
• F2 gender difference is large (142 Hz / 9.2%, d=1.77).
Phonetic Analysis
Formant validation against expected vowel properties
• Formant analysis: F1=683 Hz (mid), F2=1591 Hz (front-central).
Duration Patterns
Temporal characteristics and uniformity
• Duration variance is moderate (CV=0.15, range 0.446-0.744s).
TTS Quality
Synthesis consistency and prosodic control
• gtts shows lower F1 variance than ggl, suggesting more consistent synthesis quality.
• ggl shows high pitch variance (σ=65 Hz), which may indicate natural-sounding variation or control instability.
• gtts shows excellent pitch stability (σ=17 Hz), indicating superior prosodic control.
Cross-Script Comparison
Acoustic similarity across different scripts
• Kannada and Hindi pronunciations cluster together (distance=27 Hz in F1-F2 space), showing consistent articulation across scripts.
Guide for Interpretation
- Coefficient of Variation (CV): Ratio of standard deviation to mean. CV < 0.1 indicates tight clustering, CV > 0.2 indicates high variance.
- Cohen's d: Standardized effect size (difference ÷ pooled SD). Measures how many standard deviations apart two groups are. d < 0.2 is negligible, 0.2-0.5 is small, 0.5-0.8 is medium, d > 0.8 is large.
- Relative differences: Reported as "absolute Hz / percentage of mean" to show both raw and scaled differences (e.g., 48 Hz / 8.5% means 48 Hz is 8.5% of the average F1 value).
- Formant validation: Expected ranges based on IPA vowel space: close vowels (F1 < 400 Hz), front vowels (F2 > 2000 Hz), back vowels (F2 < 1000 Hz).
- Natural speech baselines: Gender differences typically show F1 ~100 Hz, F2 ~150 Hz; TTS may deviate from these.
- TTS quality indicators: Pitch stability (σ < 25 Hz = excellent), formant consistency (lower variance = better control).