ℹ How to read these plots
- Voice
- Google Cloud TTS, Kannada Wavenet-B (male, F0 ~100 Hz). Single voice throughout — removes inter-speaker variability.
- Reference vowels
- अ, इ, उ from the swara corpus — pure vowels, no consonant onset. F0 starts from the first voiced frame.
- CV syllables
- Each consonant in three vowel contexts (ka/ki/ku etc.). Stop consonant = closure + burst (unvoiced) followed by the vowel. F0 is undefined during the burst.
- Navigating panels
- Each section has a header bar. 👁 button = show/hide the panel body. ⠿ handle (left of 👁) = drag to reorder sections within the tab. Reorder is per-tab and resets on page reload.
- ① Local pitch
lp(top section — Prof's view) - Praat autocorrelation pitch at 5ms time step, 75–500 Hz range. No burst shading, no fills — continuous line where voice is detected, gap where unvoiced. Y-axis auto-scaled to the actual pitch range in the recording (removes empty whitespace). This matches the "local pitch" view in Praat's pitch editor. Left column = pure vowels (अ/इ/उ); right = CV syllables. Compare vowel vs CV pitch contours directly.
- ② Local pitch histogram
lph·lpH - Distribution of local pitch values (5ms hop, 75–500Hz). lph = raw bars (default) — unsmoothed bin counts, honest. lpH = alpha bars + KDE smooth line — readable peaks (● primary, ■ secondary). Wider X-axis than Pitch/F0 histogram (to 500Hz) may reveal F1 bleed for /i/ /u/. Compare with f0h/f0H below (10ms hop, 75–300Hz).
- ③ Waveform
wv - Full-utterance amplitude envelope. Shows overall duration and energy structure. Click image to enlarge.
- ④ Waveform zoom
wz(onset) - First 150ms. Three rows: vowel (gray bg), burst region (green bg — consonant closure+release), CV vowel onset (light-cyan bg). Green row isolates the burst: the silent gap before voicing begins. Duration of this gap ≈ burst duration — a place-of-articulation signature.
- ⑤ Burst spectrum
bs - FFT of burst noise (speech onset → first voiced frame). Spectral COG (red dashed) = place signature. Labials flat; velars mid-peak (~1–2 kHz); dentals high (>3 kHz).
- ⑥ Pitch/F0 time history
f0 - Praat pitch at 10ms frames. Red-shaded gap at CV onset = burst (no voicing → no pitch). Flat region after = steady vowel pitch. Solid = pure vowel · dashed = CV.
- ⑦ Pitch/F0 histogram
f0h·f0H - Distribution of voiced pitch frames. f0h = raw bars (default). f0H = bars + KDE smooth. ● primary peak · ■ secondary peak · thin verticals = means.
- ⑧ IF histogram
ifh·ifH - Distribution of Hilbert-transform instantaneous frequency (75–300 Hz band). ifh = raw bars (default). ifH = bars + KDE. For /a/ agrees with F0; for /i/ /u/ F1 may dominate (red shading above 250 Hz = risk zone).
- ⑨ Harmonic spectrum
hs - 50ms window in the steady vowel region. Shows harmonic comb H1–H14 at multiples of F0. Gaussian-smoothed envelope overlaid. Harmonic spacing = F0; relative amplitudes reflect voice quality and vowel formants.
- ⑩ Formant time series
f2 - F1, F2, F3 by Praat Burg method (25ms window, 10ms hop, 5000 Hz ceiling). F2 = primary place-of-articulation marker. ◆ = F2 locus (value at voicing onset — the consonant's spectral target). F1, F3 shown faint for context.
- ⑪ F2 histogram
f2h·f2H - Distribution of F2 values. f2h = raw bars (default). f2H = bars + KDE. Solid = vowel · dashed = CV. Thin verticals = F2 locus. Narrow = stable formant; wide = transition.
- F2 locus & consonant extraction
- The abstract consonant (क्, च्, etc.) is constant across vowel contexts. F2 at voicing onset (locus) converges across ka/ki/ku → that converged value is the consonant's place signature. F2 steady-state diverges by vowel (/a/~1200 Hz, /i/~2200 Hz, /u/~800 Hz) — that is the vowel, not the consonant.
- Burst duration chart
- Cross-consonant: burst = speech onset → first Praat-voiced frame. ca (palatal affricate) is longest; retroflex ṭa shortest among stops.
- ★ Summary tab
- Cross-consonant heatmap + scatter plots. Color intensity per column: green = acoustically distinct value, white = mid-range. F2 stability and ΔF0 are inverted (lower = more distinct = deeper green). Validation panel at bottom compares our pipeline output against Prof's Praat screenshot on the same audio.
- Note on TTS prosody
- Wavenet TTS produces natural falling intonation (~55 Hz range per utterance), not a flat pitch. Pitch and formant patterns are valid proxies for human speech for place-of-articulation and microprosodic analyses.
क ka · Velar · Kanthya ⠿ drag sections to reorder · 👁 toggle visibility
| TTS — Wavenet-B | |||
|---|---|---|---|
| Vowel | a | i | u |
| CV | ka | ki | ku |
| Human — take 1 | |||
|---|---|---|---|
| Vowel | a | i | u |
| CV | ka/a | ka/i | ka/u |
| Human — take 2 | |||
|---|---|---|---|
| Vowel | a | i | u |
| CV | ka/a | ka/i | ka/u |
| Human — take 3 | |||
|---|---|---|---|
| Vowel | a | i | u |
| CV | ka/a | ka/i | ka/u |
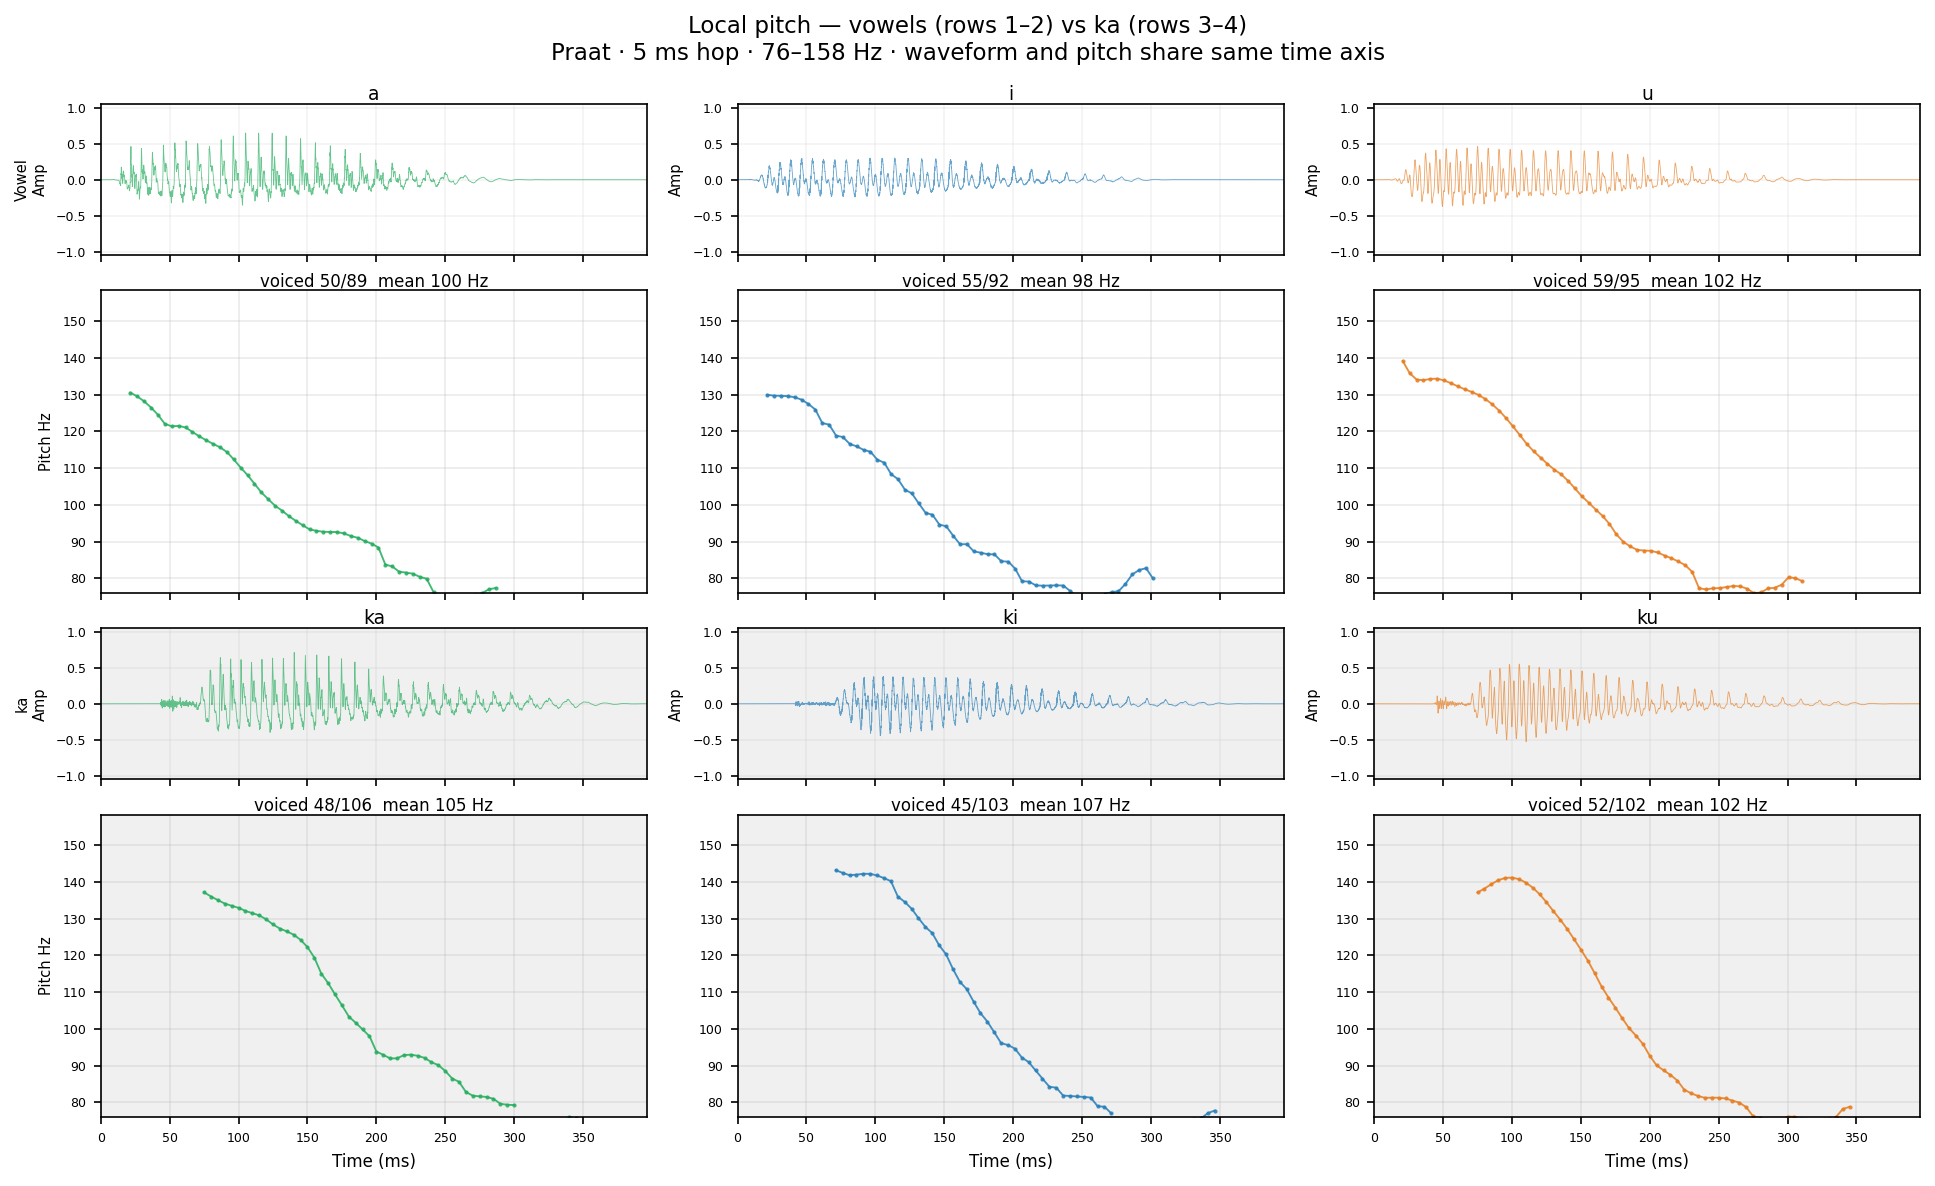
Local pitch (Prof's view): Praat autocorrelation at 5 ms hop, 75–500 Hz range, no voiced/unvoiced separation — gaps only at true silence. Matches Praat's "local pitch plot." Finer time step shows rapid micro-variation in pitch; vowels show relatively flat regions; burst/transitions show gaps or jumps. Compare with the Pitch/IF panel below (10 ms hop, voiced-only, with IF overlay).
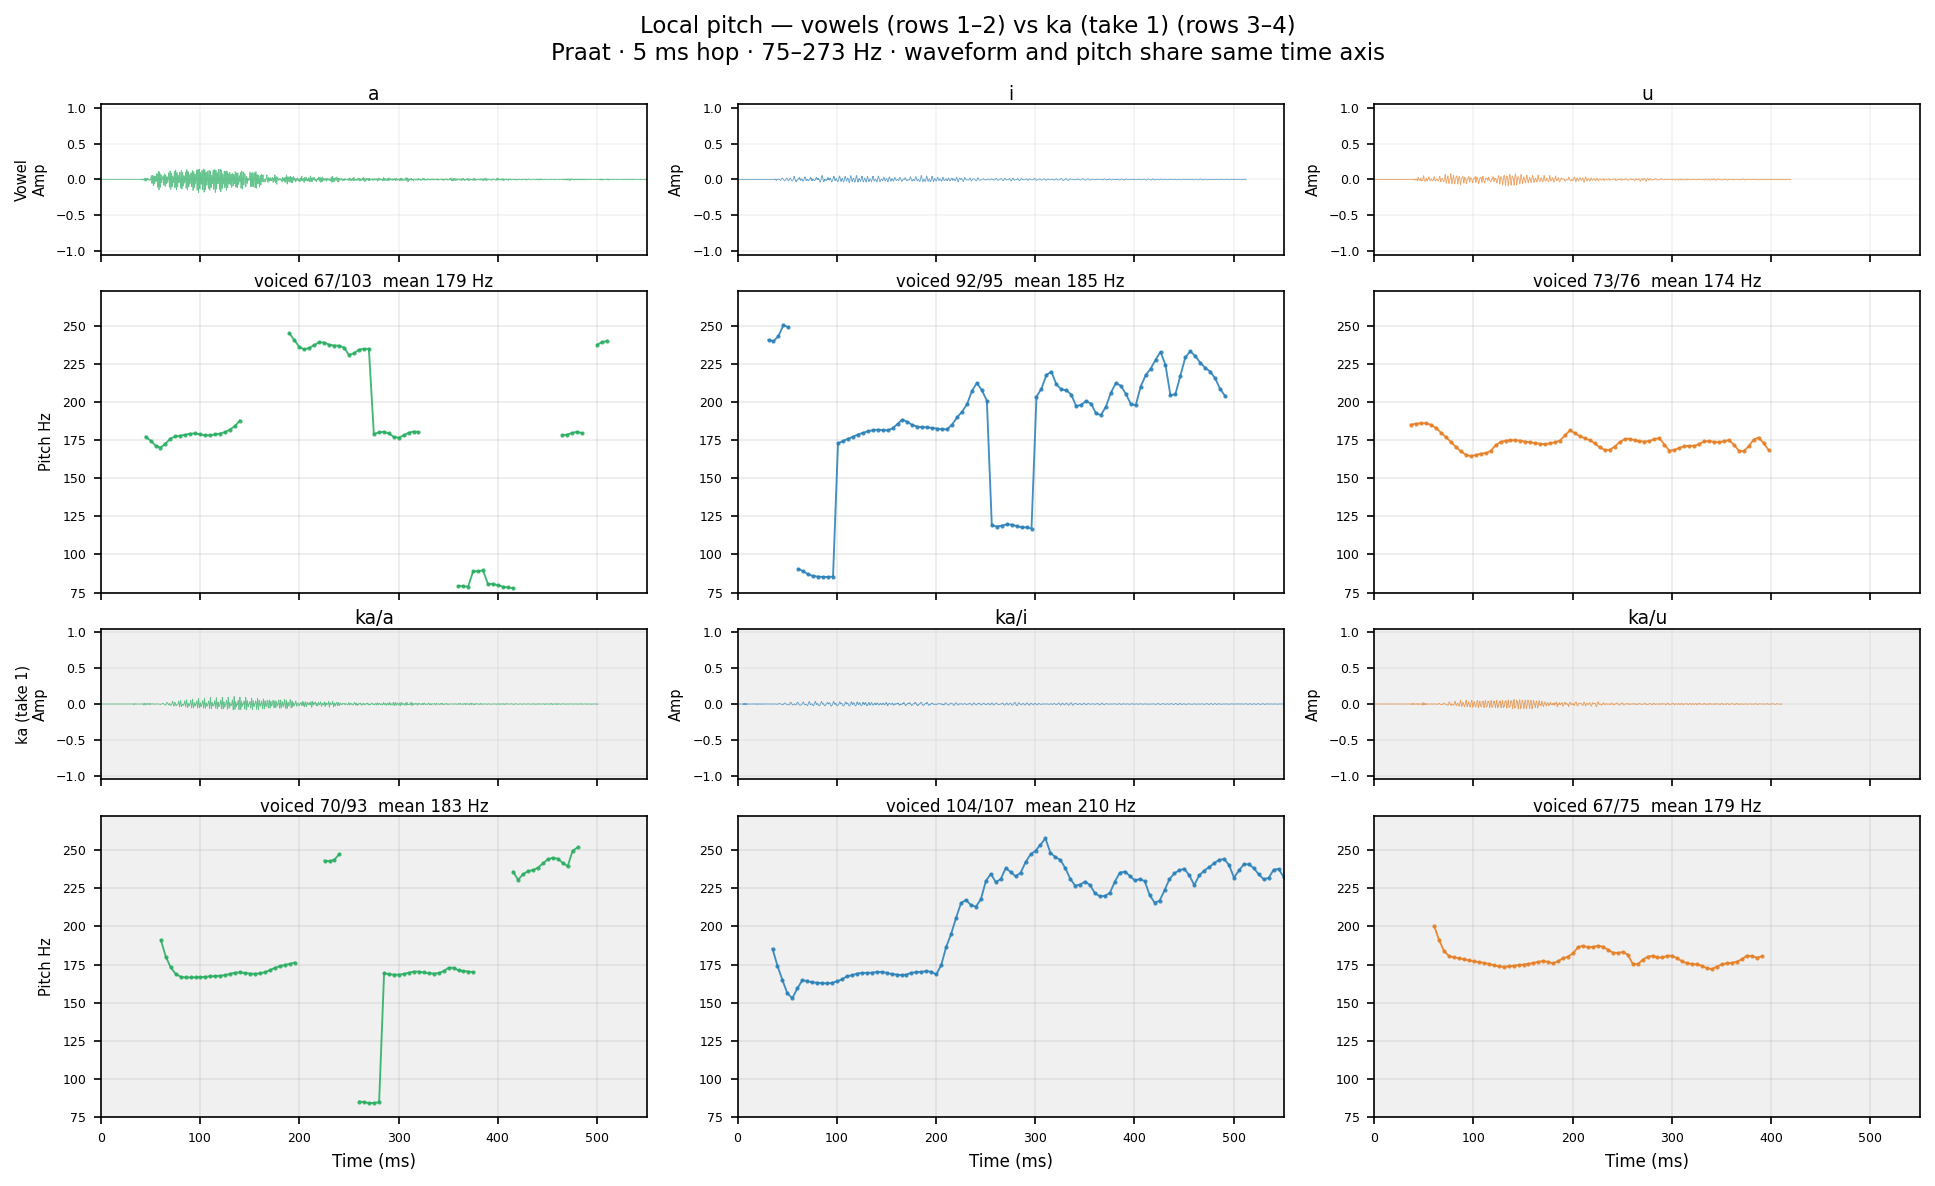
Human take 1 Same Praat settings as TTS. Compare burst gap duration and F0 onset.
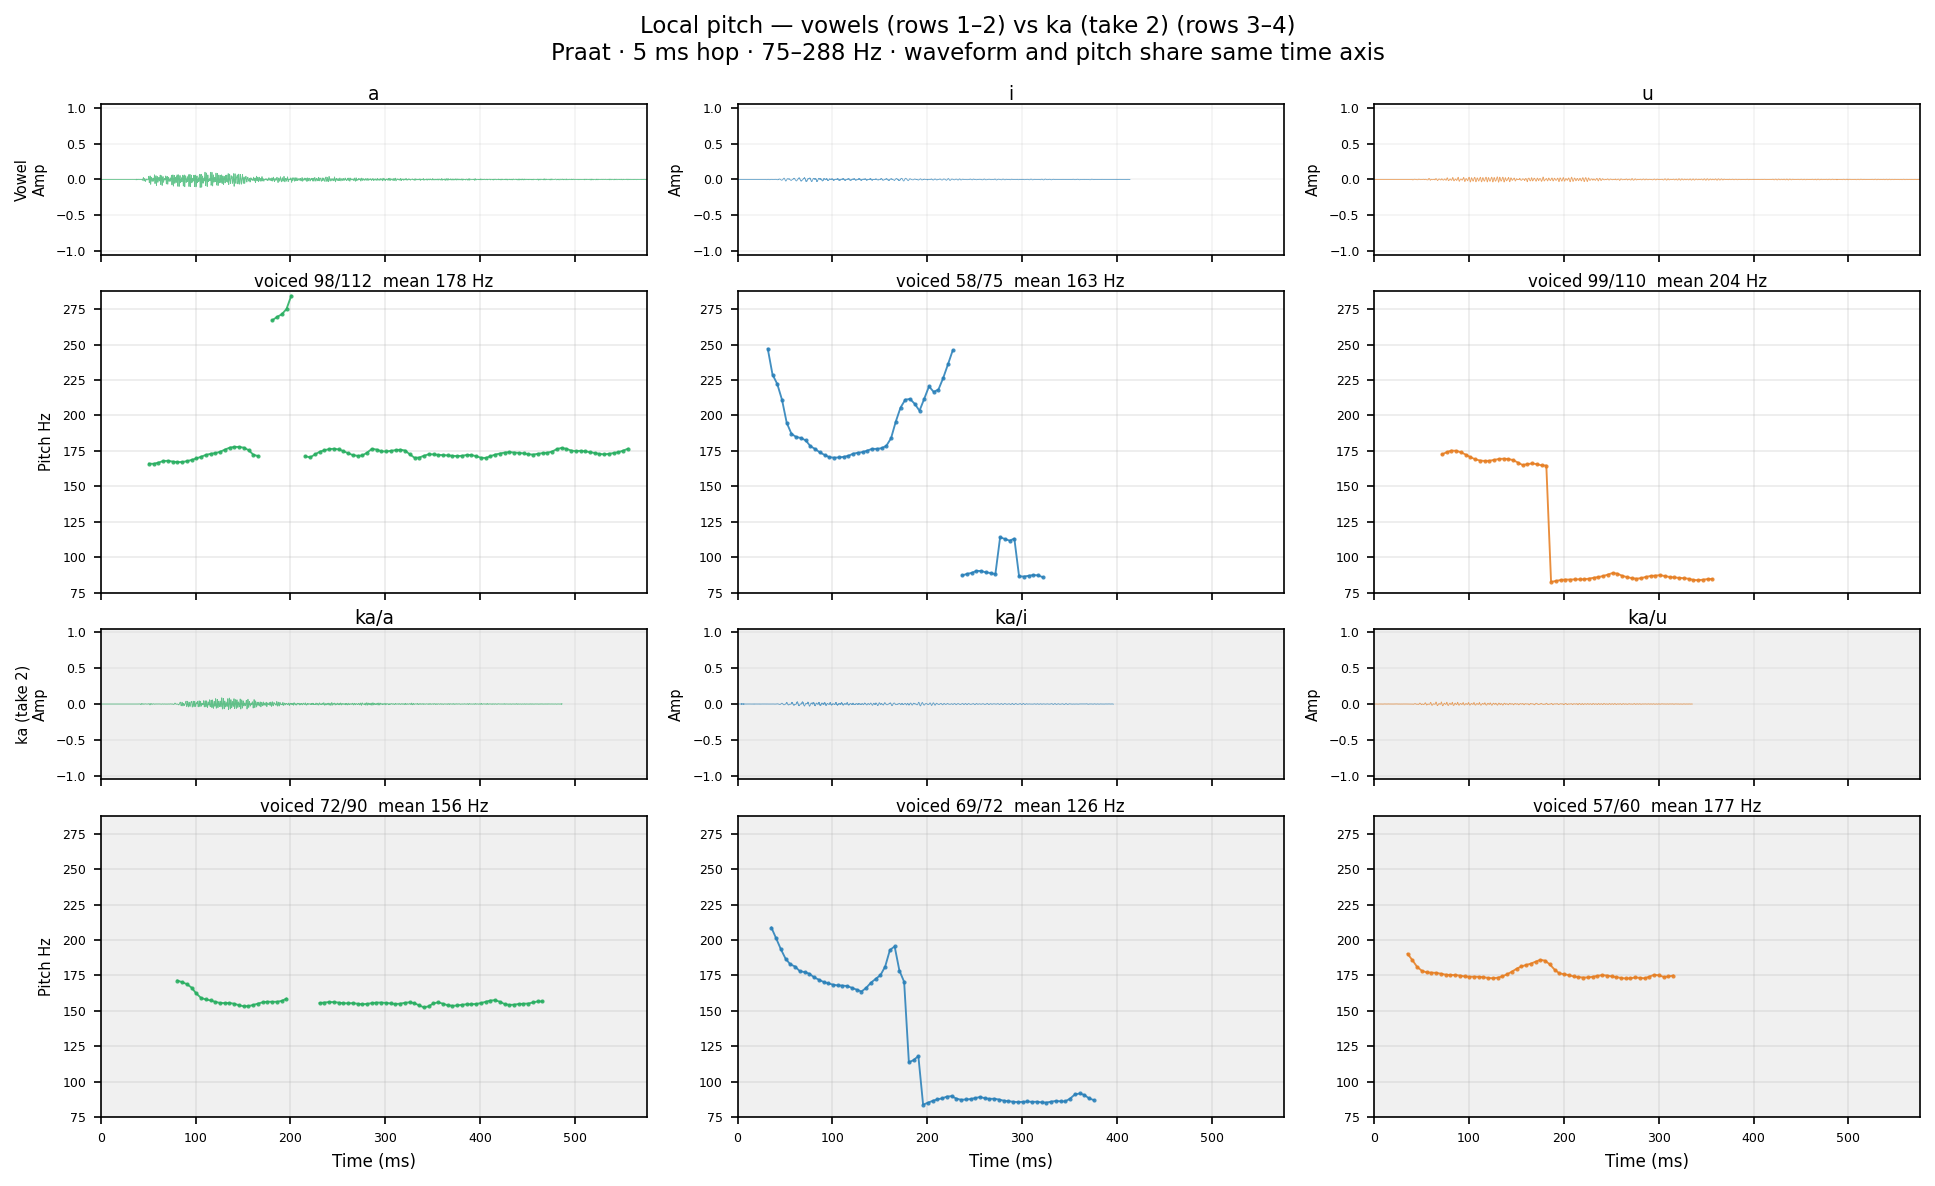
Human take 2 Same Praat settings as TTS. Compare burst gap duration and F0 onset.
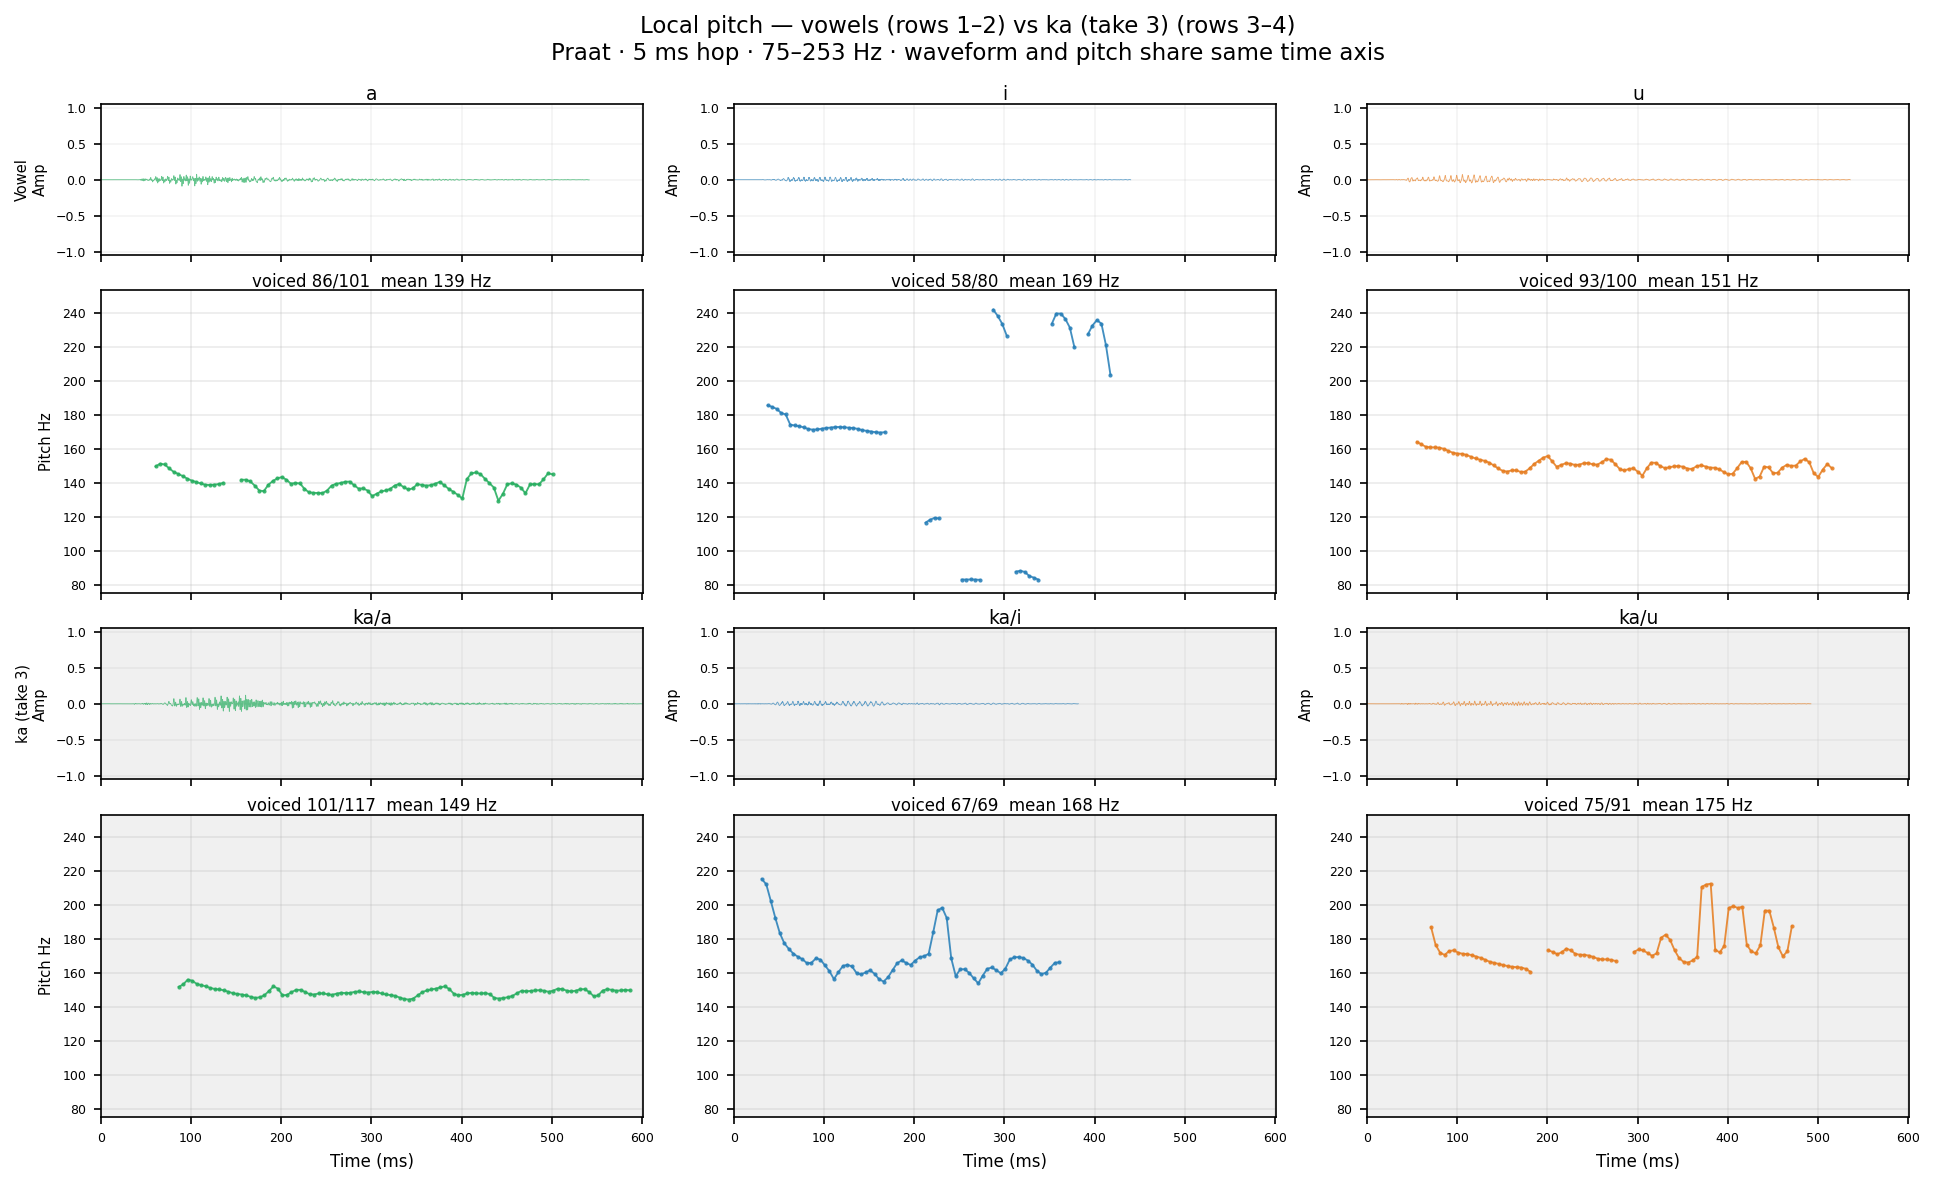
Human take 3 Same Praat settings as TTS. Compare burst gap duration and F0 onset.
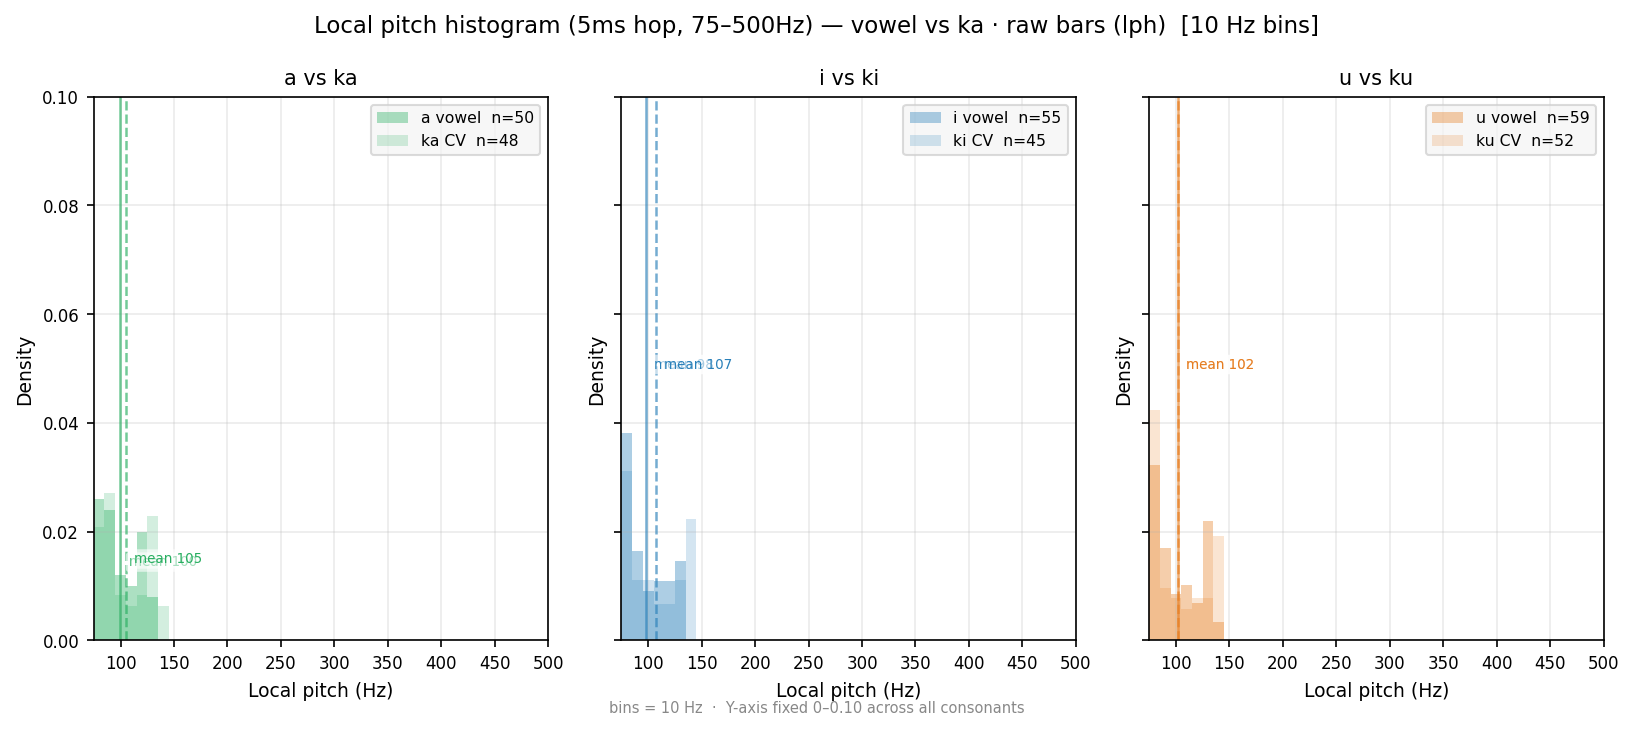
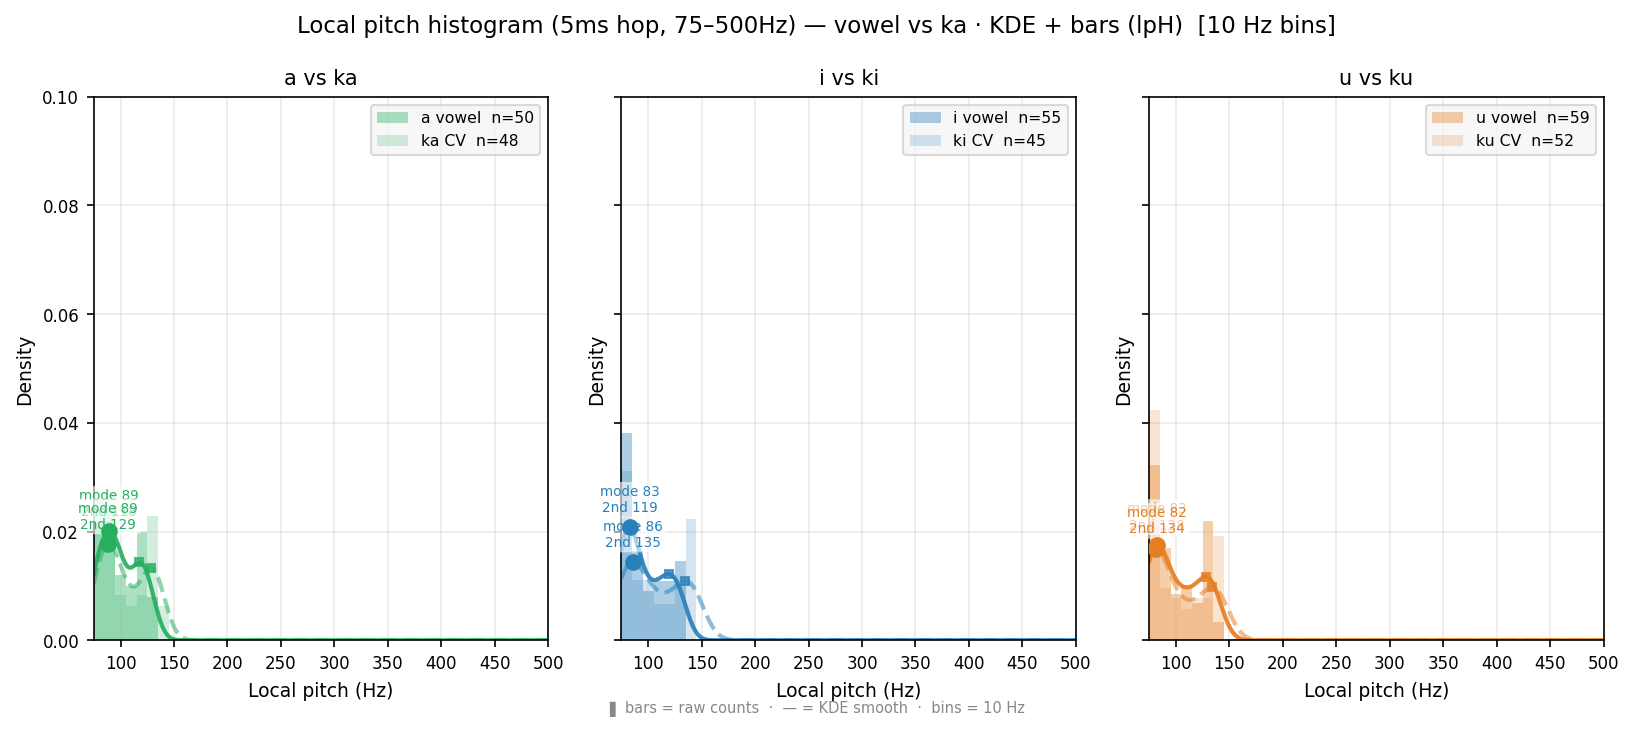
Local pitch (5ms hop, 75–500Hz) histogram — wider range than Pitch/F0 distribution (10ms, 75–300Hz). lpH = alpha bars + KDE smooth: readable peaks, secondary bump visible. lph = raw bars: unsmoothed, honest bin counts. Primary ● and secondary ■ peaks marked on KDE curve (lpH only). Wider X-axis (to 500Hz) may reveal F1 leakage for /i/ /u/ above 300Hz. Compare with Pitch/F0 distribution below for time-step and frequency-range effect.
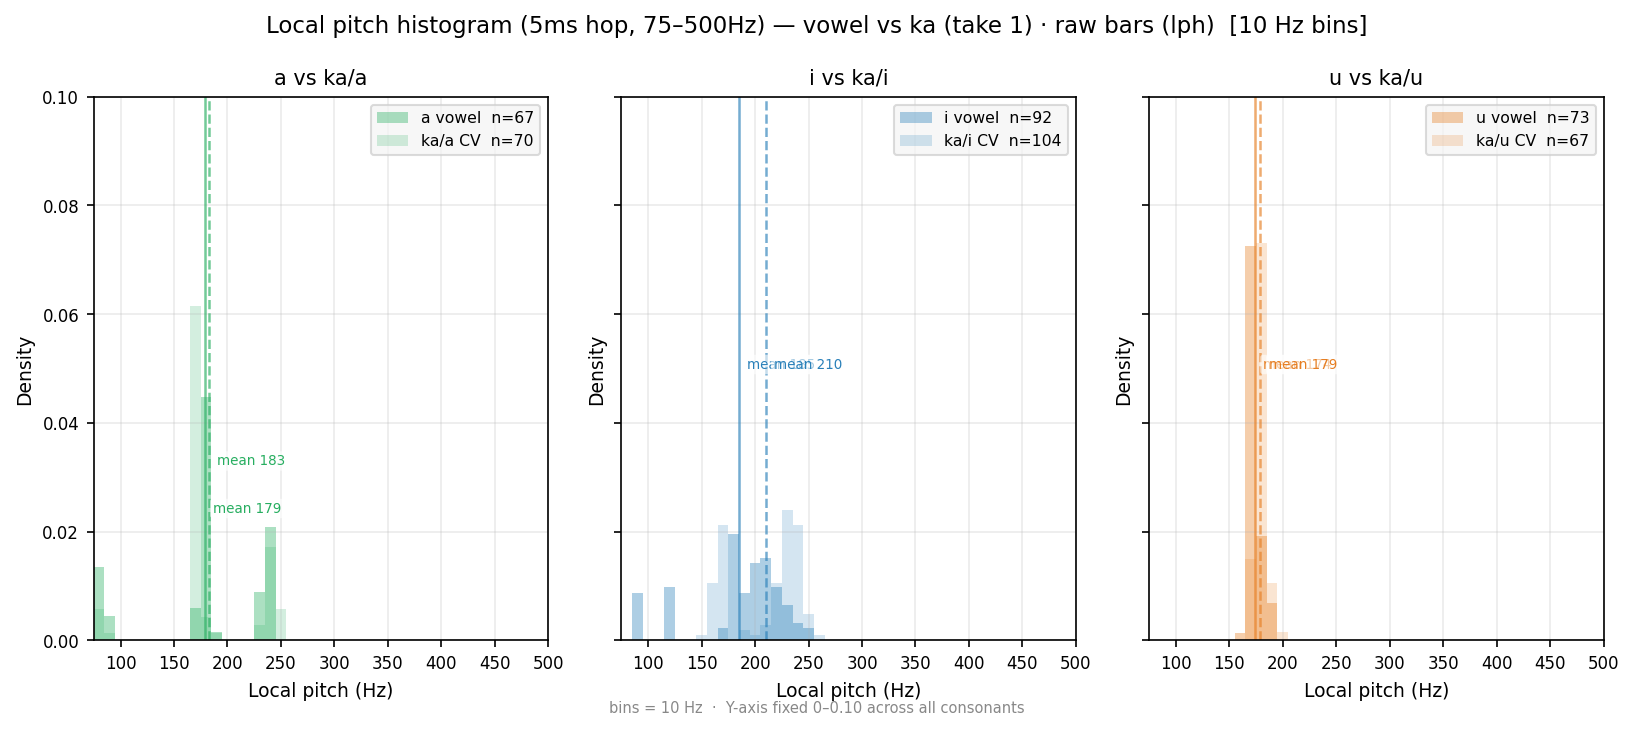
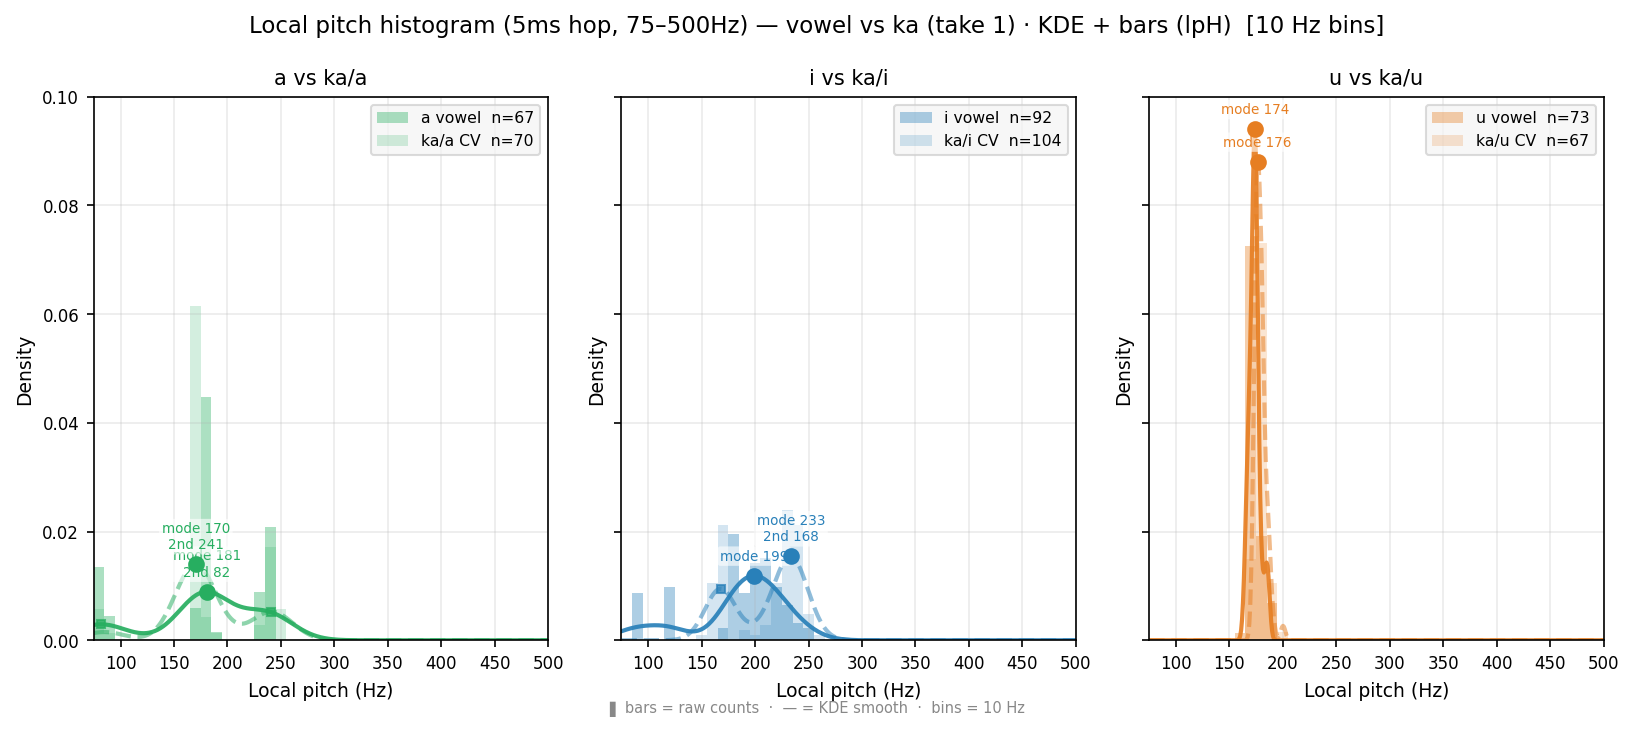
Local pitch (5ms hop, 75–500Hz) histogram — wider range than Pitch/F0 distribution (10ms, 75–300Hz). lpH = alpha bars + KDE smooth: readable peaks, secondary bump visible. lph = raw bars: unsmoothed, honest bin counts. Primary ● and secondary ■ peaks marked on KDE curve (lpH only). Wider X-axis (to 500Hz) may reveal F1 leakage for /i/ /u/ above 300Hz. Compare with Pitch/F0 distribution below for time-step and frequency-range effect.
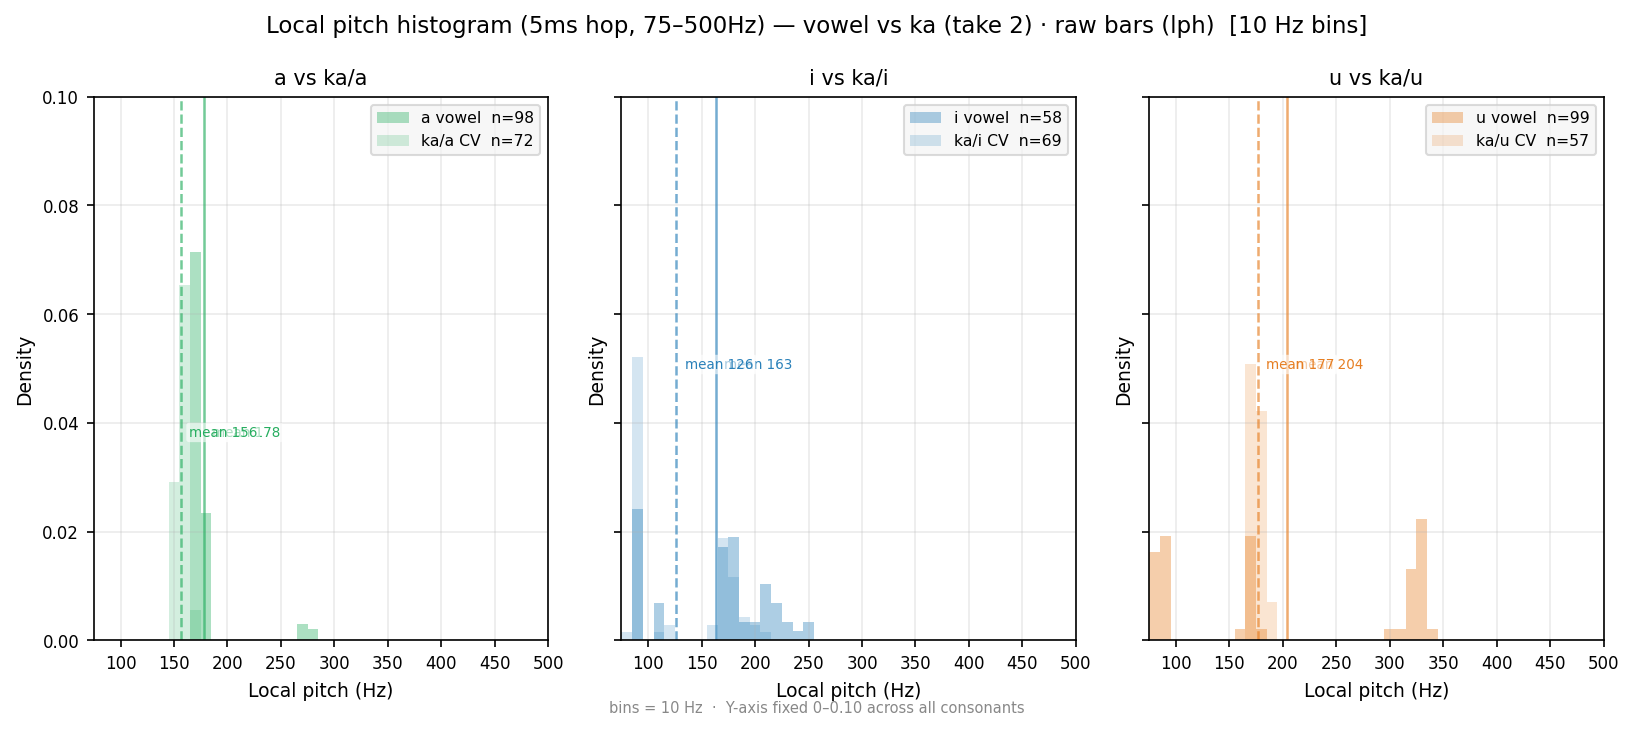
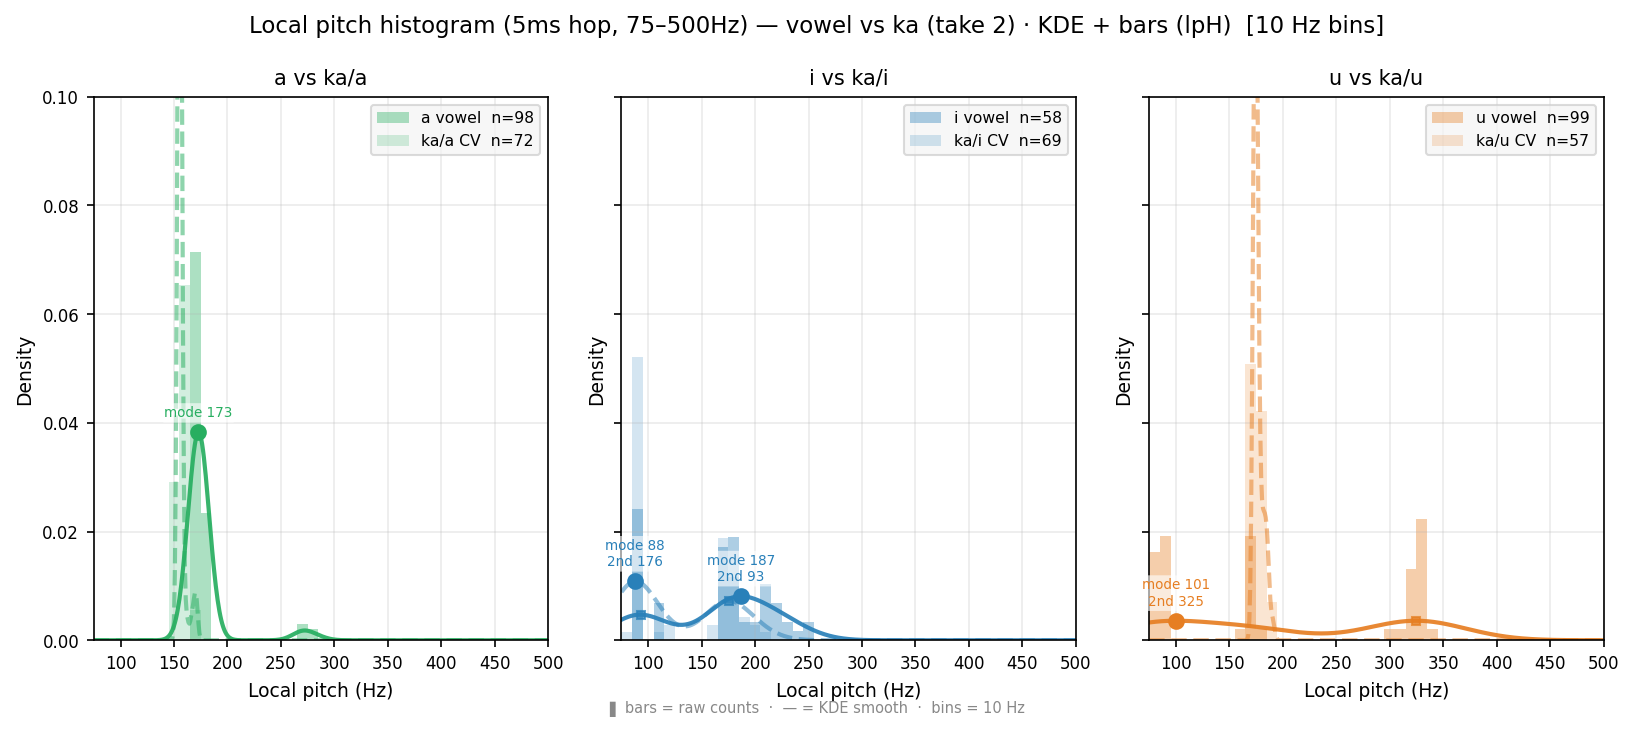
Local pitch (5ms hop, 75–500Hz) histogram — wider range than Pitch/F0 distribution (10ms, 75–300Hz). lpH = alpha bars + KDE smooth: readable peaks, secondary bump visible. lph = raw bars: unsmoothed, honest bin counts. Primary ● and secondary ■ peaks marked on KDE curve (lpH only). Wider X-axis (to 500Hz) may reveal F1 leakage for /i/ /u/ above 300Hz. Compare with Pitch/F0 distribution below for time-step and frequency-range effect.
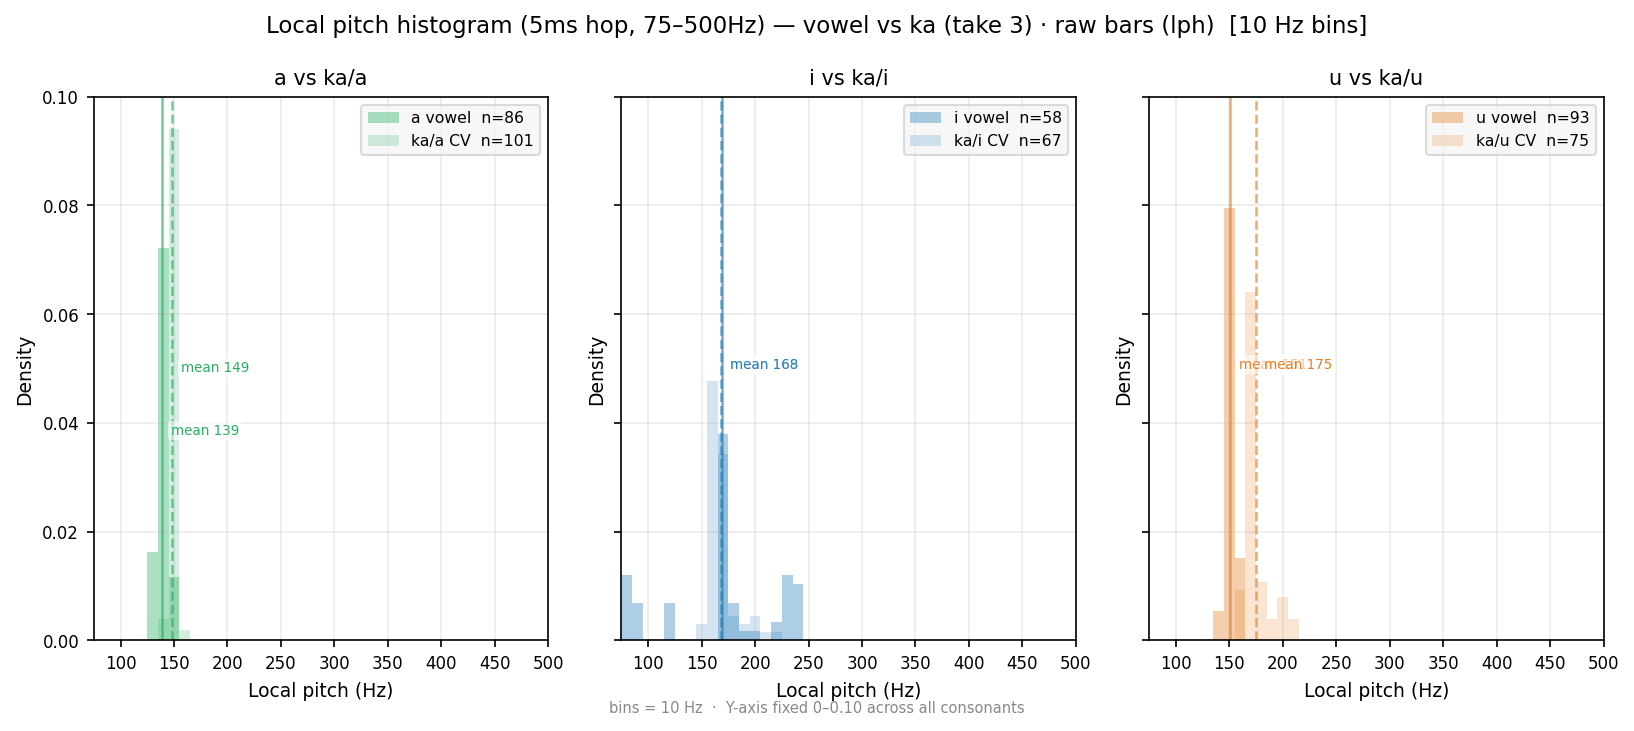
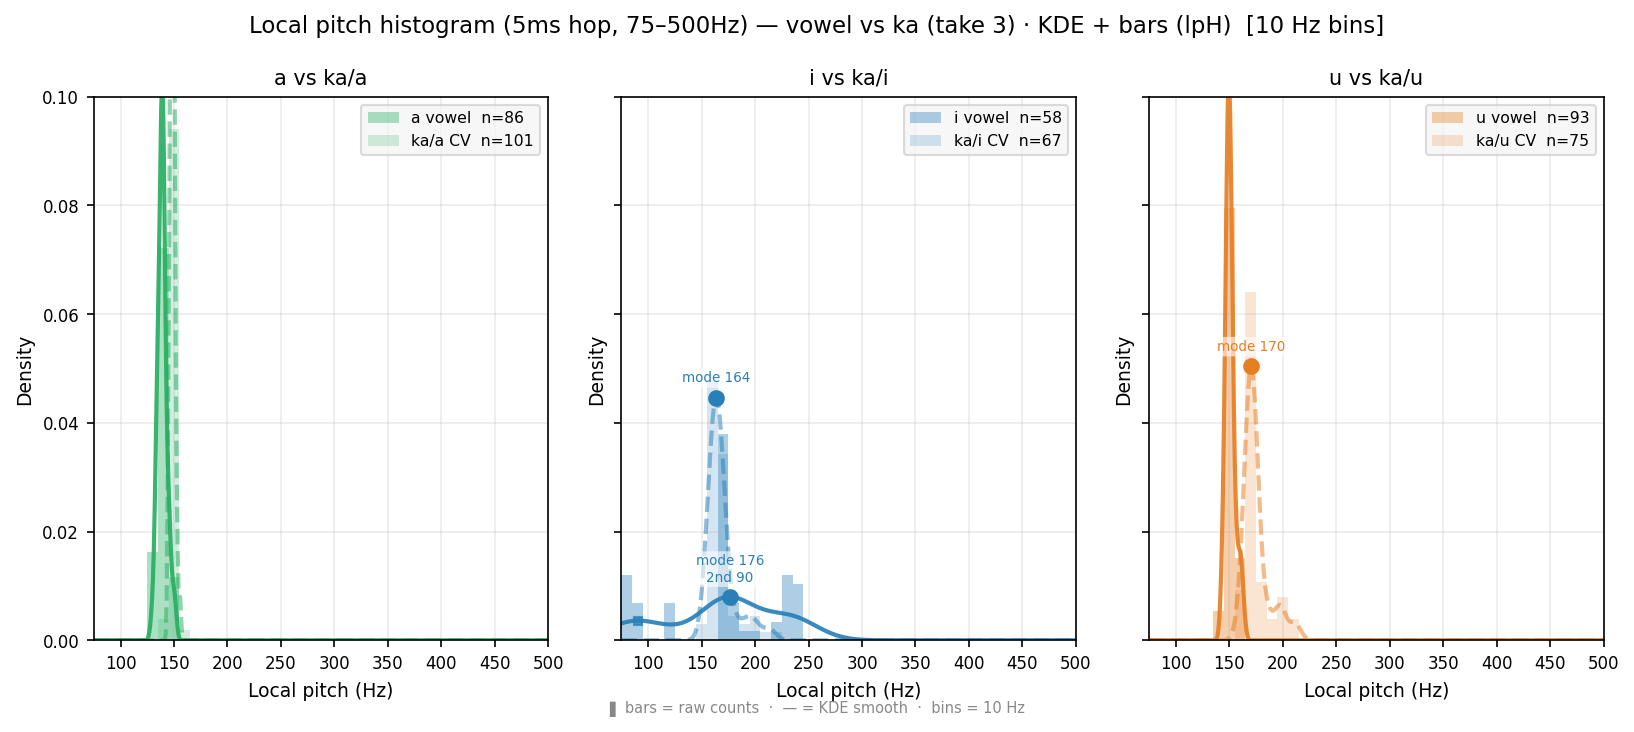
Local pitch (5ms hop, 75–500Hz) histogram — wider range than Pitch/F0 distribution (10ms, 75–300Hz). lpH = alpha bars + KDE smooth: readable peaks, secondary bump visible. lph = raw bars: unsmoothed, honest bin counts. Primary ● and secondary ■ peaks marked on KDE curve (lpH only). Wider X-axis (to 500Hz) may reveal F1 leakage for /i/ /u/ above 300Hz. Compare with Pitch/F0 distribution below for time-step and frequency-range effect.
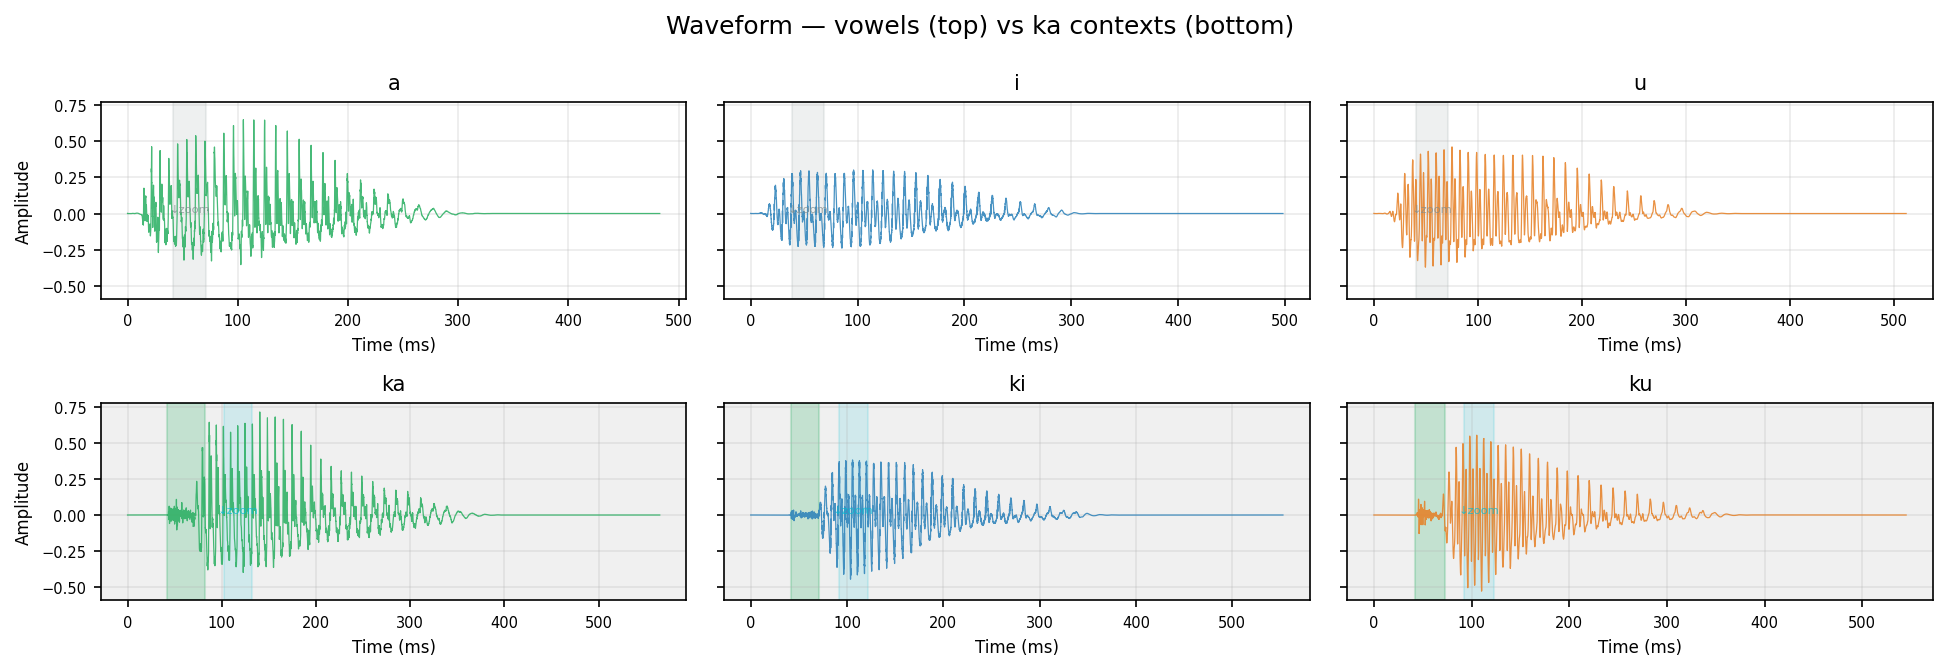
Green shading on CV waveforms = detected burst window (speech onset → first Praat-voiced frame).
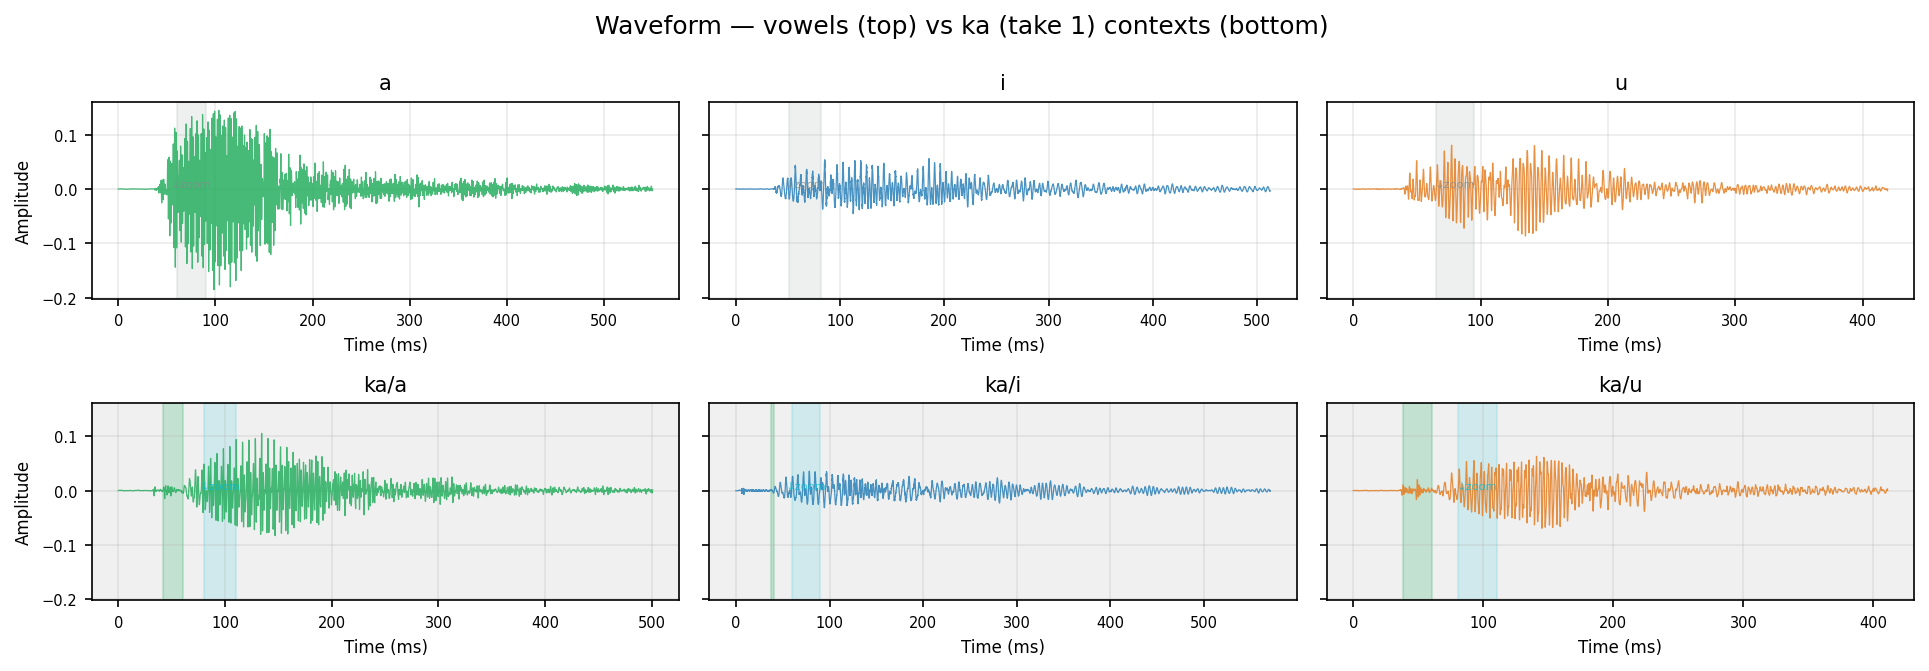
Human take 1
Green shading on CV waveforms = detected burst window (speech onset → first Praat-voiced frame).
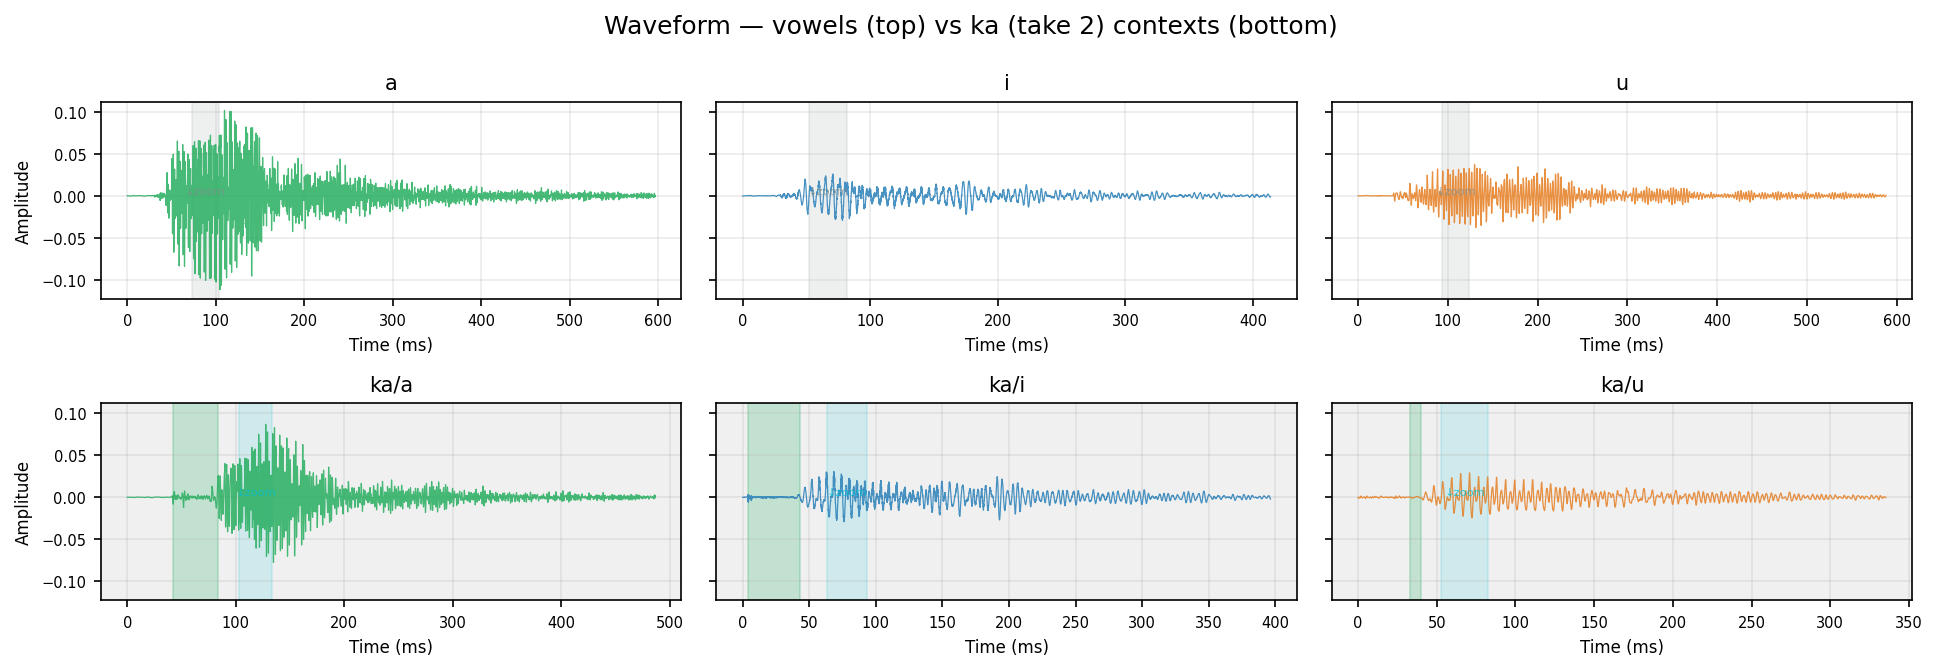
Human take 2
Green shading on CV waveforms = detected burst window (speech onset → first Praat-voiced frame).
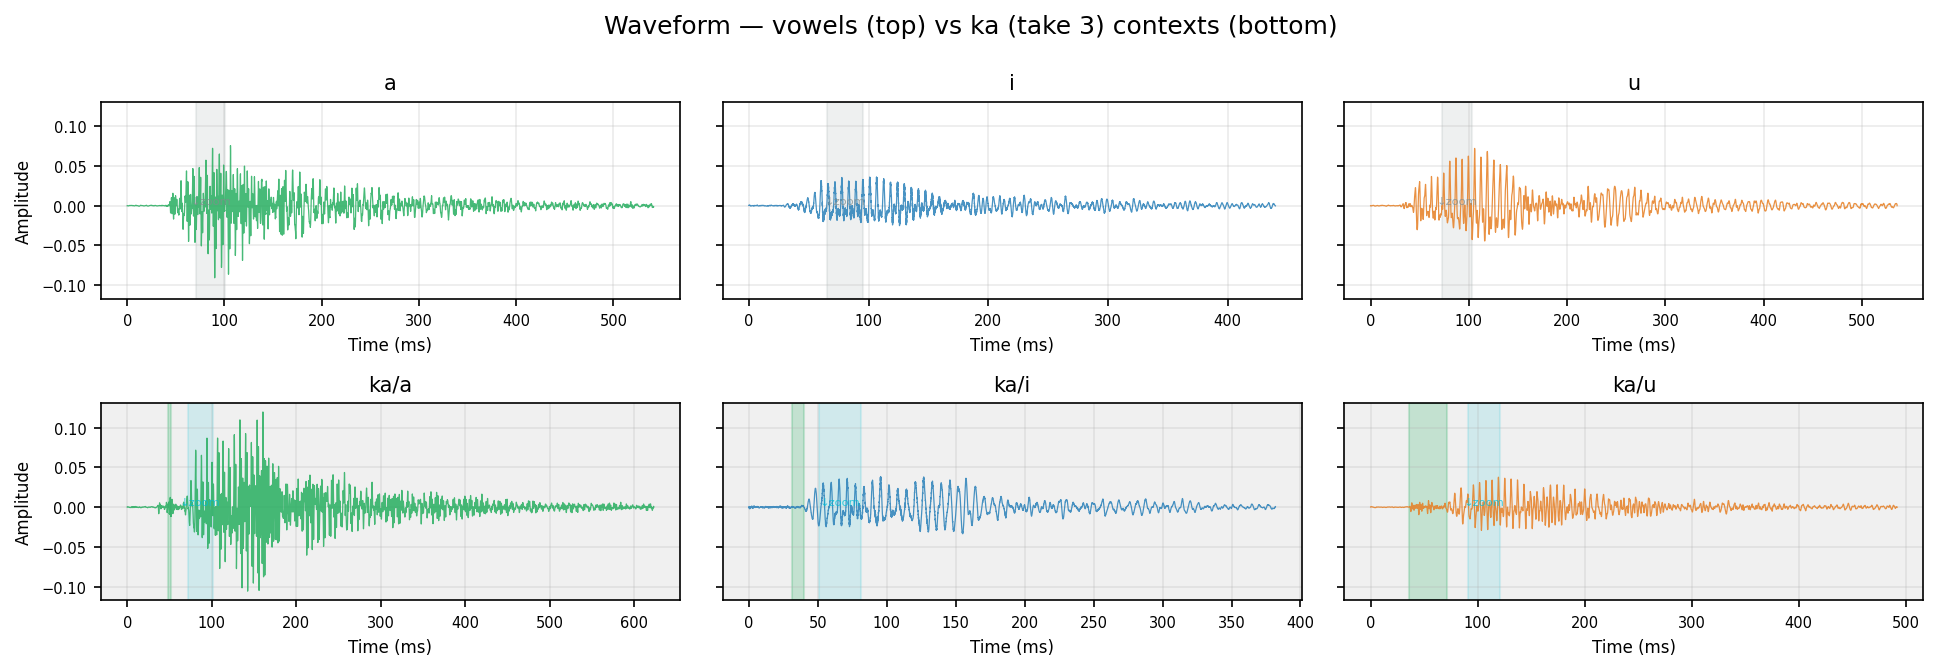
Human take 3
Green shading on CV waveforms = detected burst window (speech onset → first Praat-voiced frame).
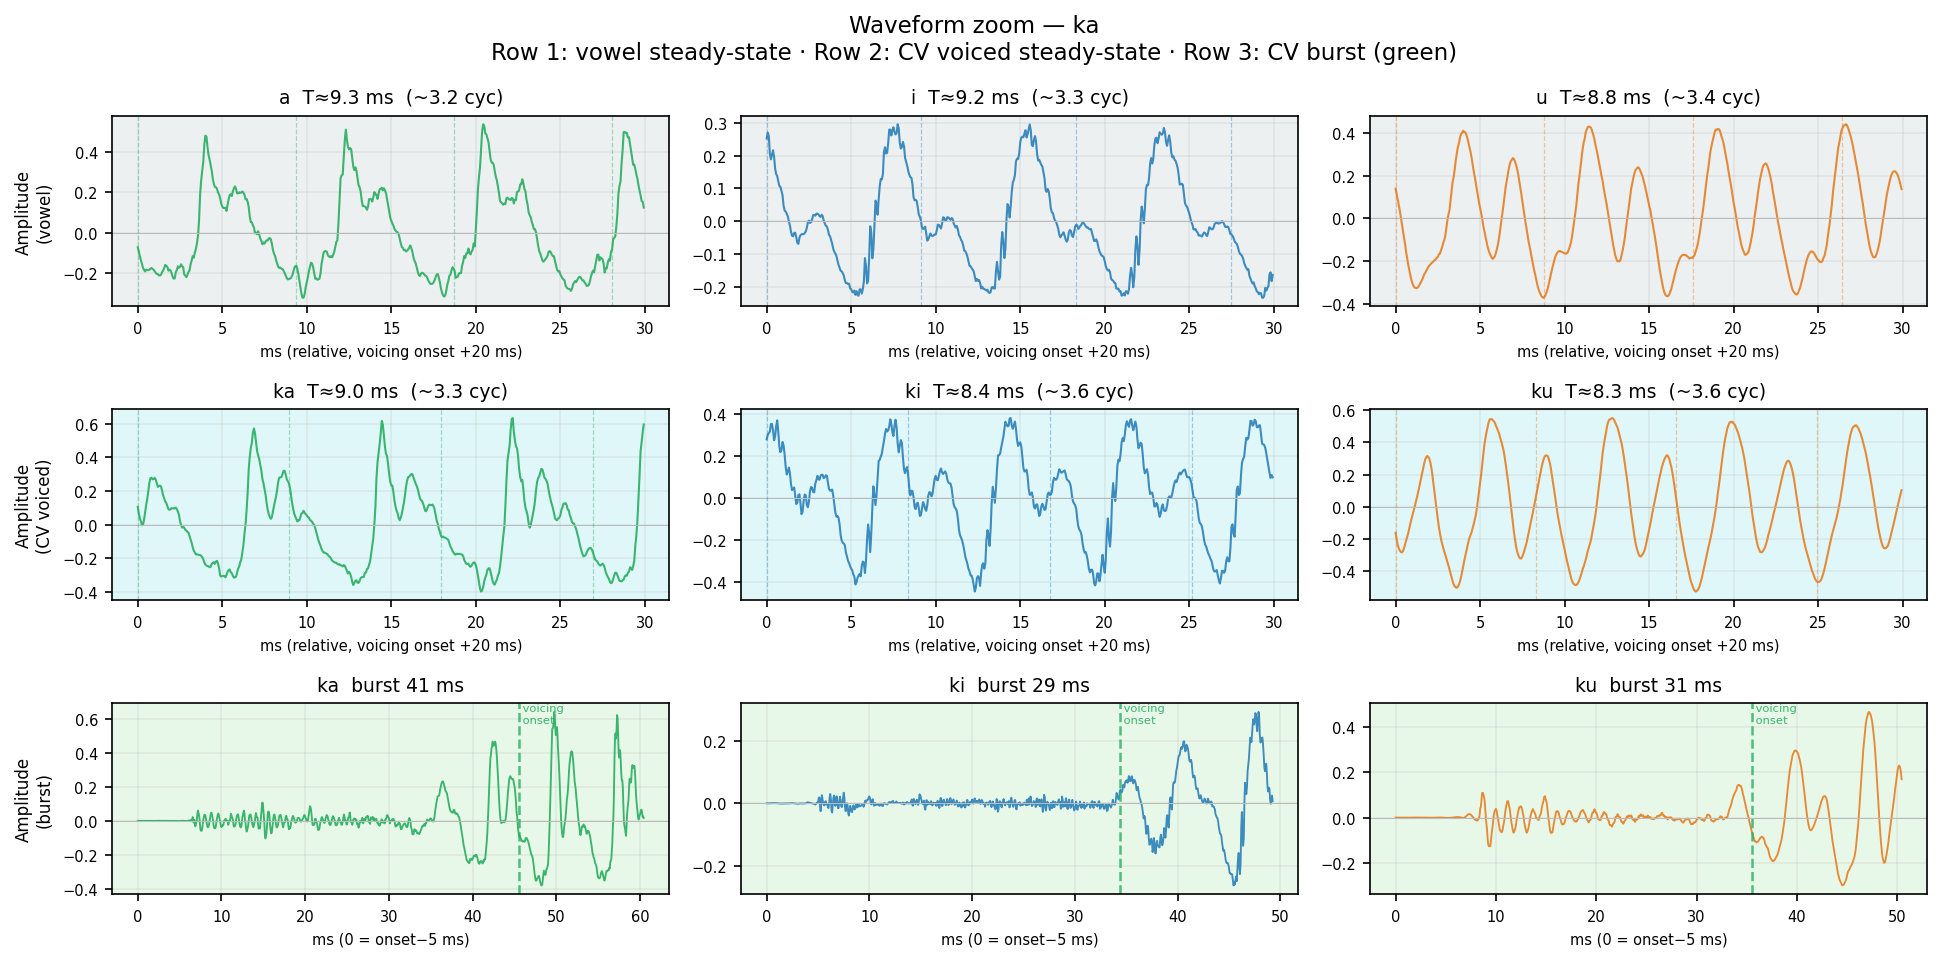
Row 1 (gray): Pure vowel steady-state — 30 ms, 20 ms after voicing onset. Row 2 (cyan): CV voiced steady-state — same window, shows vowel after consonant release. Row 3 (green): CV burst — aperiodic noise from stop release → transition to voicing (green dashed line = first voiced frame). Burst shape and duration differ by place of articulation. Dashed verticals in rows 1–2 = expected glottal period T = 1/F0. Waveform complexity = harmonic richness (pure sine = single harmonic; jagged = rich harmonics).
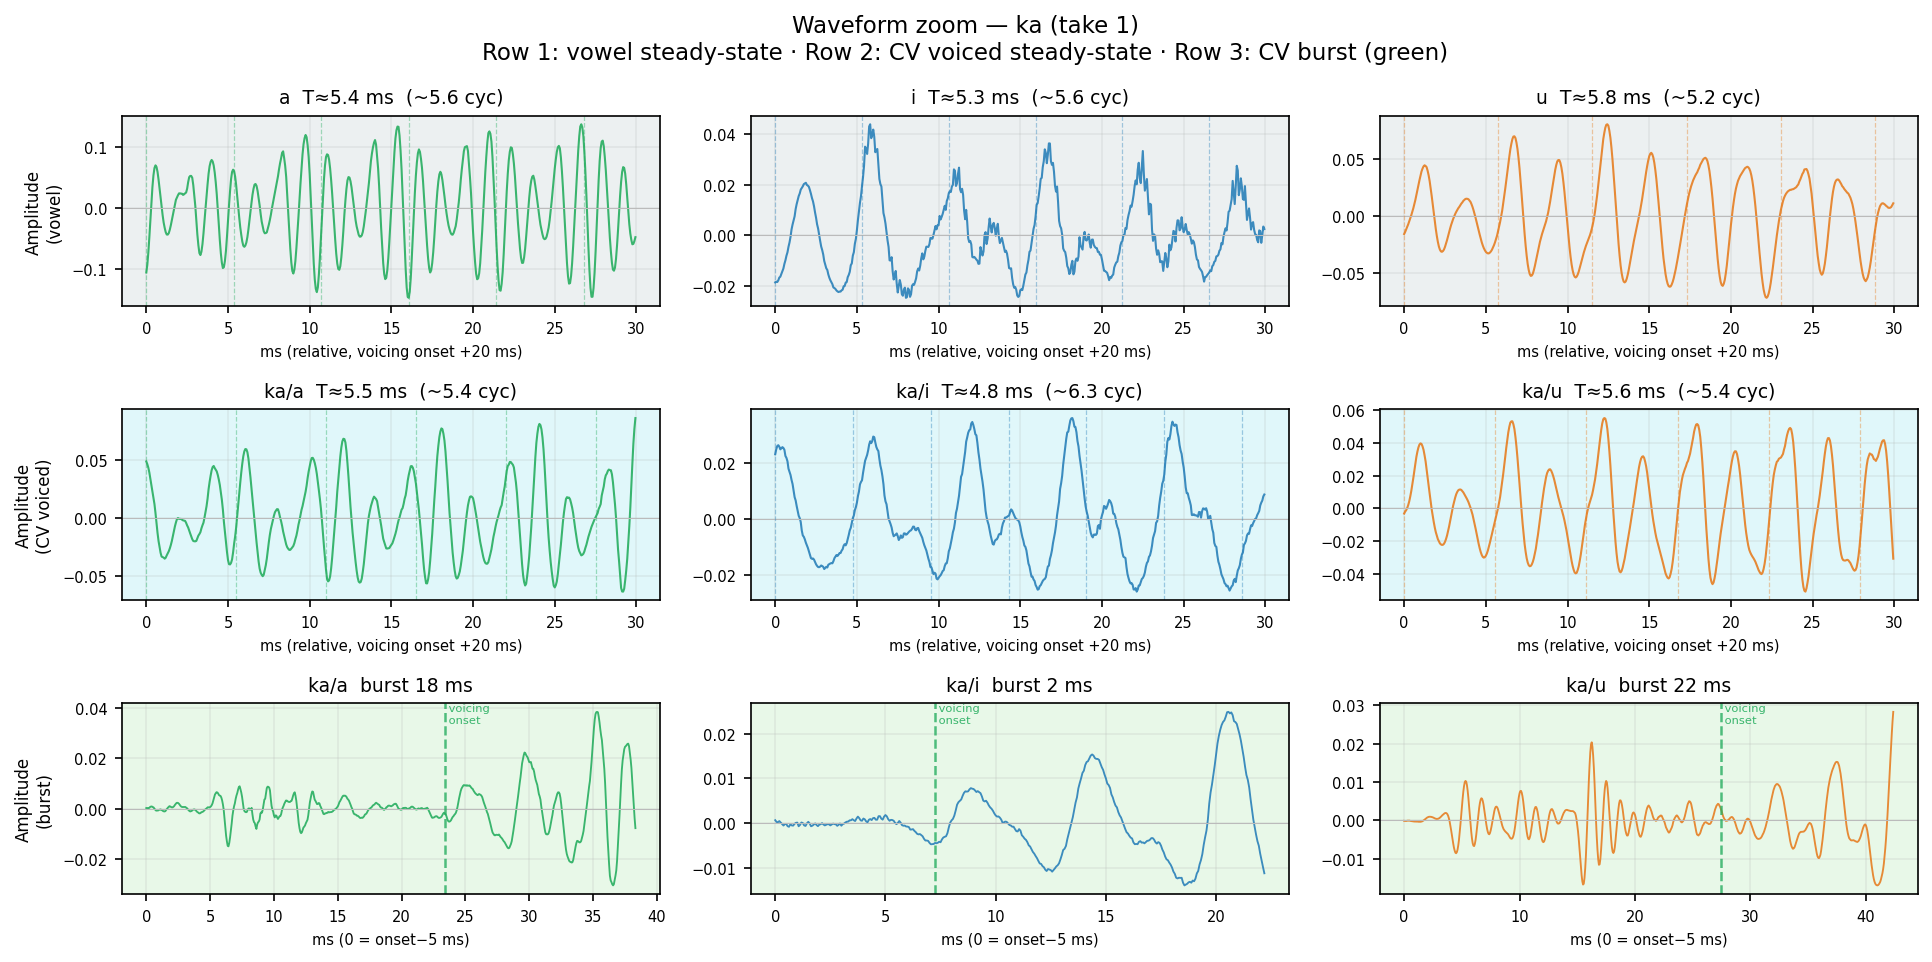
Human take 1
Row 1 (gray): Pure vowel steady-state — 30 ms, 20 ms after voicing onset. Row 2 (cyan): CV voiced steady-state — same window, shows vowel after consonant release. Row 3 (green): CV burst — aperiodic noise from stop release → transition to voicing (green dashed line = first voiced frame). Burst shape and duration differ by place of articulation. Dashed verticals in rows 1–2 = expected glottal period T = 1/F0. Waveform complexity = harmonic richness (pure sine = single harmonic; jagged = rich harmonics).
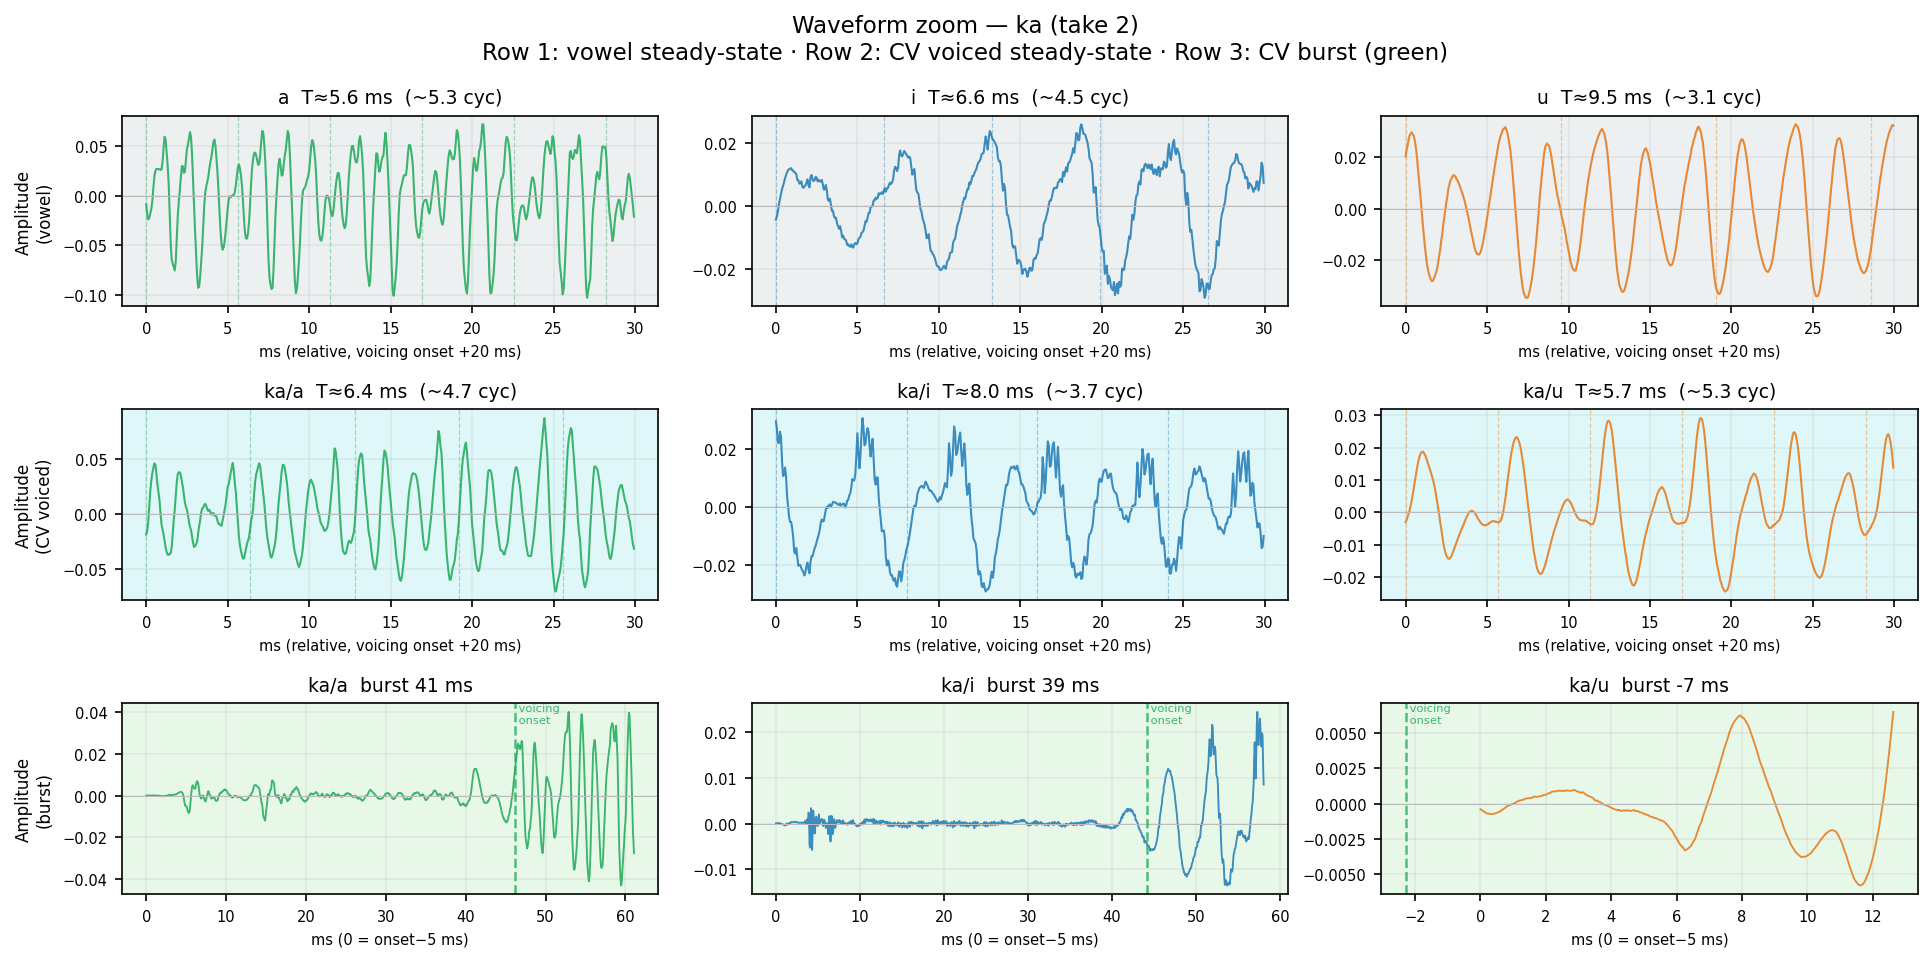
Human take 2
Row 1 (gray): Pure vowel steady-state — 30 ms, 20 ms after voicing onset. Row 2 (cyan): CV voiced steady-state — same window, shows vowel after consonant release. Row 3 (green): CV burst — aperiodic noise from stop release → transition to voicing (green dashed line = first voiced frame). Burst shape and duration differ by place of articulation. Dashed verticals in rows 1–2 = expected glottal period T = 1/F0. Waveform complexity = harmonic richness (pure sine = single harmonic; jagged = rich harmonics).
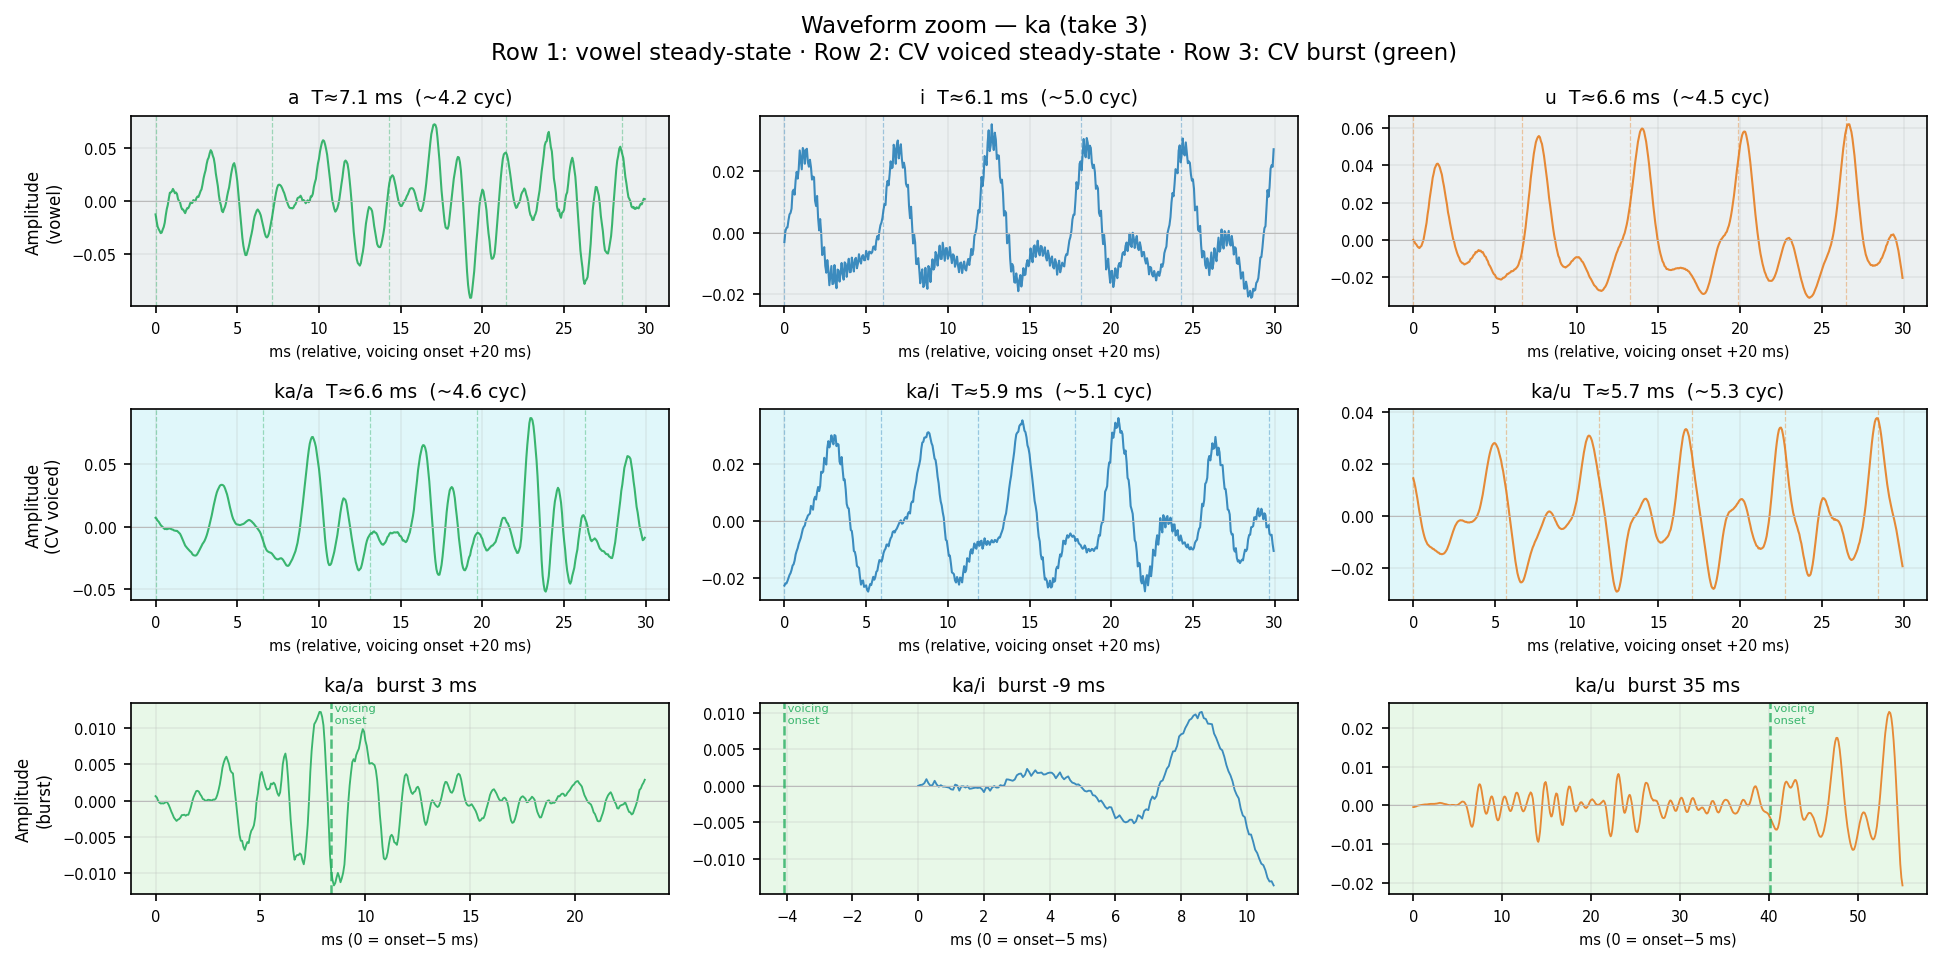
Human take 3
Row 1 (gray): Pure vowel steady-state — 30 ms, 20 ms after voicing onset. Row 2 (cyan): CV voiced steady-state — same window, shows vowel after consonant release. Row 3 (green): CV burst — aperiodic noise from stop release → transition to voicing (green dashed line = first voiced frame). Burst shape and duration differ by place of articulation. Dashed verticals in rows 1–2 = expected glottal period T = 1/F0. Waveform complexity = harmonic richness (pure sine = single harmonic; jagged = rich harmonics).
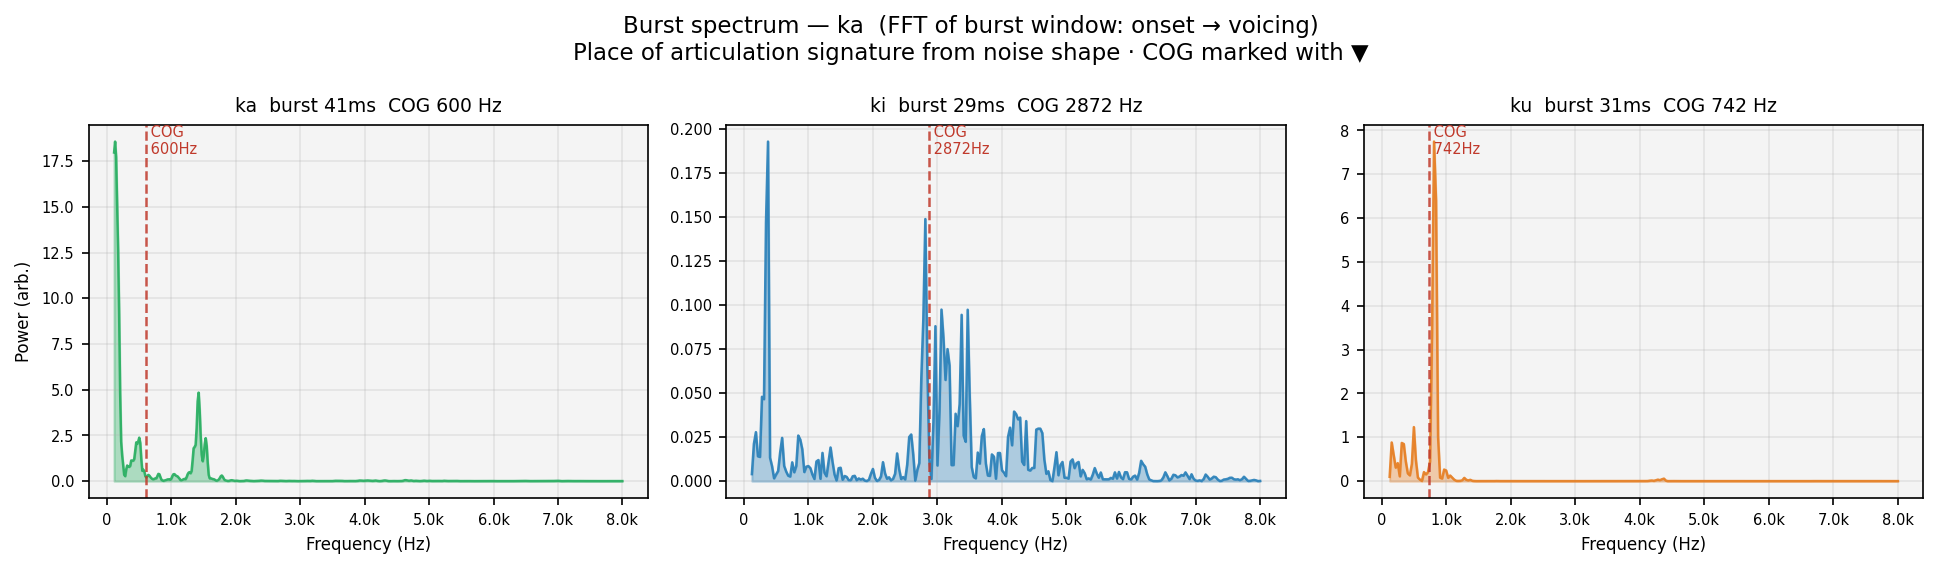
FFT of the aperiodic burst window (speech onset → first voiced frame) for each vowel context. Spectral centre of gravity (COG, red dashed) marks the dominant noise frequency — a place-of-articulation signature independent of the vowel. Velars peak mid-frequency (~1–2 kHz); dentals/alveolars peak high (>3 kHz); labials are spectrally flat. COG should be consistent across /a/i/u/ for the same consonant — vowel context should not change where the burst energy is.
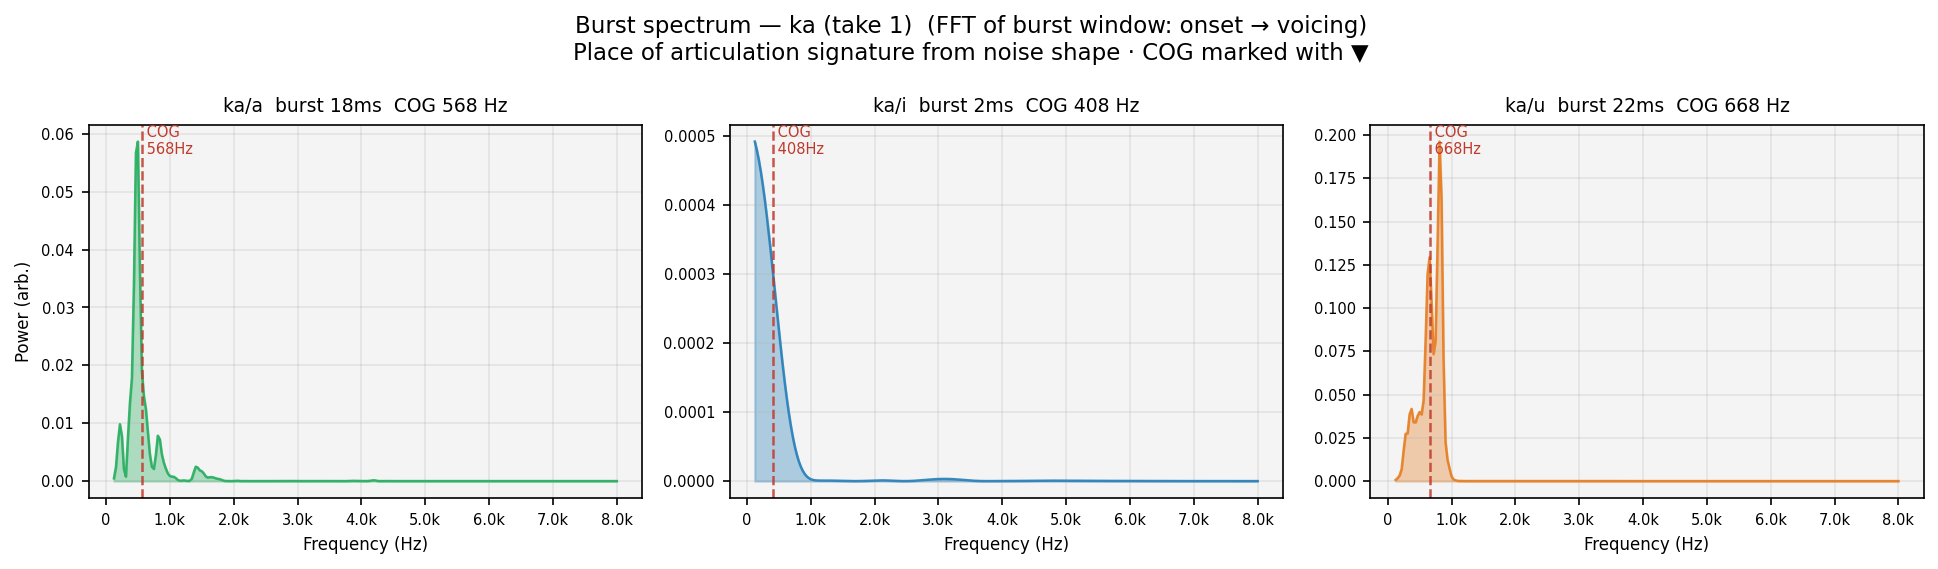
Human take 1
FFT of the aperiodic burst window (speech onset → first voiced frame) for each vowel context. Spectral centre of gravity (COG, red dashed) marks the dominant noise frequency — a place-of-articulation signature independent of the vowel. Velars peak mid-frequency (~1–2 kHz); dentals/alveolars peak high (>3 kHz); labials are spectrally flat. COG should be consistent across /a/i/u/ for the same consonant — vowel context should not change where the burst energy is.
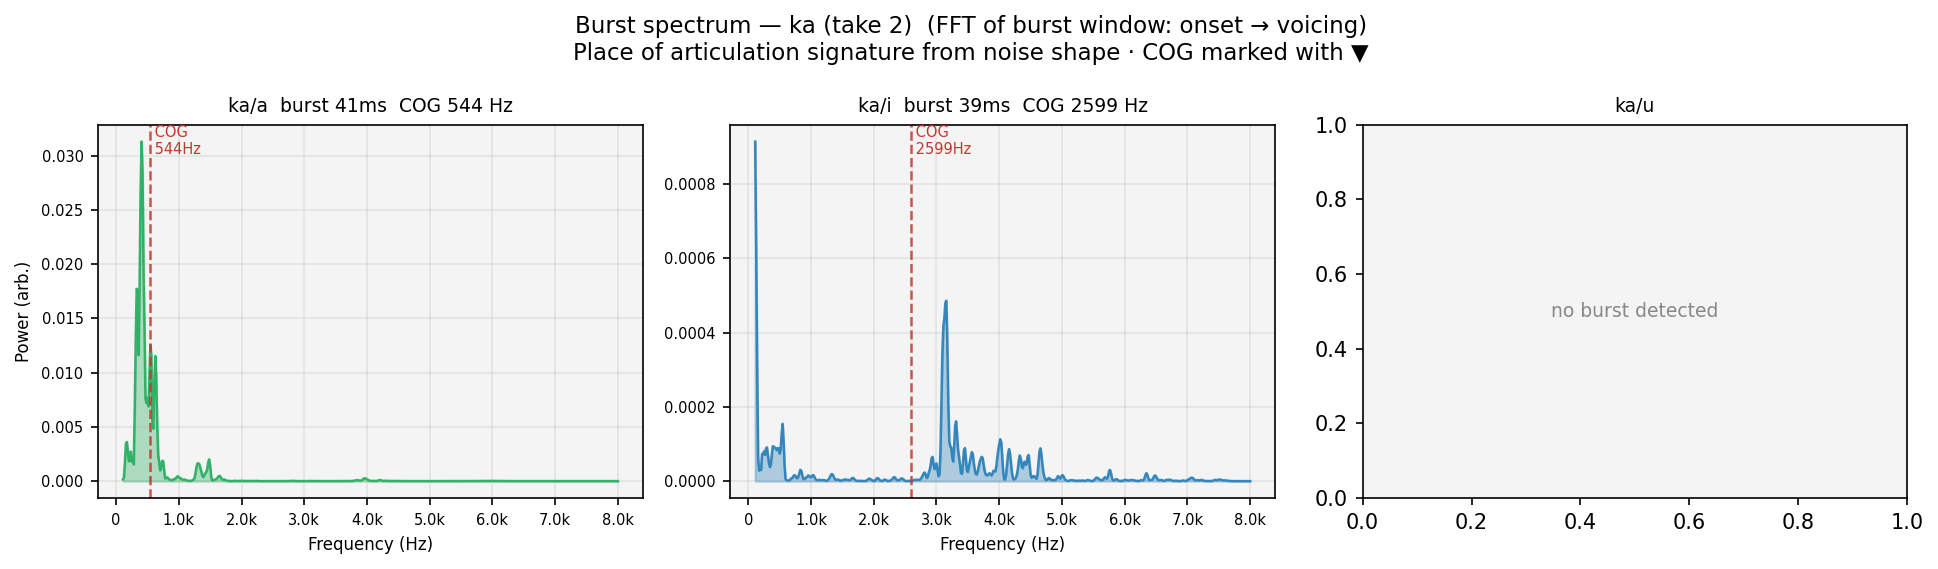
Human take 2
FFT of the aperiodic burst window (speech onset → first voiced frame) for each vowel context. Spectral centre of gravity (COG, red dashed) marks the dominant noise frequency — a place-of-articulation signature independent of the vowel. Velars peak mid-frequency (~1–2 kHz); dentals/alveolars peak high (>3 kHz); labials are spectrally flat. COG should be consistent across /a/i/u/ for the same consonant — vowel context should not change where the burst energy is.
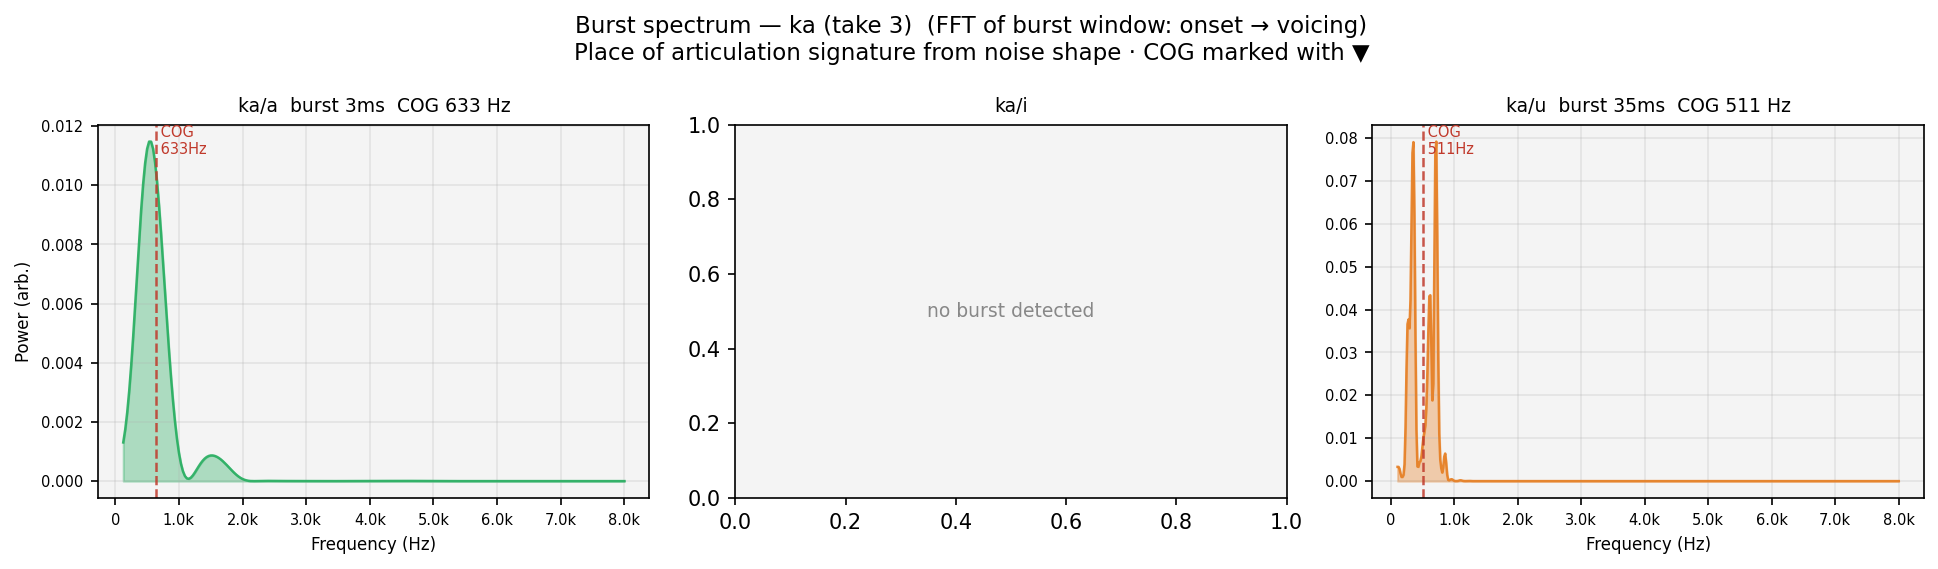
Human take 3
FFT of the aperiodic burst window (speech onset → first voiced frame) for each vowel context. Spectral centre of gravity (COG, red dashed) marks the dominant noise frequency — a place-of-articulation signature independent of the vowel. Velars peak mid-frequency (~1–2 kHz); dentals/alveolars peak high (>3 kHz); labials are spectrally flat. COG should be consistent across /a/i/u/ for the same consonant — vowel context should not change where the burst energy is.
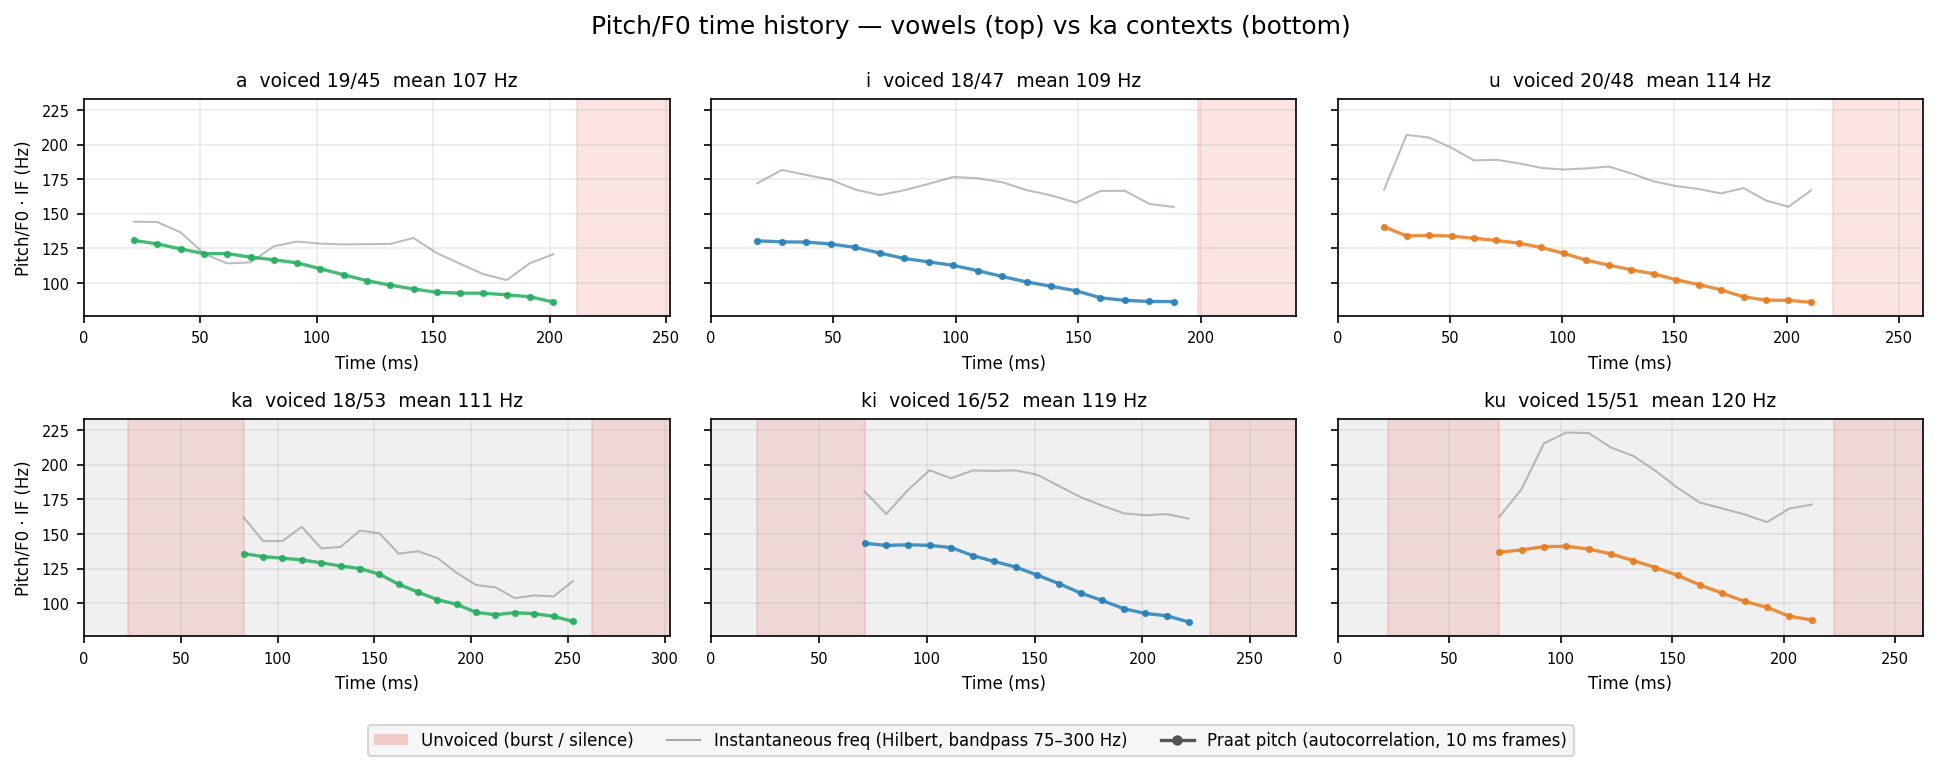
Colored dots = Praat pitch (autocorrelation, 10 ms frames). Gray line = instantaneous frequency (Hilbert transform on 75–300 Hz bandpass). Both show F0 region — IF is noisier; Praat smooths by choosing the most periodic candidate. Red shade = unvoiced (burst / silence).
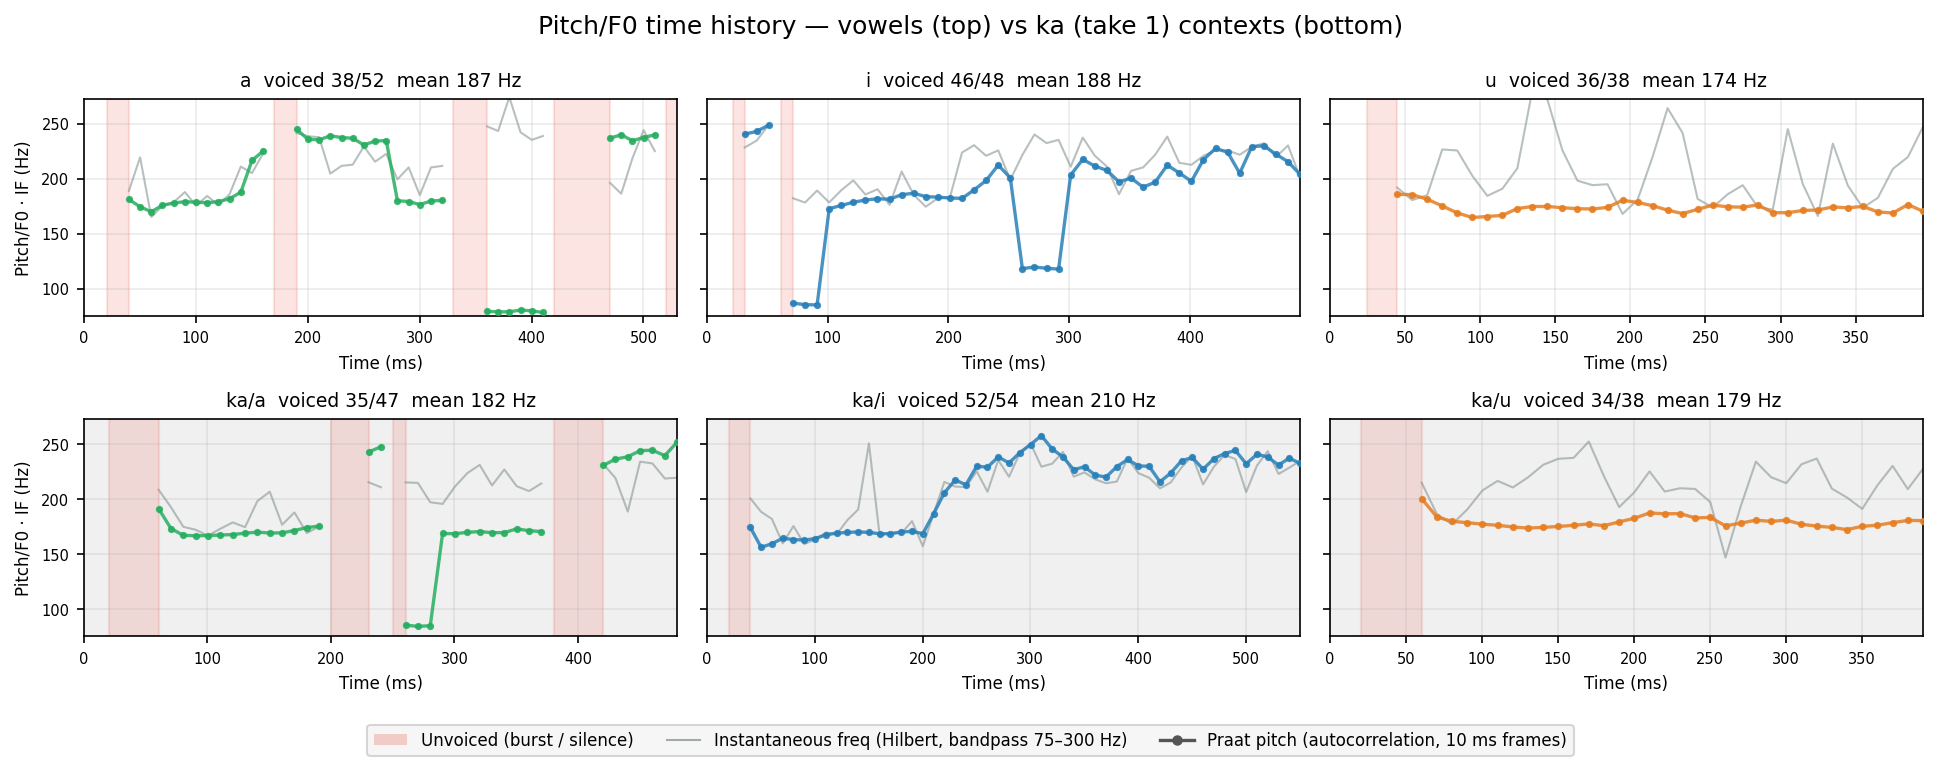
Human take 1
Colored dots = Praat pitch (autocorrelation, 10 ms frames). Gray line = instantaneous frequency (Hilbert transform on 75–300 Hz bandpass). Both show F0 region — IF is noisier; Praat smooths by choosing the most periodic candidate. Red shade = unvoiced (burst / silence).
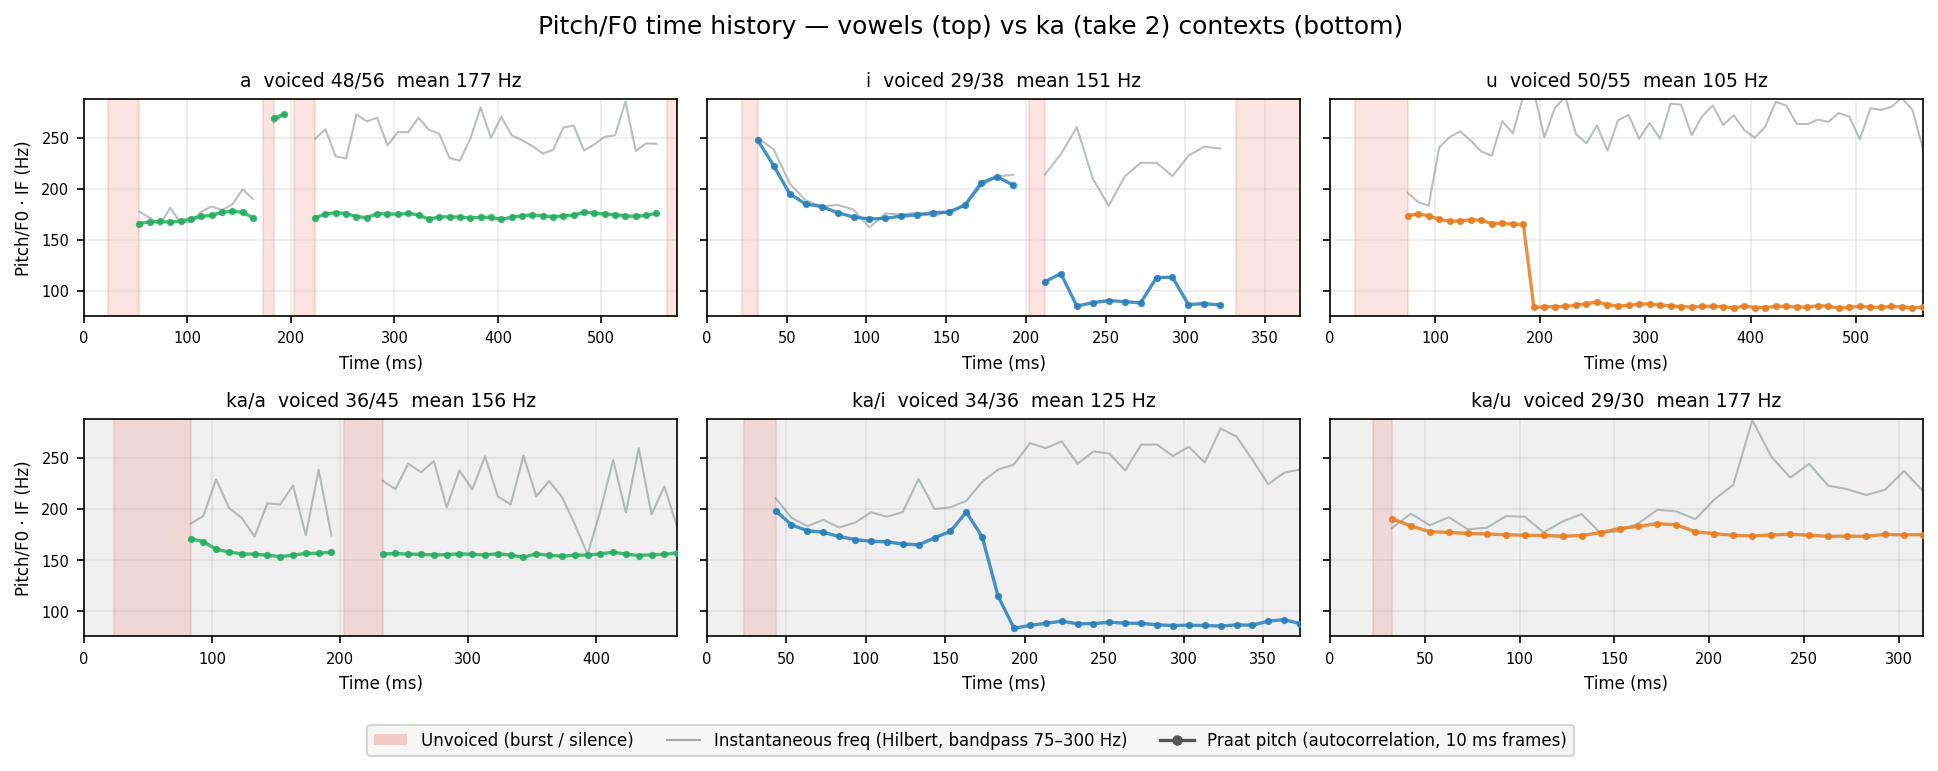
Human take 2
Colored dots = Praat pitch (autocorrelation, 10 ms frames). Gray line = instantaneous frequency (Hilbert transform on 75–300 Hz bandpass). Both show F0 region — IF is noisier; Praat smooths by choosing the most periodic candidate. Red shade = unvoiced (burst / silence).
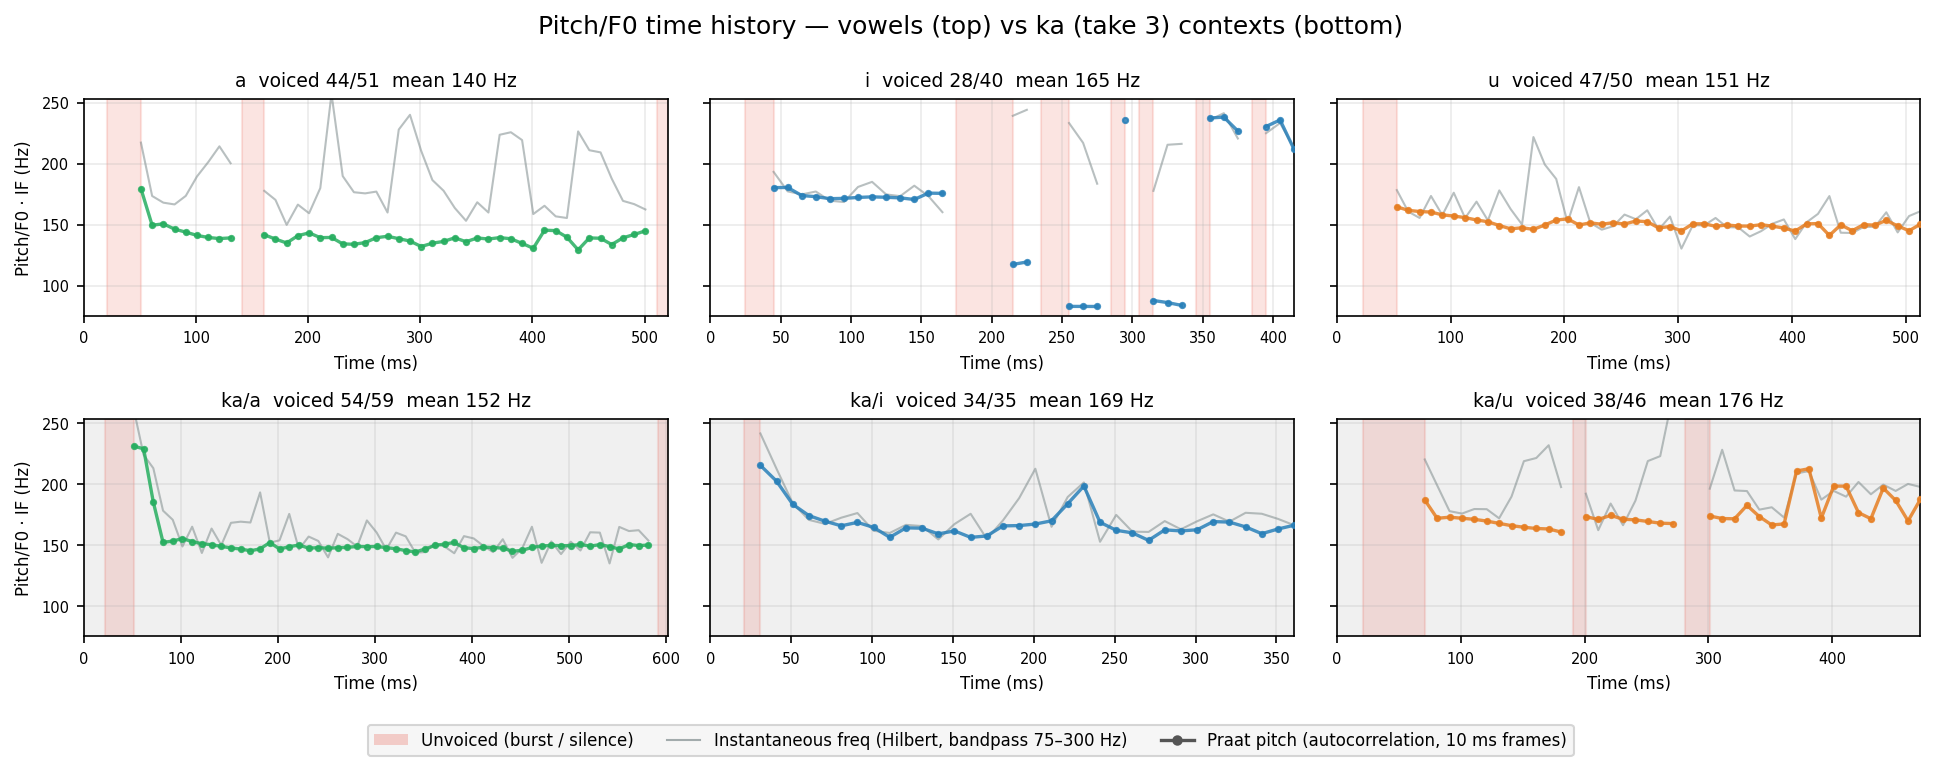
Human take 3
Colored dots = Praat pitch (autocorrelation, 10 ms frames). Gray line = instantaneous frequency (Hilbert transform on 75–300 Hz bandpass). Both show F0 region — IF is noisier; Praat smooths by choosing the most periodic candidate. Red shade = unvoiced (burst / silence).
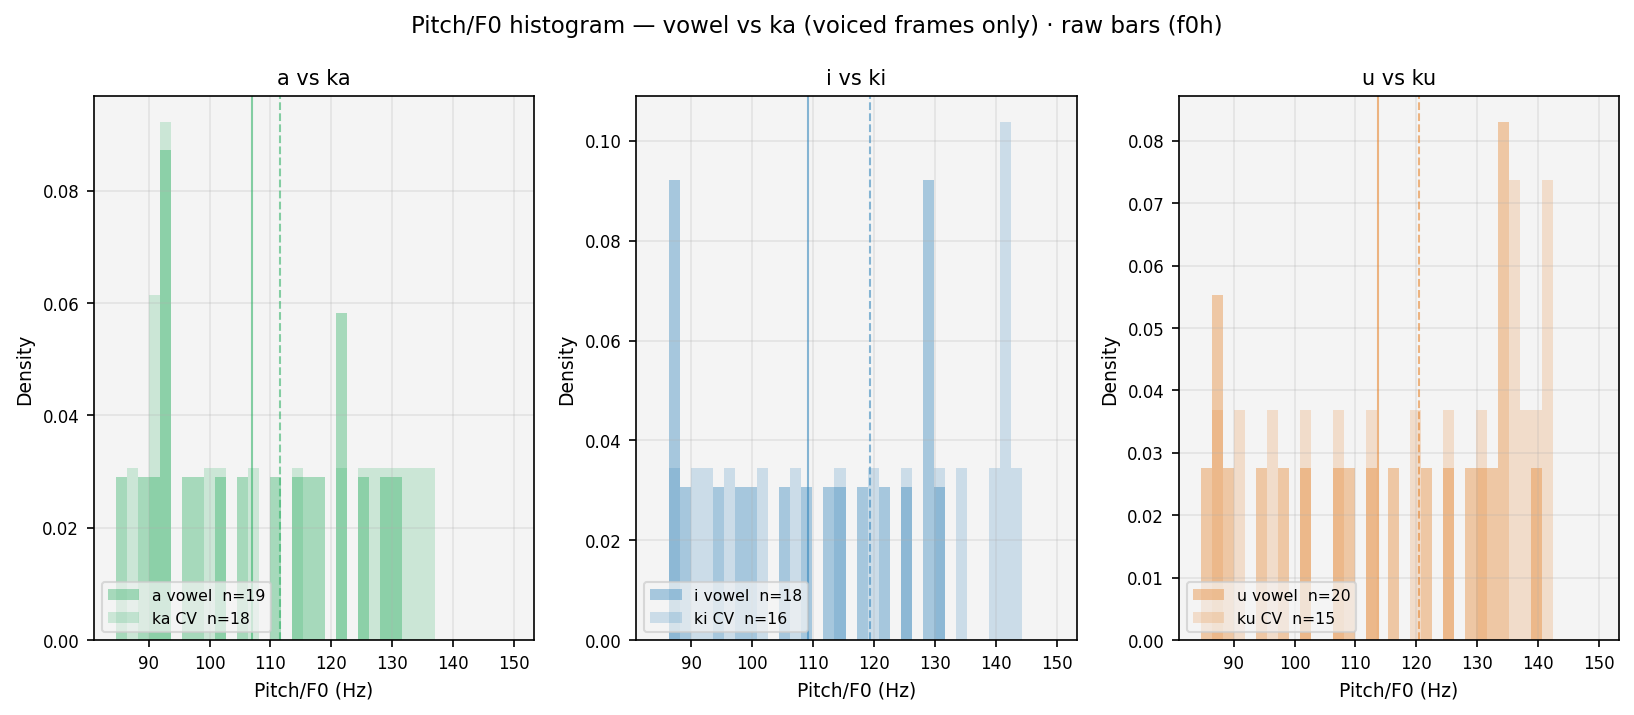
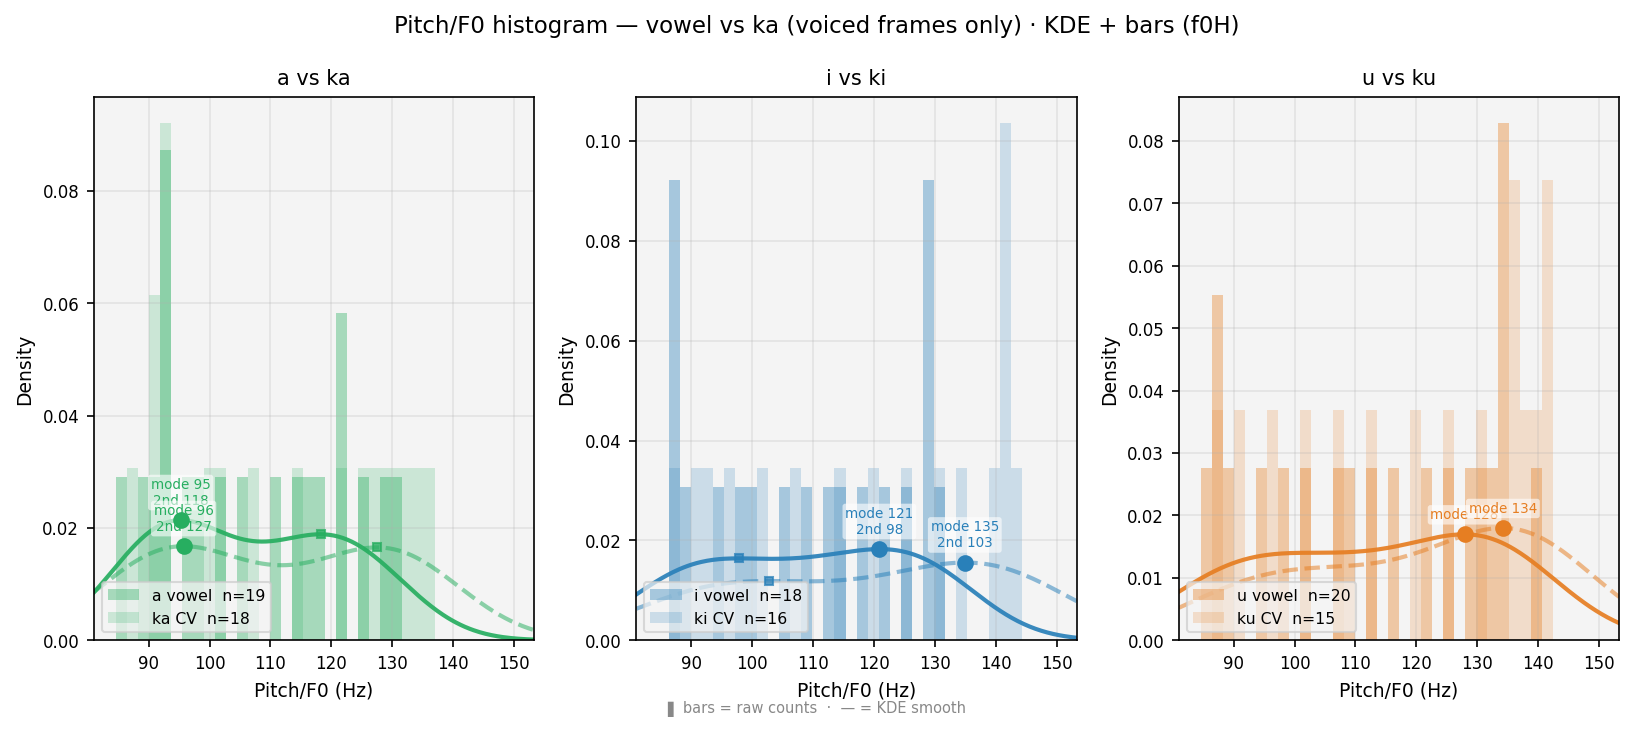
Smoothed histogram (each curve = bars drawn as a continuous line to avoid clutter from overlapping bars). Solid = vowel · Dashed = CV · voiced frames only. ● = primary peak (mode, most frequent pitch). ■ = secondary peak (onset elevation, smaller square). Thin verticals = means. Burst frames absent: voiceless stops produce no vocal-cord vibration — Praat returns NaN, so those frames never enter this plot.
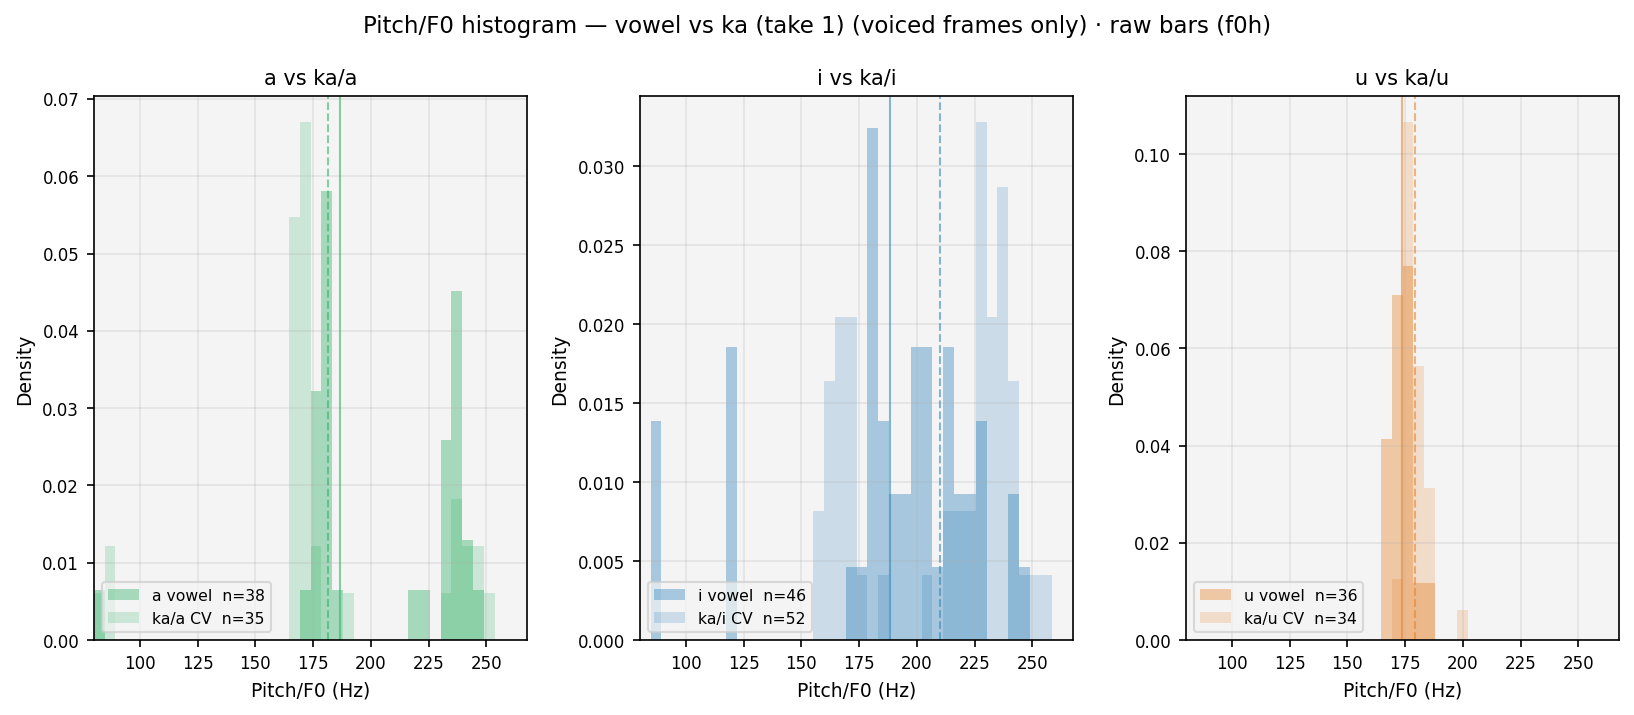
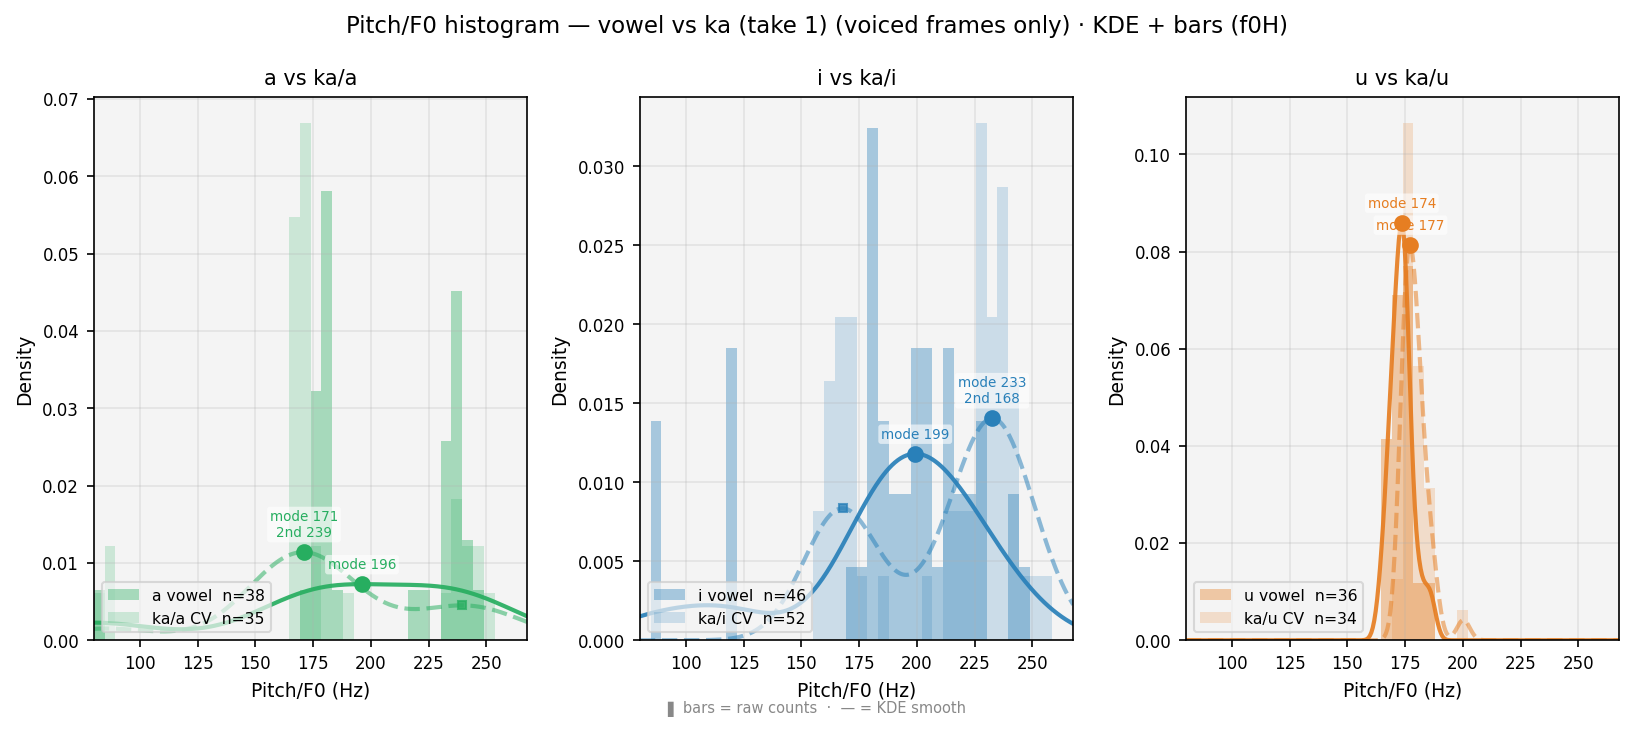
Smoothed histogram (each curve = bars drawn as a continuous line to avoid clutter from overlapping bars). Solid = vowel · Dashed = CV · voiced frames only. ● = primary peak (mode, most frequent pitch). ■ = secondary peak (onset elevation, smaller square). Thin verticals = means. Burst frames absent: voiceless stops produce no vocal-cord vibration — Praat returns NaN, so those frames never enter this plot.
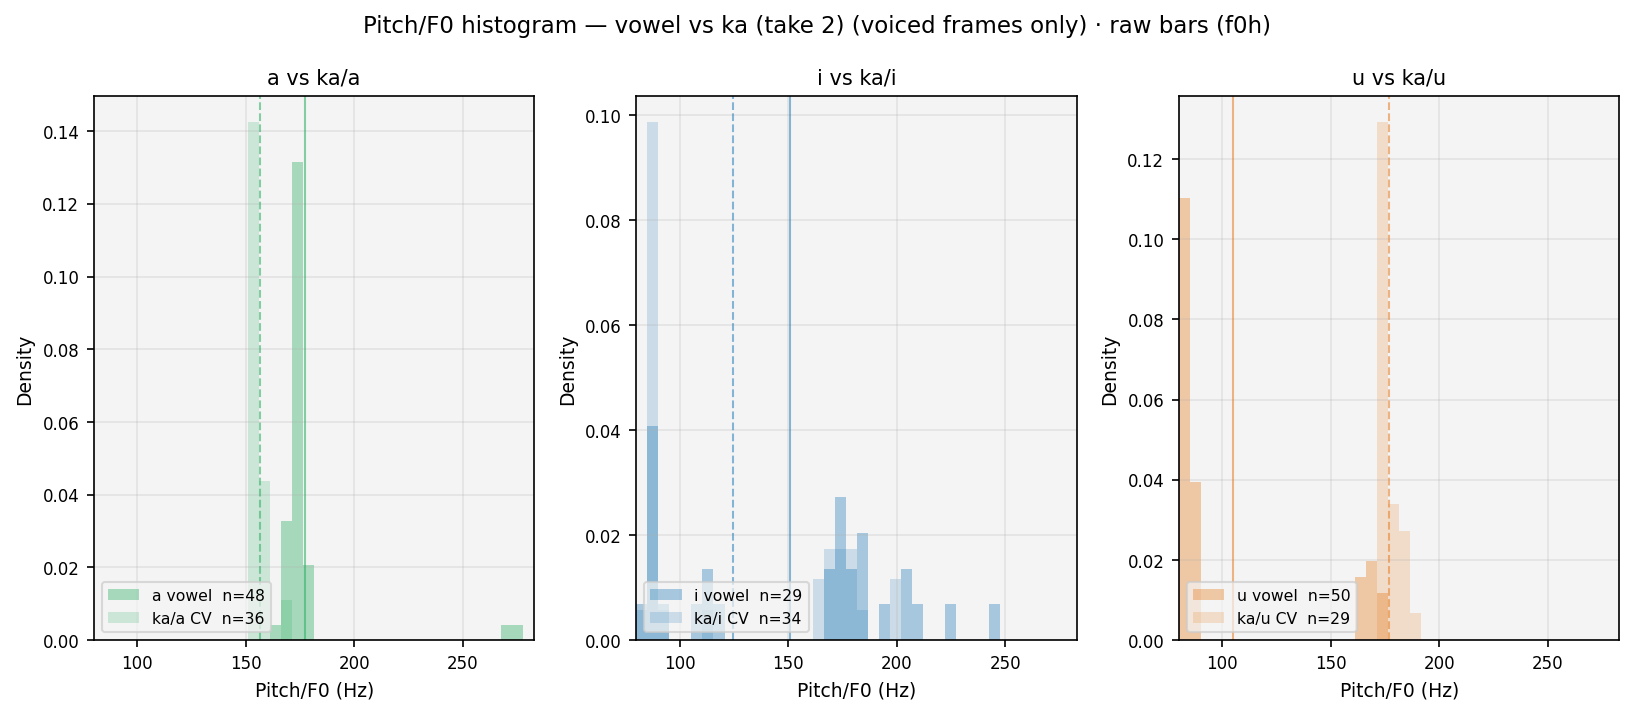
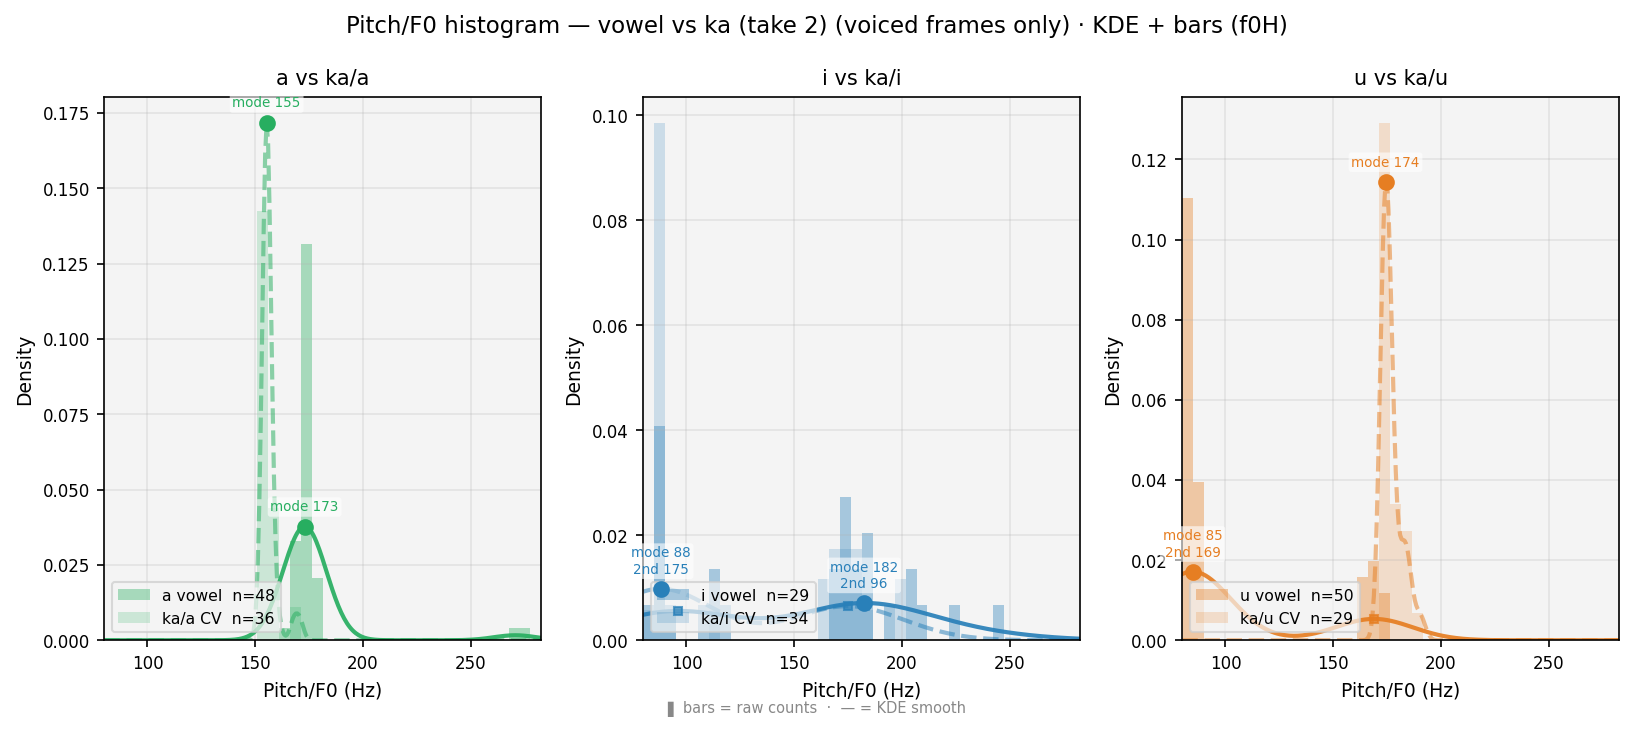
Smoothed histogram (each curve = bars drawn as a continuous line to avoid clutter from overlapping bars). Solid = vowel · Dashed = CV · voiced frames only. ● = primary peak (mode, most frequent pitch). ■ = secondary peak (onset elevation, smaller square). Thin verticals = means. Burst frames absent: voiceless stops produce no vocal-cord vibration — Praat returns NaN, so those frames never enter this plot.
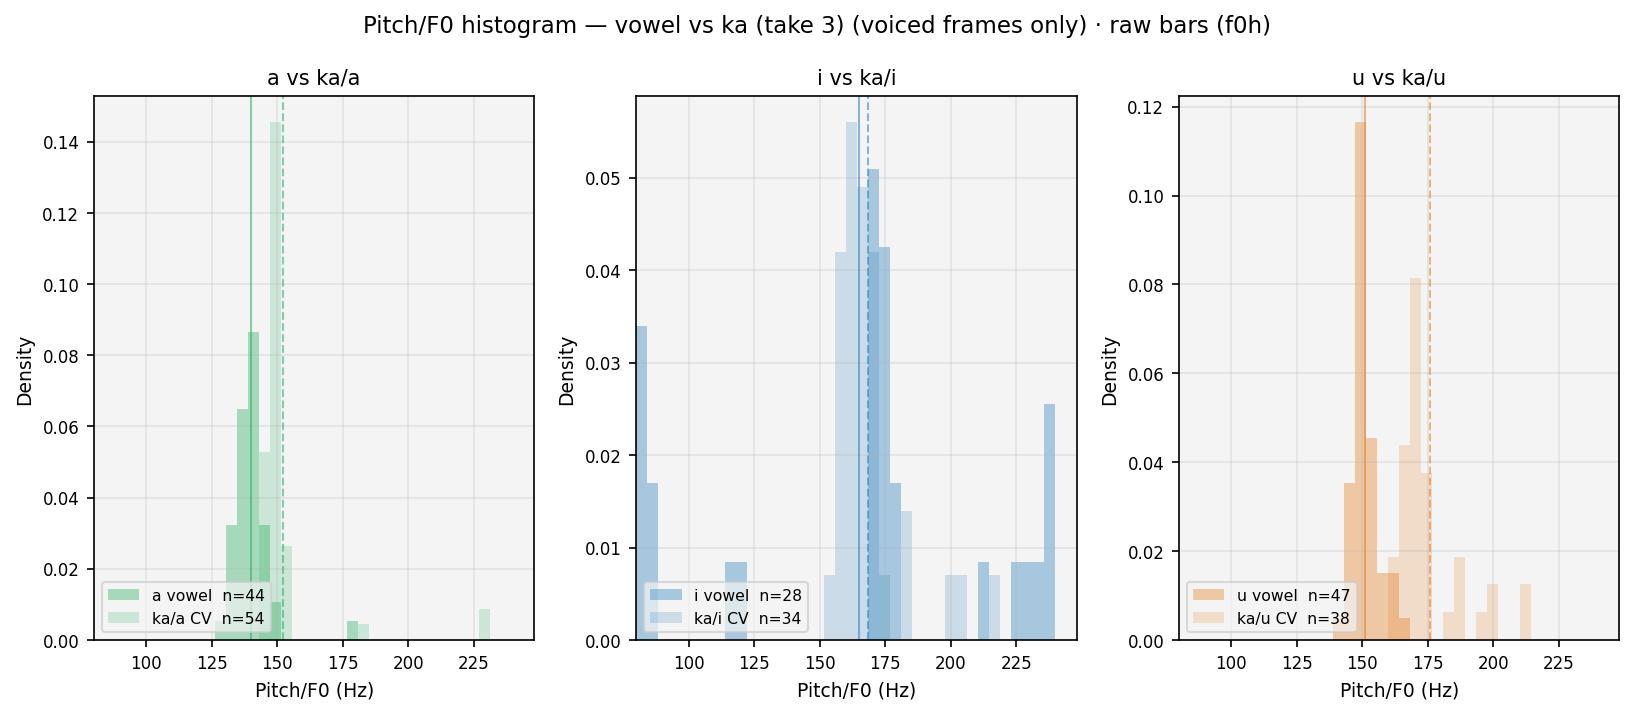
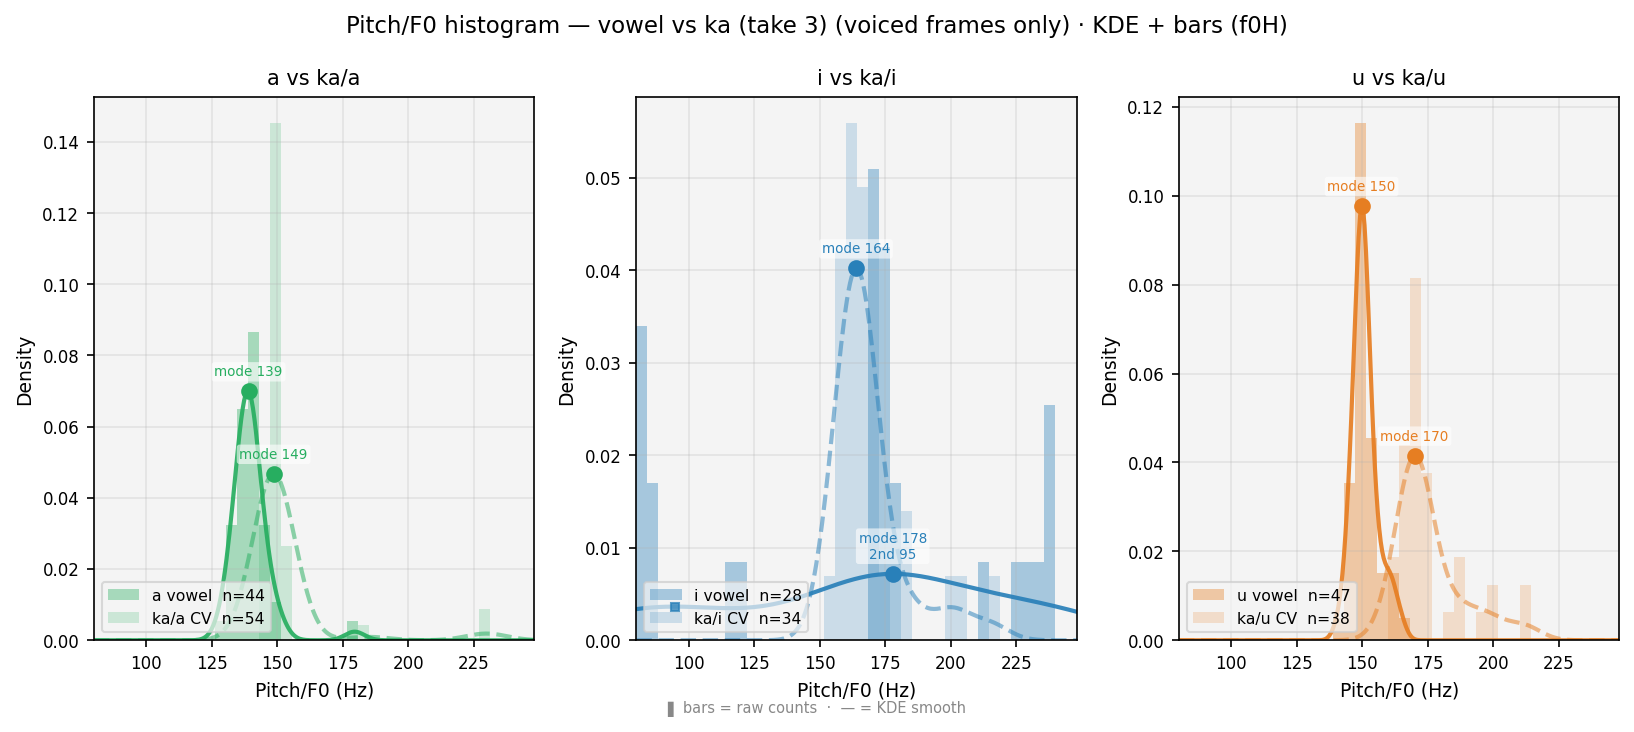
Smoothed histogram (each curve = bars drawn as a continuous line to avoid clutter from overlapping bars). Solid = vowel · Dashed = CV · voiced frames only. ● = primary peak (mode, most frequent pitch). ■ = secondary peak (onset elevation, smaller square). Thin verticals = means. Burst frames absent: voiceless stops produce no vocal-cord vibration — Praat returns NaN, so those frames never enter this plot.
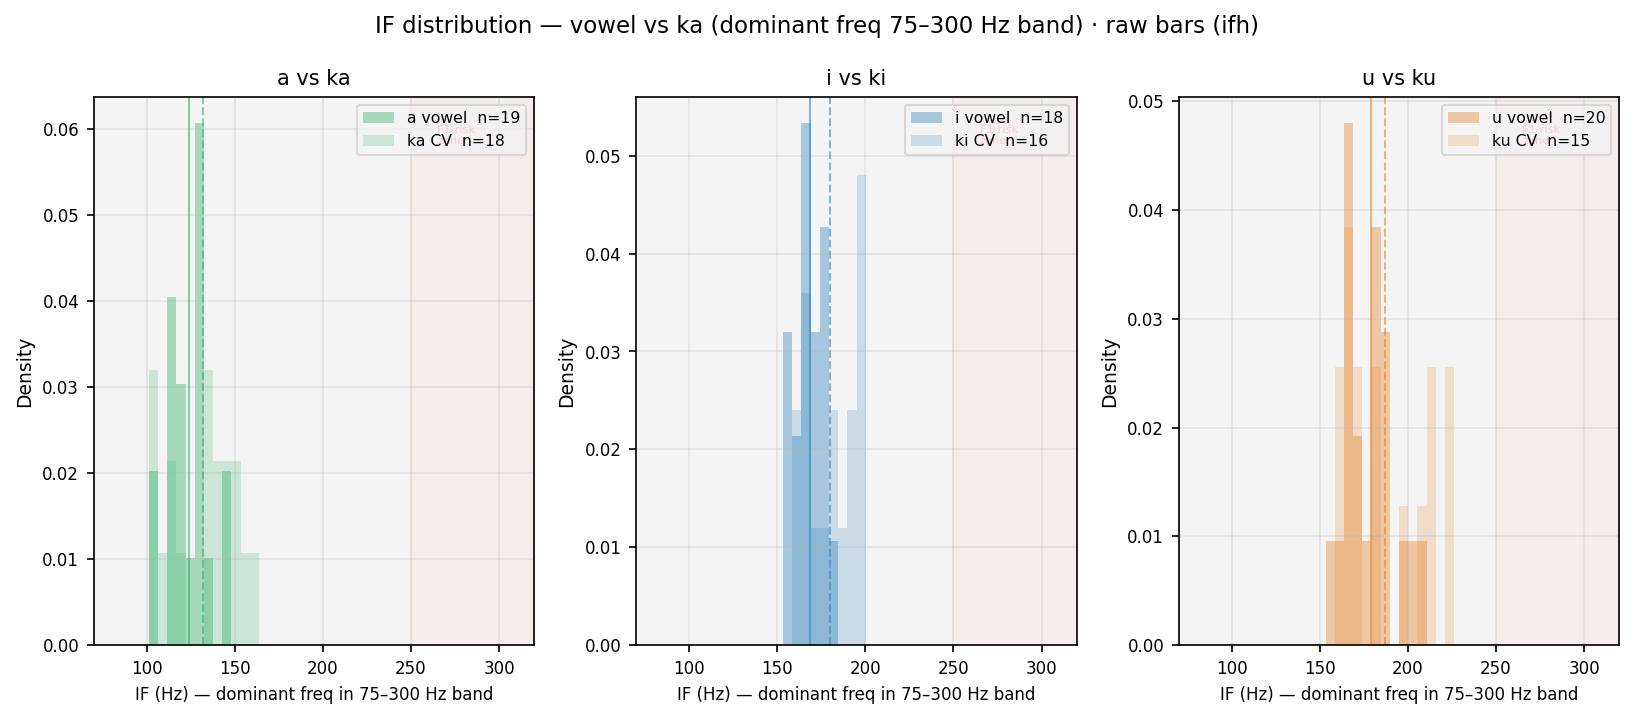
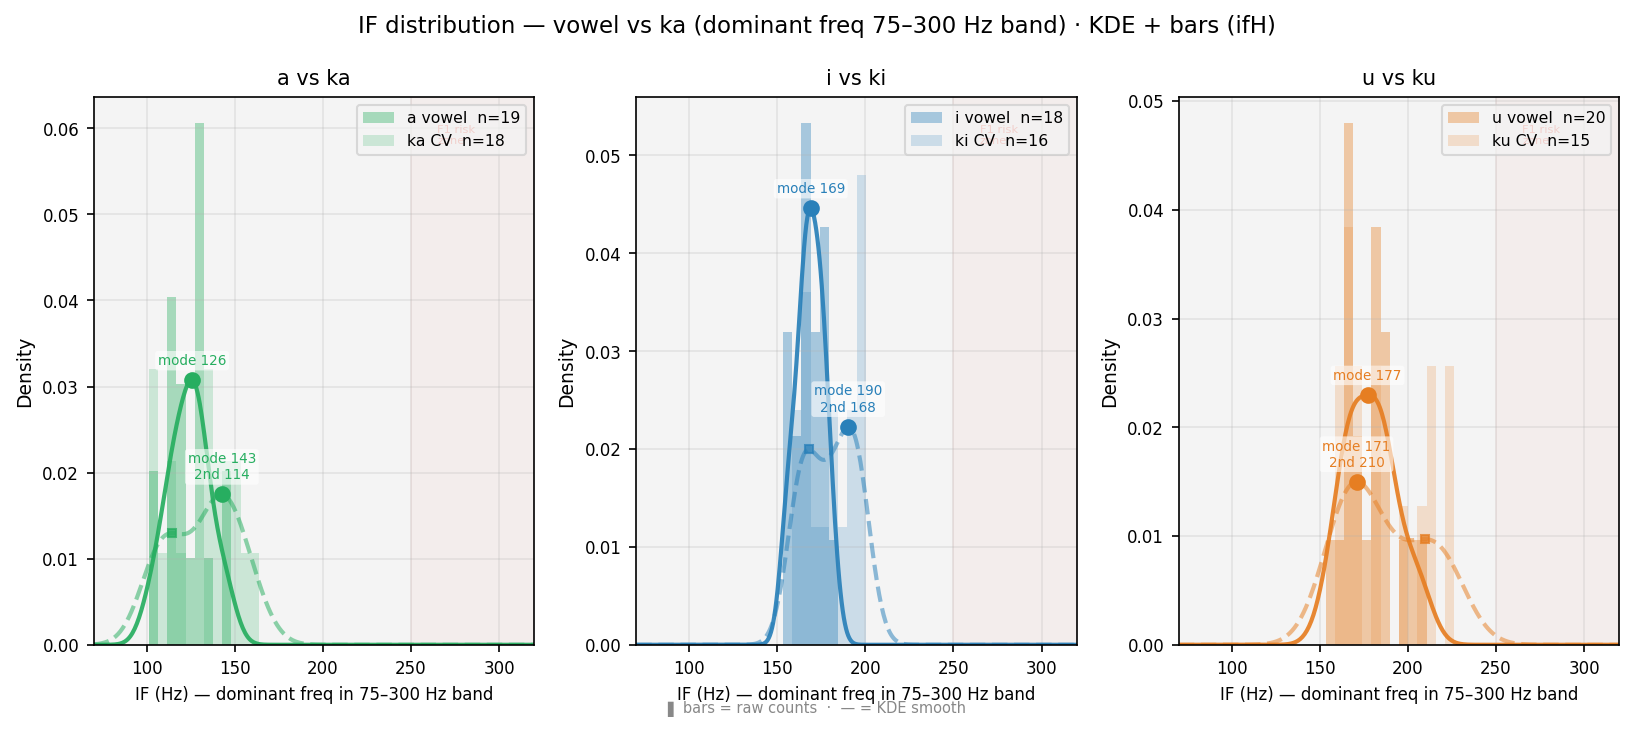
Distribution of instantaneous frequency (Hilbert transform, bandpass 75–300 Hz) at Praat frame rate. For /a/ (F1~800 Hz, outside band): IF tracks F0 — histogram aligns with Praat pitch histogram. For /i/ /u/ (F1~280–300 Hz, inside band): IF may track F1 — red-shaded zone marks this risk. Comparison of vowel vs CV curves shows coarticulation effect on dominant bandpass frequency. ● primary peak · ■ secondary peak.
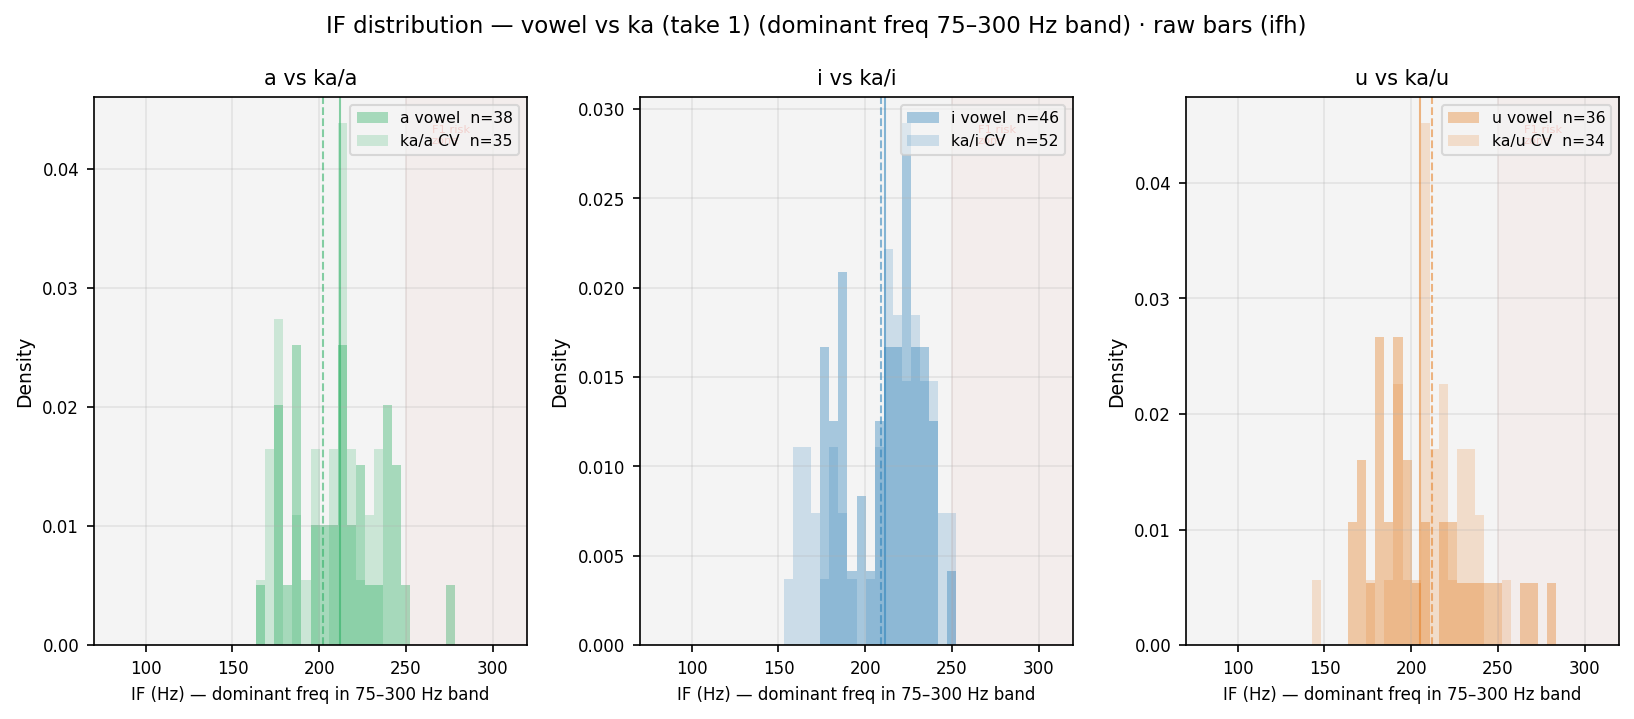
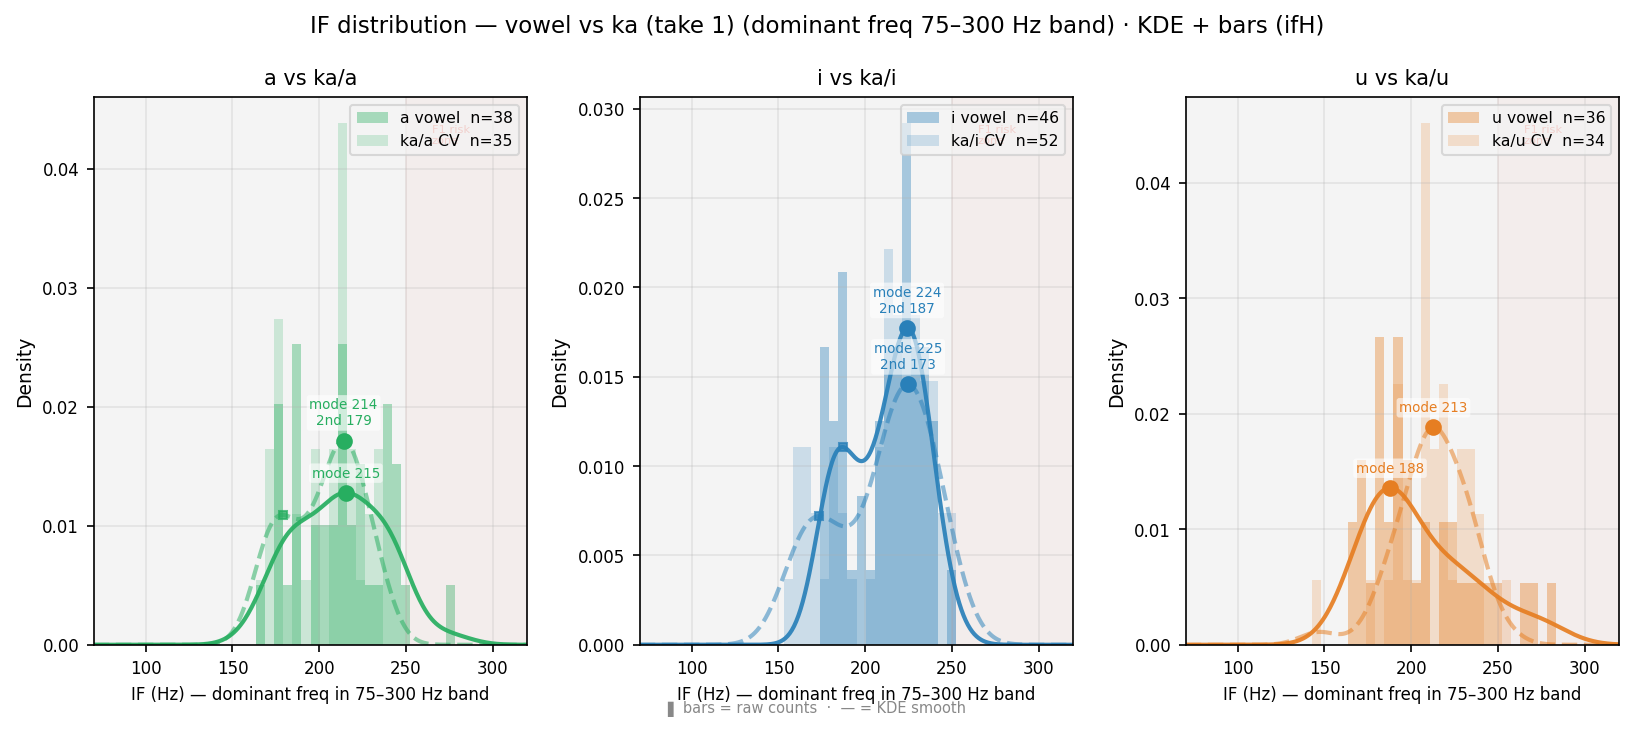
Distribution of instantaneous frequency (Hilbert transform, bandpass 75–300 Hz) at Praat frame rate. For /a/ (F1~800 Hz, outside band): IF tracks F0 — histogram aligns with Praat pitch histogram. For /i/ /u/ (F1~280–300 Hz, inside band): IF may track F1 — red-shaded zone marks this risk. Comparison of vowel vs CV curves shows coarticulation effect on dominant bandpass frequency. ● primary peak · ■ secondary peak.
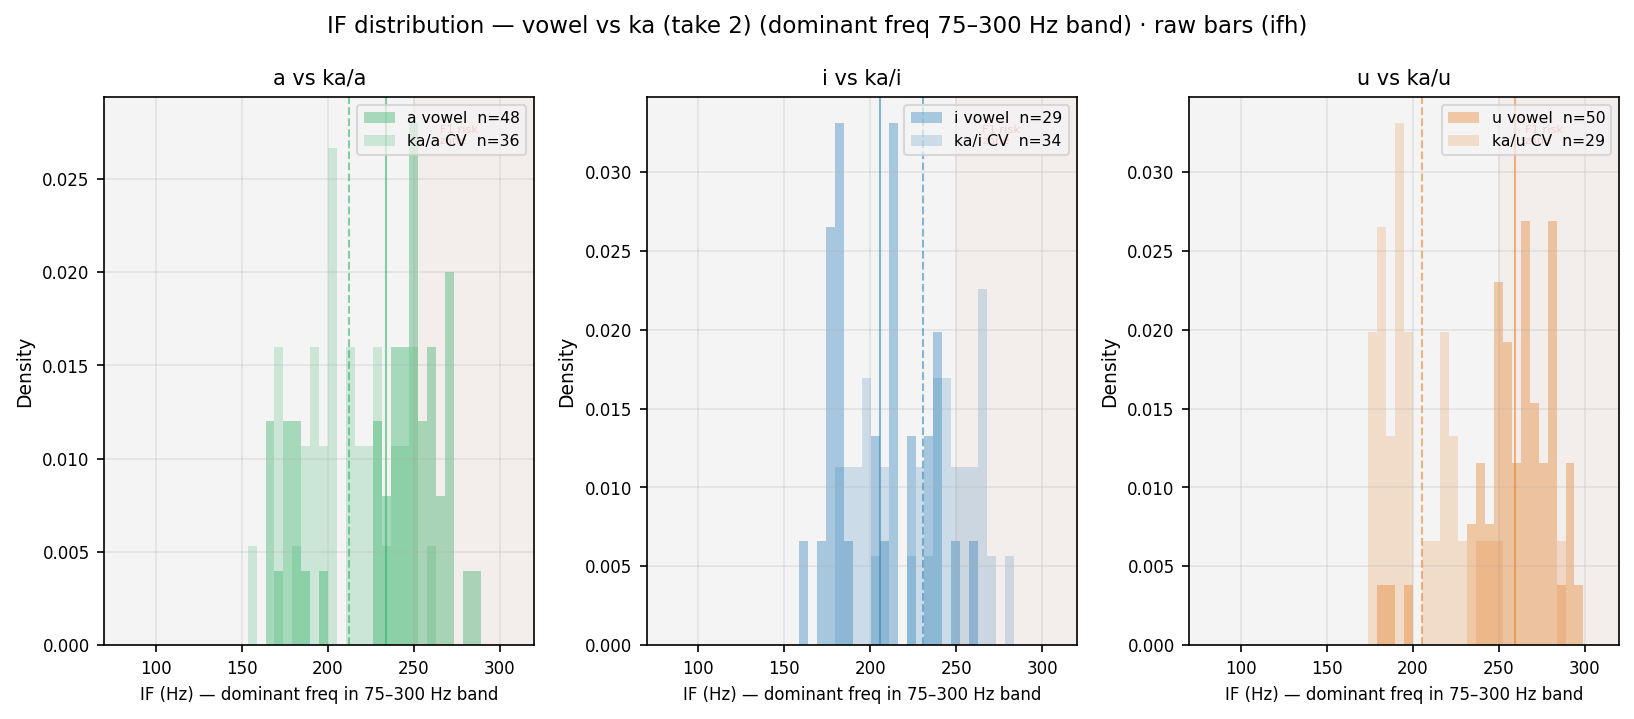
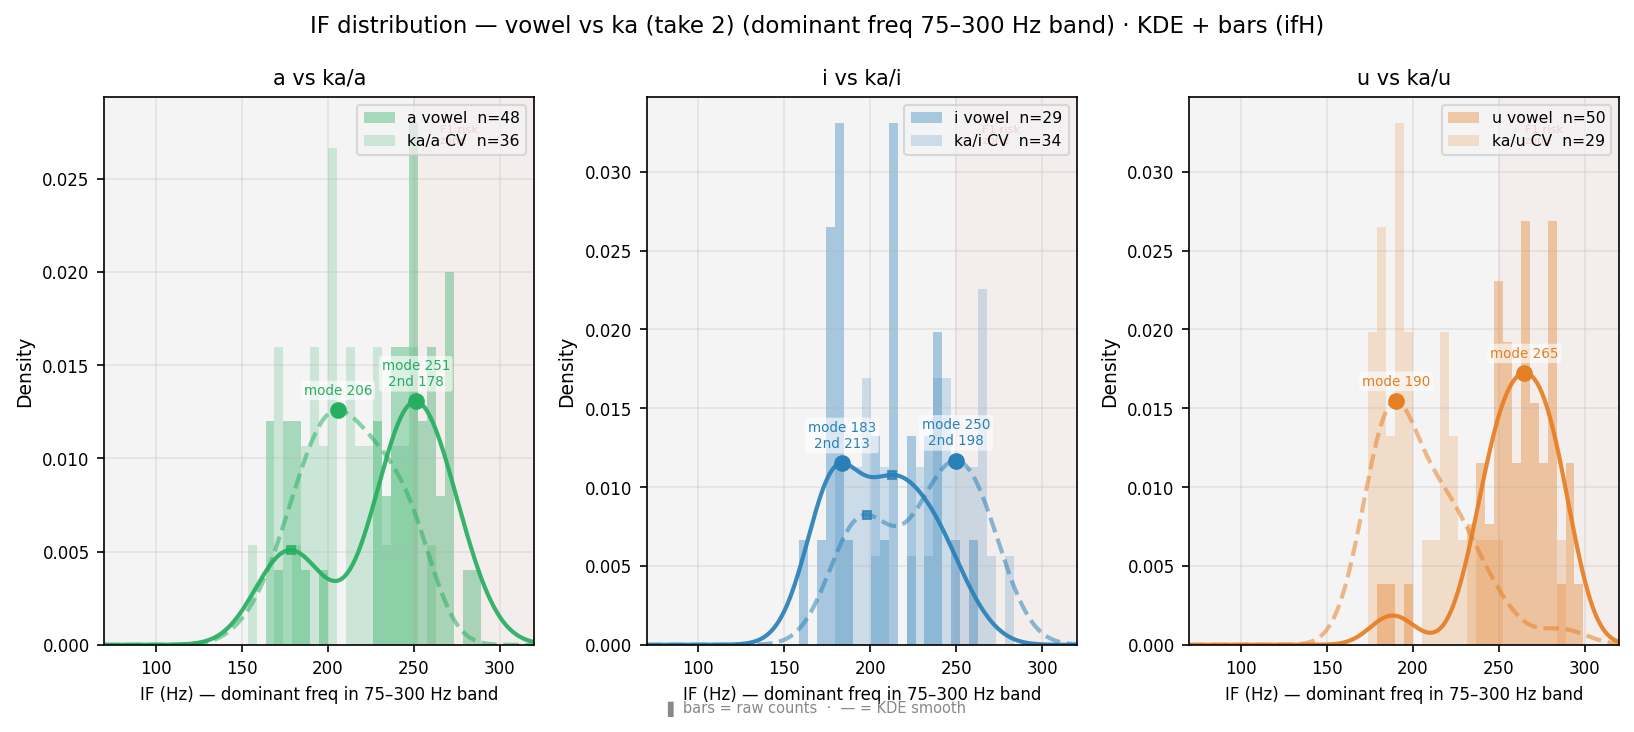
Distribution of instantaneous frequency (Hilbert transform, bandpass 75–300 Hz) at Praat frame rate. For /a/ (F1~800 Hz, outside band): IF tracks F0 — histogram aligns with Praat pitch histogram. For /i/ /u/ (F1~280–300 Hz, inside band): IF may track F1 — red-shaded zone marks this risk. Comparison of vowel vs CV curves shows coarticulation effect on dominant bandpass frequency. ● primary peak · ■ secondary peak.
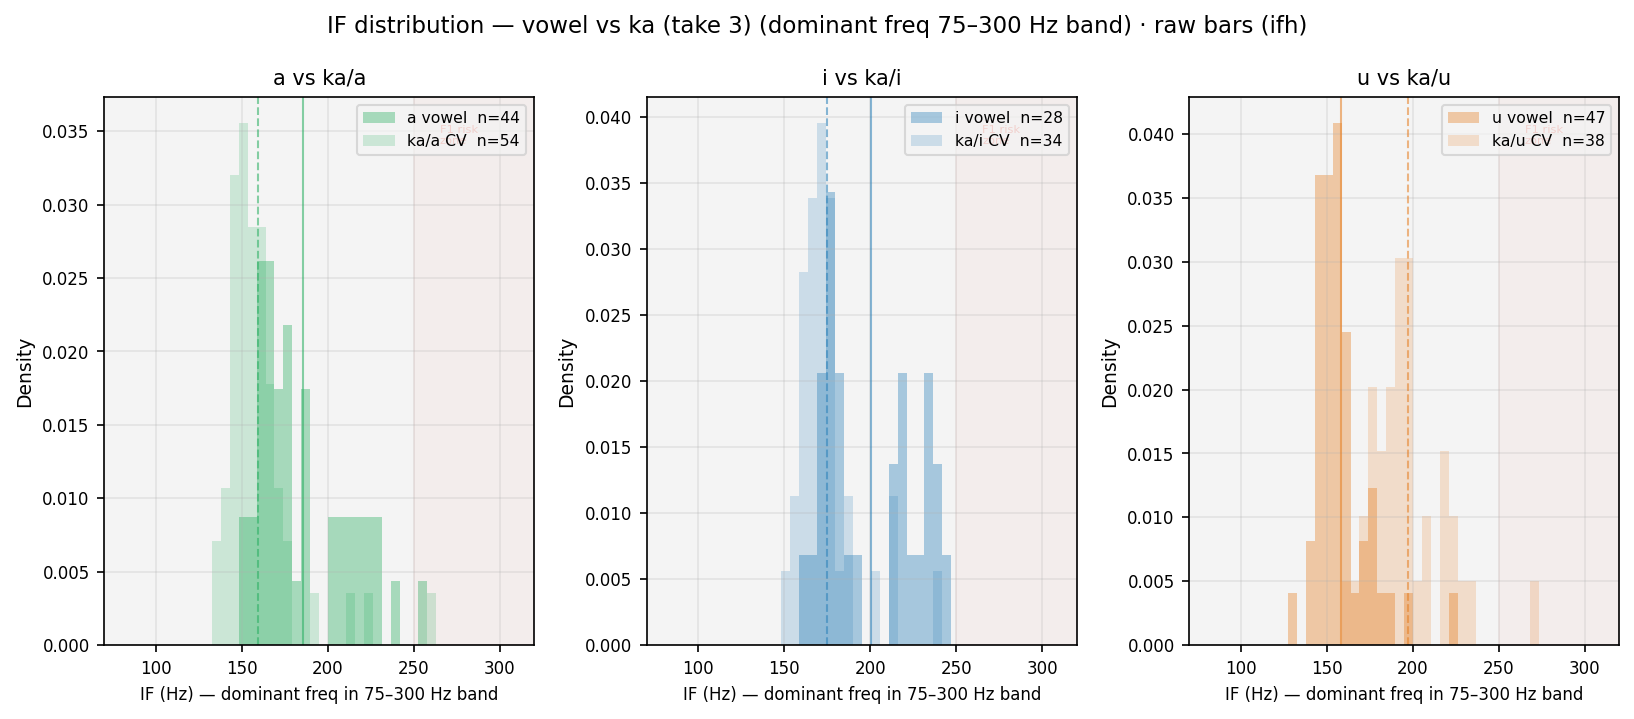
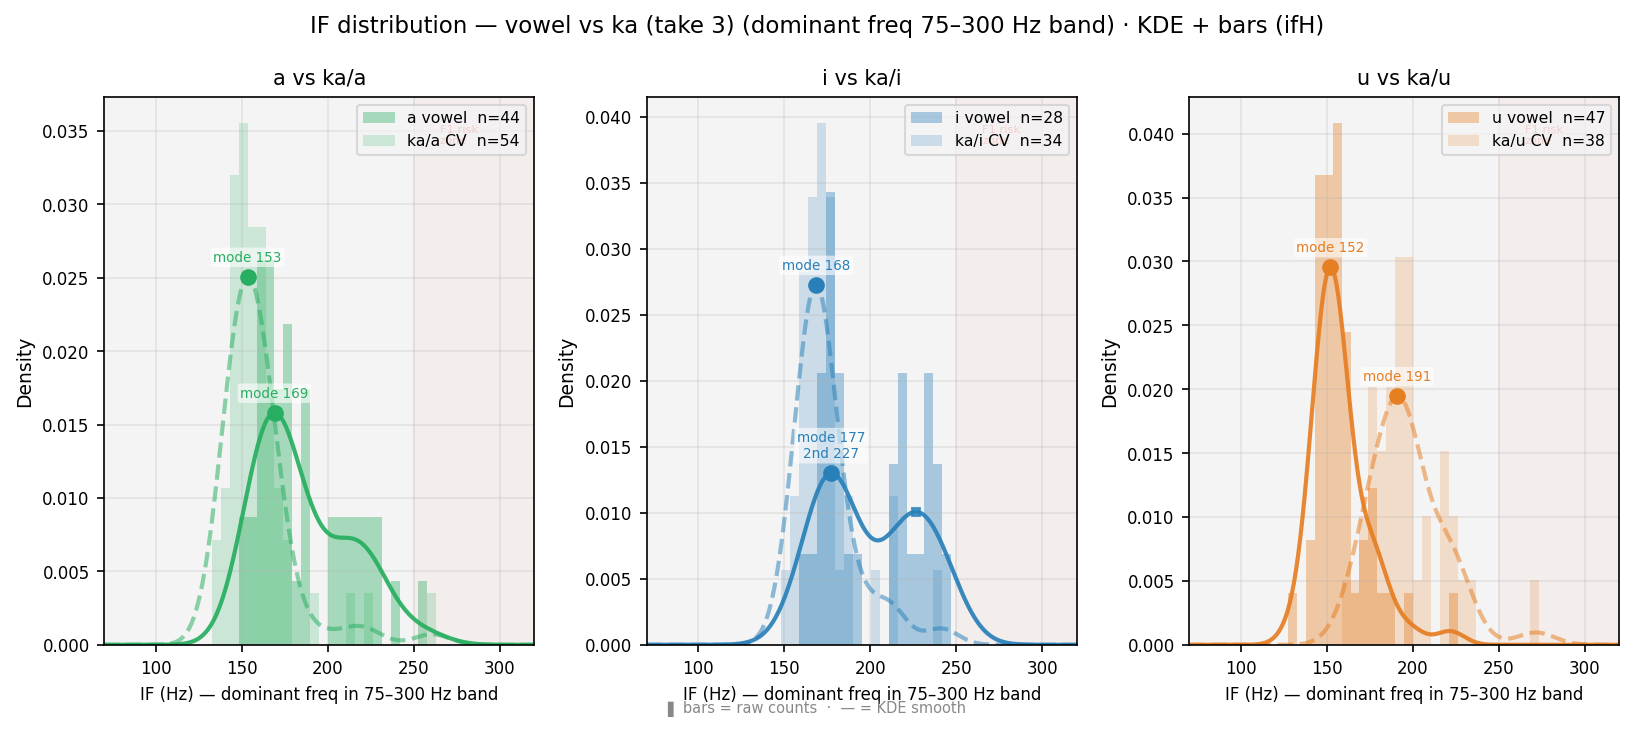
Distribution of instantaneous frequency (Hilbert transform, bandpass 75–300 Hz) at Praat frame rate. For /a/ (F1~800 Hz, outside band): IF tracks F0 — histogram aligns with Praat pitch histogram. For /i/ /u/ (F1~280–300 Hz, inside band): IF may track F1 — red-shaded zone marks this risk. Comparison of vowel vs CV curves shows coarticulation effect on dominant bandpass frequency. ● primary peak · ■ secondary peak.
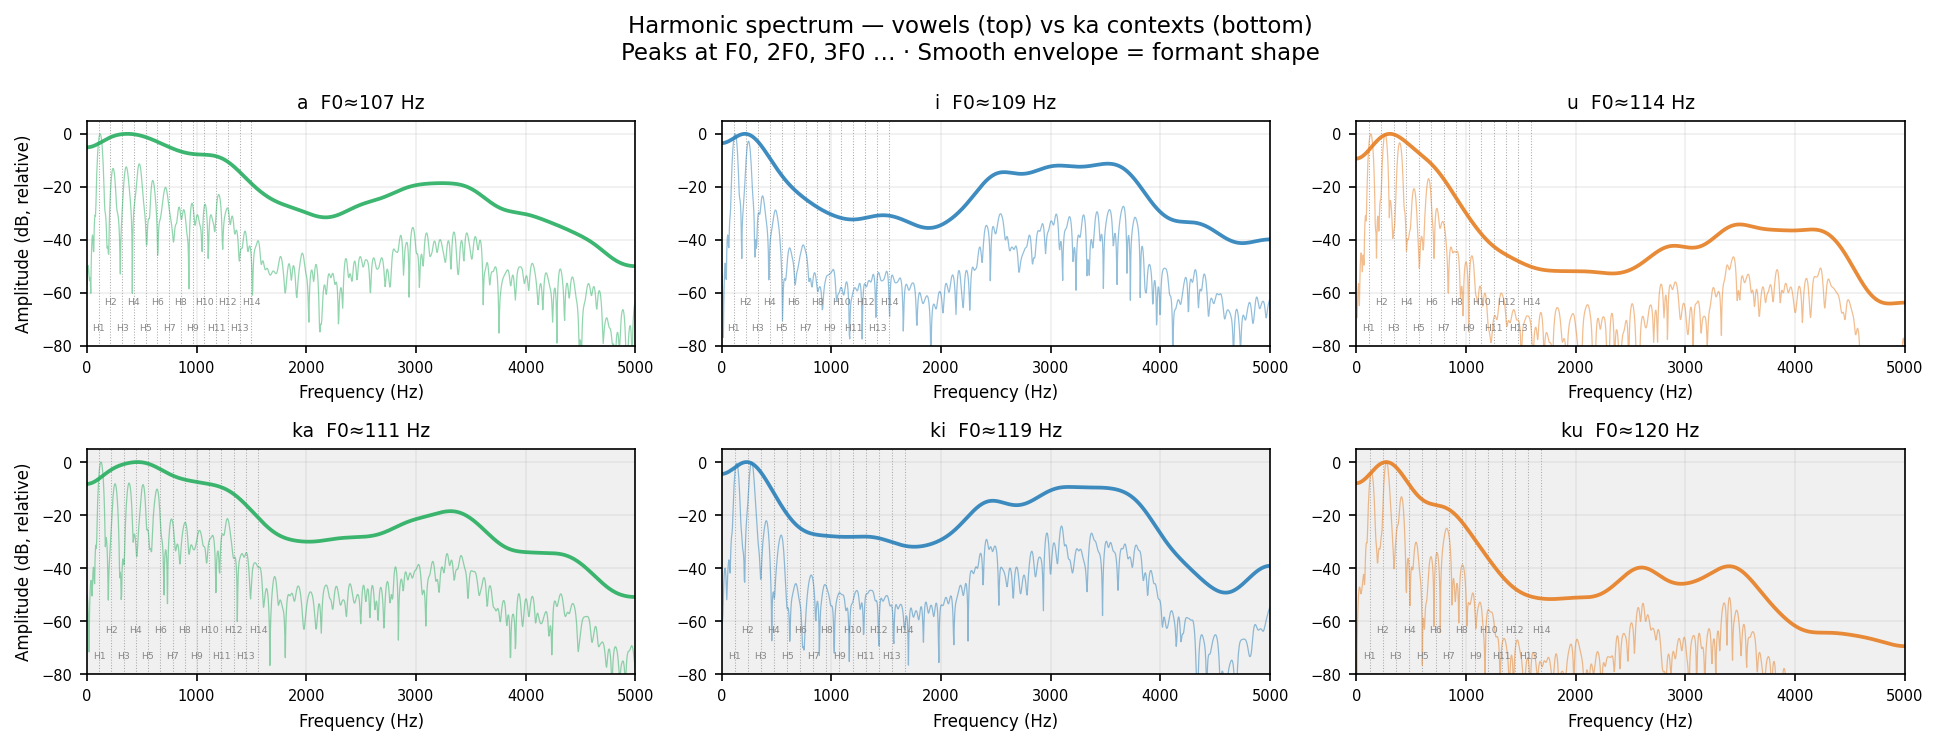
Plain reading: A vowel is a mixture of tones all sounding together. The lowest tone is the fundamental (H1 ≈ F0, ~100 Hz for this voice). The voice also produces tones at exactly 2×, 3×, 4× that frequency — these are harmonics (H2, H3, …). The shape of the mouth amplifies some harmonics more than others; those amplified regions appear as bumps in the smooth envelope — those are the formants (F1 F2 F3). Changing the vowel (अ → इ → उ) reshapes the mouth and shifts the envelope bumps while keeping the comb spacing (F0) the same. Technical: FFT of 50 ms steady-state (20–70 ms after voicing onset). Thin line = raw spectrum · bold line = Gaussian-smoothed spectral envelope (~150 Hz width). Dotted verticals = expected harmonics at n×F0. Y-axis normalised to 0 dB at peak.
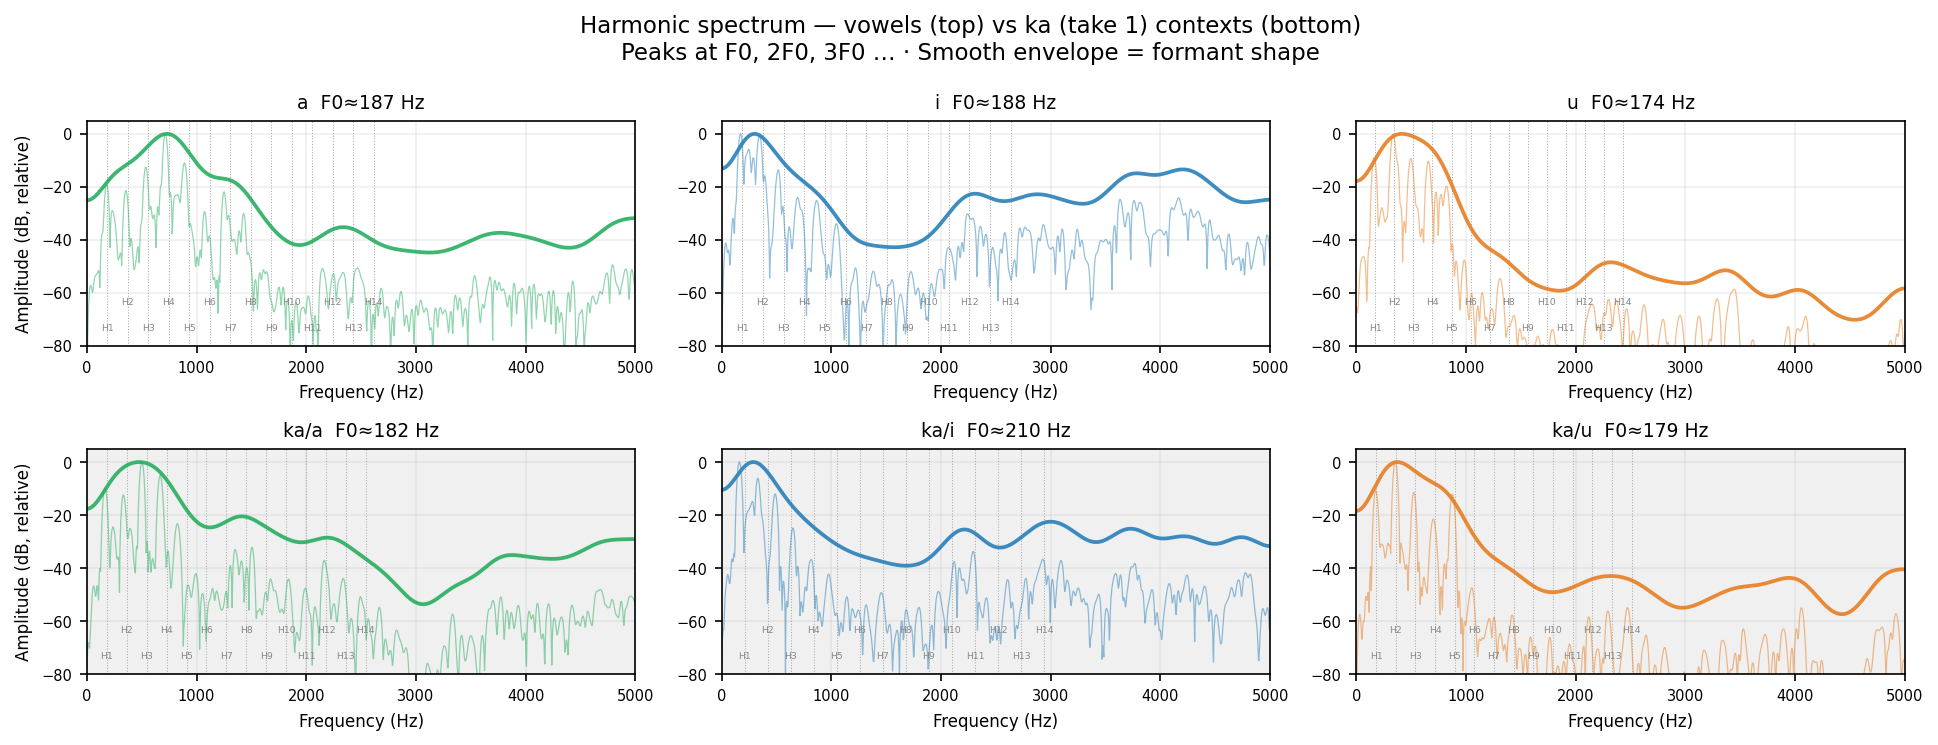
Human take 1
Plain reading: A vowel is a mixture of tones all sounding together. The lowest tone is the fundamental (H1 ≈ F0, ~100 Hz for this voice). The voice also produces tones at exactly 2×, 3×, 4× that frequency — these are harmonics (H2, H3, …). The shape of the mouth amplifies some harmonics more than others; those amplified regions appear as bumps in the smooth envelope — those are the formants (F1 F2 F3). Changing the vowel (अ → इ → उ) reshapes the mouth and shifts the envelope bumps while keeping the comb spacing (F0) the same. Technical: FFT of 50 ms steady-state (20–70 ms after voicing onset). Thin line = raw spectrum · bold line = Gaussian-smoothed spectral envelope (~150 Hz width). Dotted verticals = expected harmonics at n×F0. Y-axis normalised to 0 dB at peak.
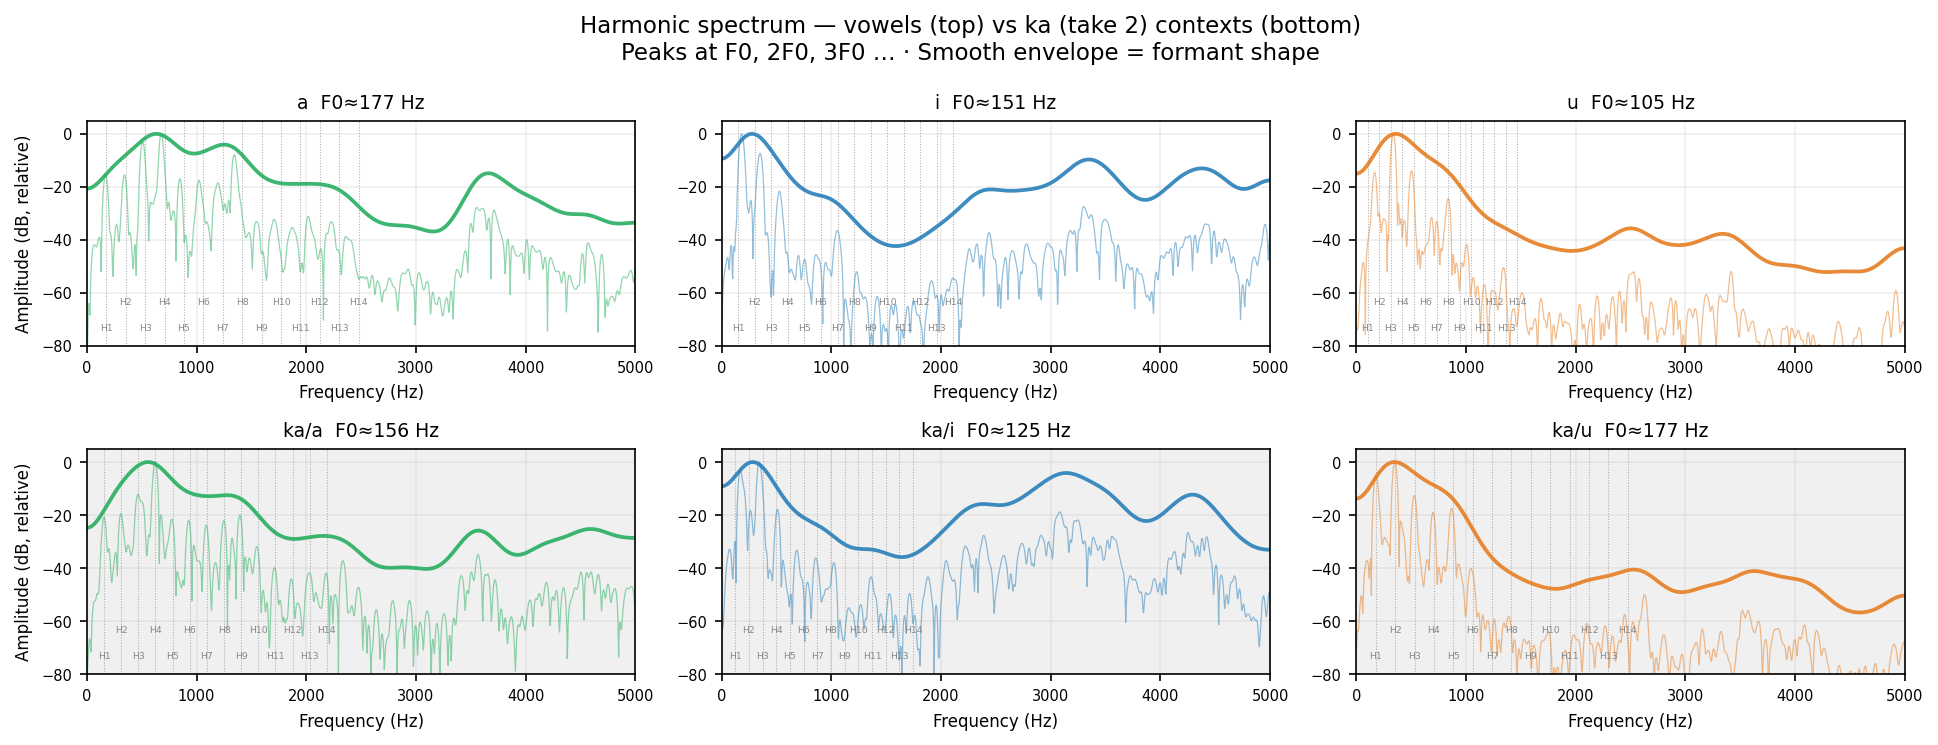
Human take 2
Plain reading: A vowel is a mixture of tones all sounding together. The lowest tone is the fundamental (H1 ≈ F0, ~100 Hz for this voice). The voice also produces tones at exactly 2×, 3×, 4× that frequency — these are harmonics (H2, H3, …). The shape of the mouth amplifies some harmonics more than others; those amplified regions appear as bumps in the smooth envelope — those are the formants (F1 F2 F3). Changing the vowel (अ → इ → उ) reshapes the mouth and shifts the envelope bumps while keeping the comb spacing (F0) the same. Technical: FFT of 50 ms steady-state (20–70 ms after voicing onset). Thin line = raw spectrum · bold line = Gaussian-smoothed spectral envelope (~150 Hz width). Dotted verticals = expected harmonics at n×F0. Y-axis normalised to 0 dB at peak.
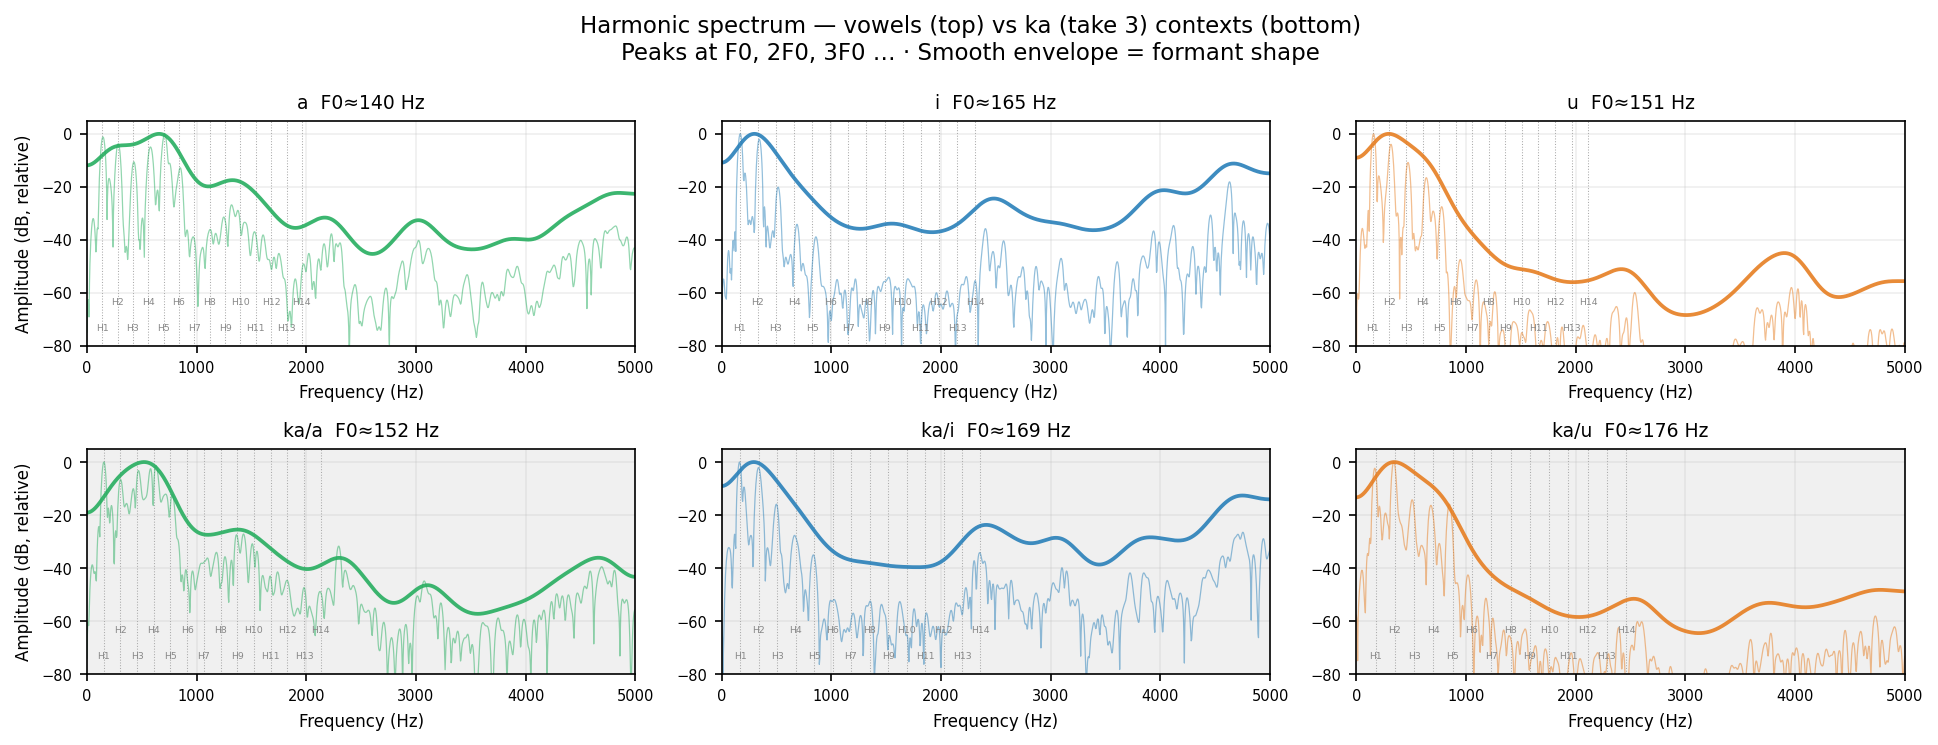
Human take 3
Plain reading: A vowel is a mixture of tones all sounding together. The lowest tone is the fundamental (H1 ≈ F0, ~100 Hz for this voice). The voice also produces tones at exactly 2×, 3×, 4× that frequency — these are harmonics (H2, H3, …). The shape of the mouth amplifies some harmonics more than others; those amplified regions appear as bumps in the smooth envelope — those are the formants (F1 F2 F3). Changing the vowel (अ → इ → उ) reshapes the mouth and shifts the envelope bumps while keeping the comb spacing (F0) the same. Technical: FFT of 50 ms steady-state (20–70 ms after voicing onset). Thin line = raw spectrum · bold line = Gaussian-smoothed spectral envelope (~150 Hz width). Dotted verticals = expected harmonics at n×F0. Y-axis normalised to 0 dB at peak.
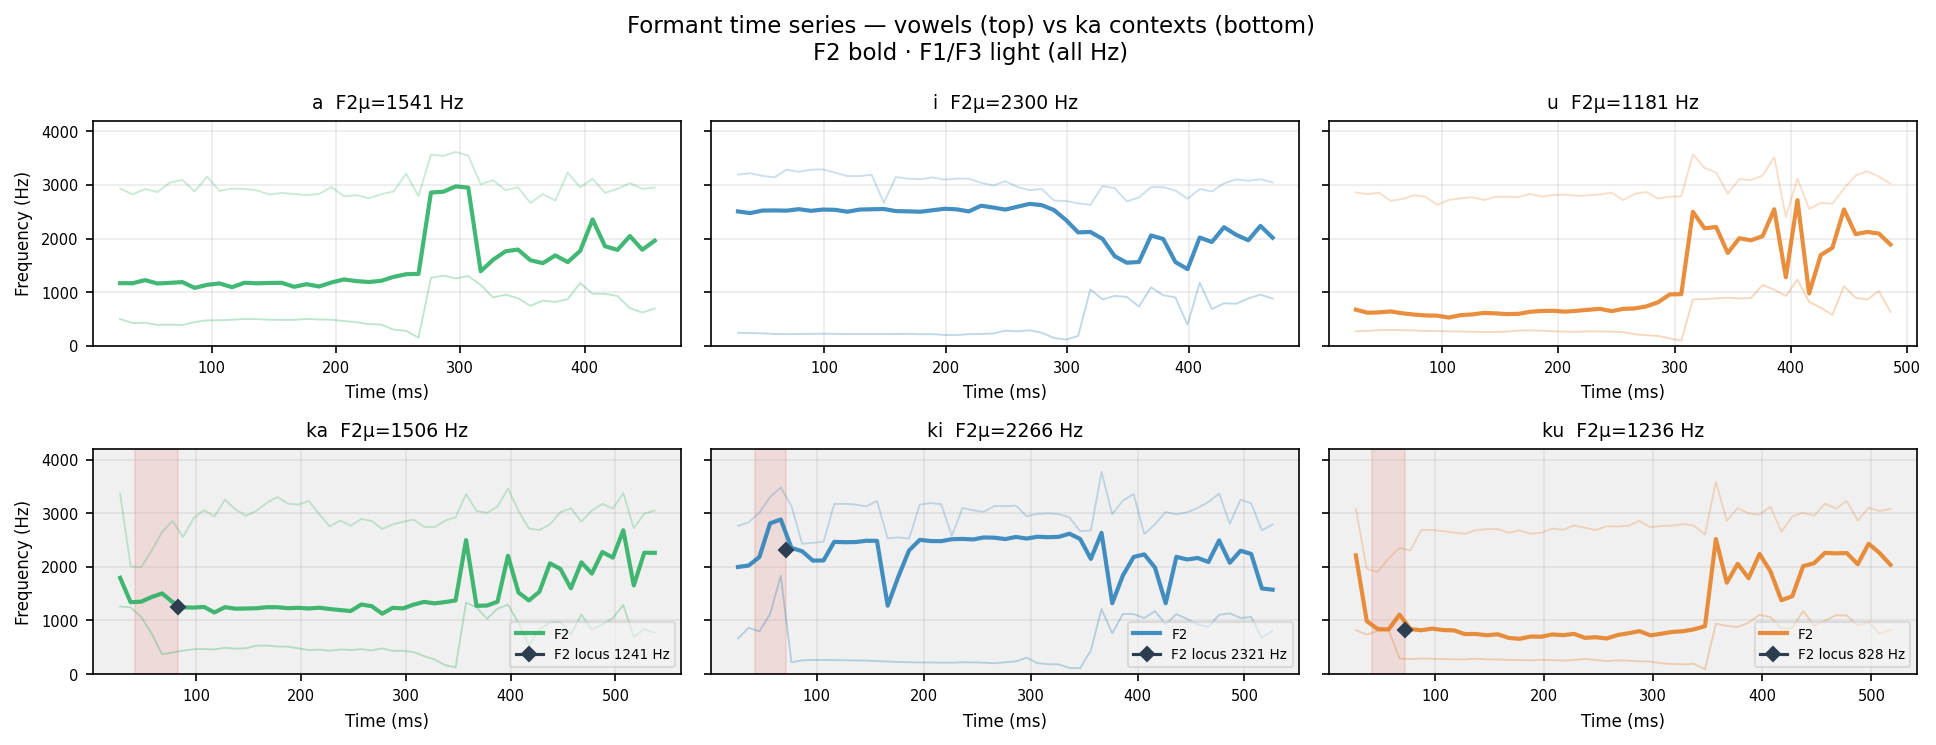
F2 bold · F1/F3 light (alpha). ◆ = F2 locus (F2 at voicing onset = place of articulation marker). Red shade = burst window.
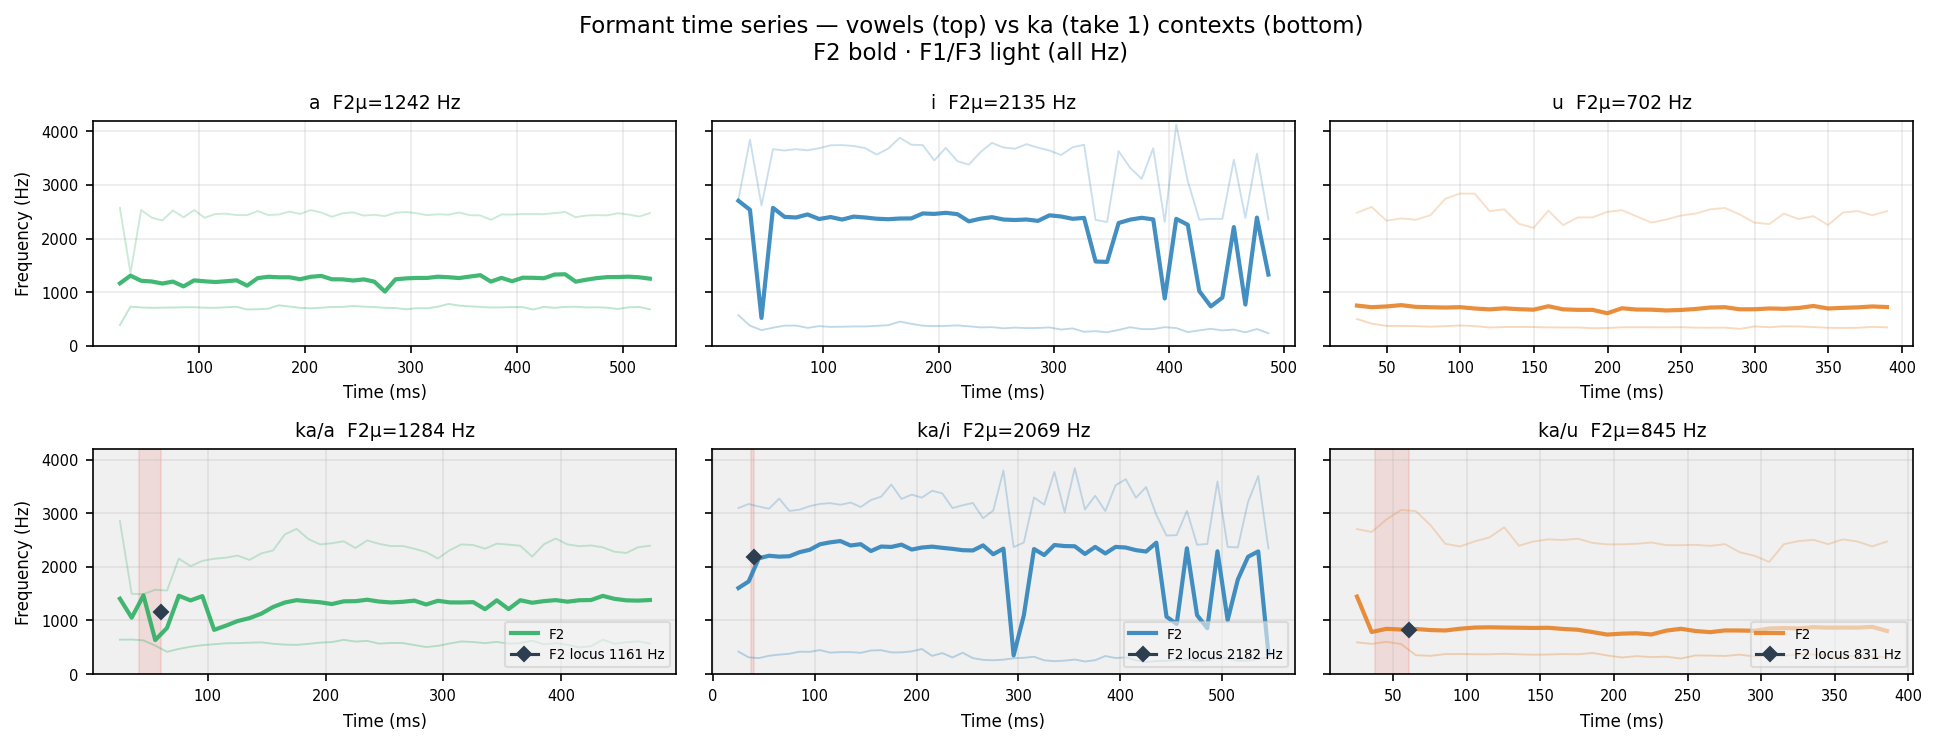
Human take 1
F2 bold · F1/F3 light (alpha). ◆ = F2 locus (F2 at voicing onset = place of articulation marker). Red shade = burst window.
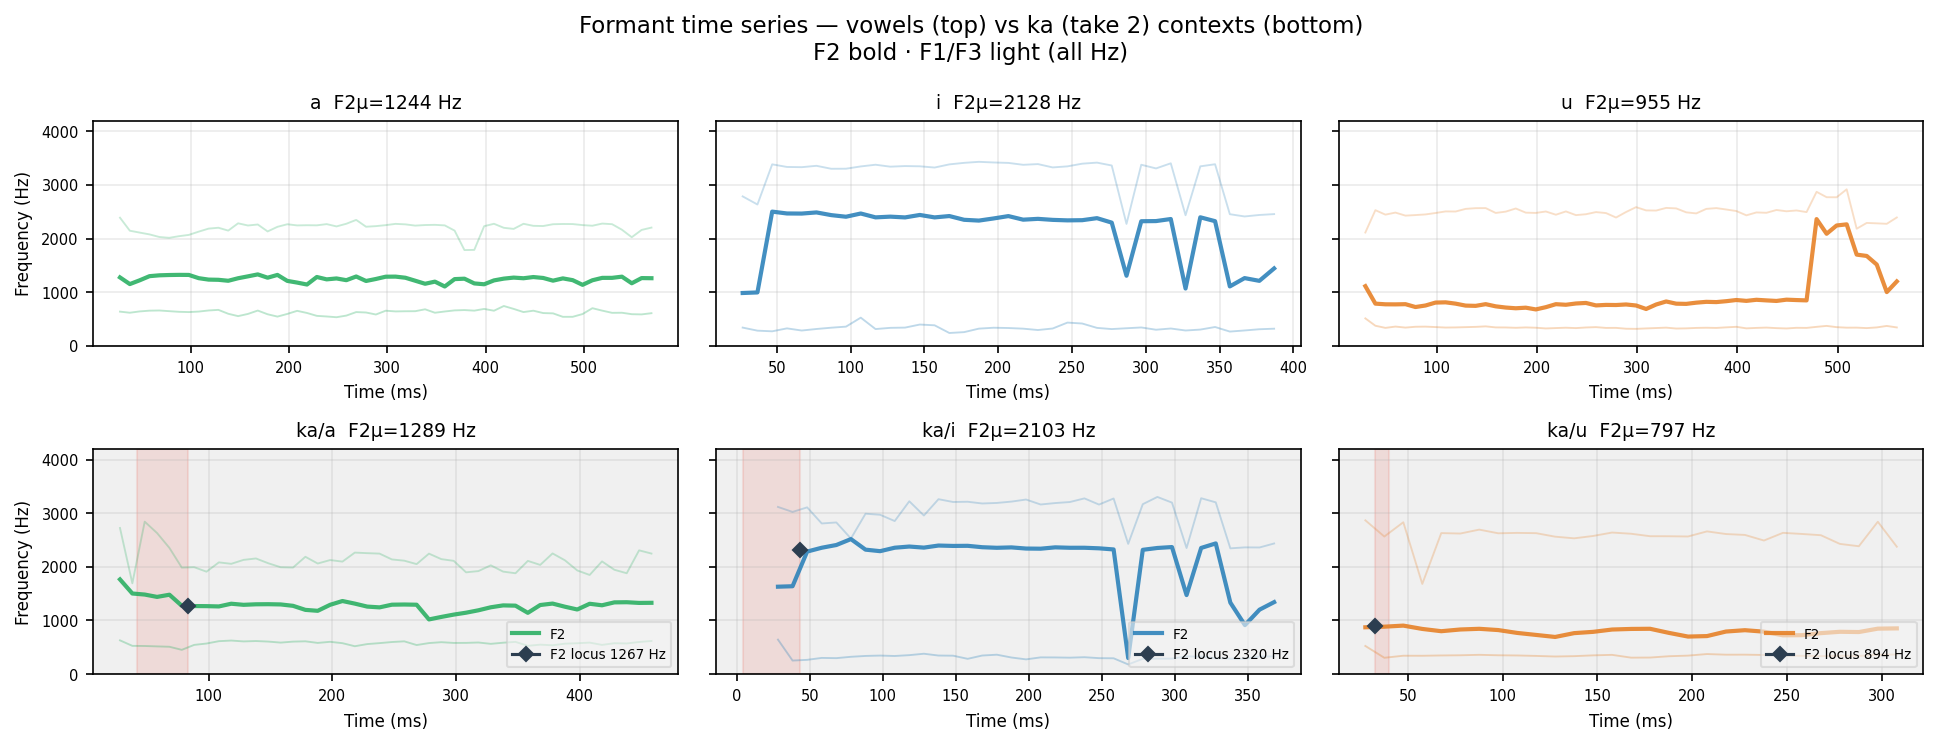
Human take 2
F2 bold · F1/F3 light (alpha). ◆ = F2 locus (F2 at voicing onset = place of articulation marker). Red shade = burst window.
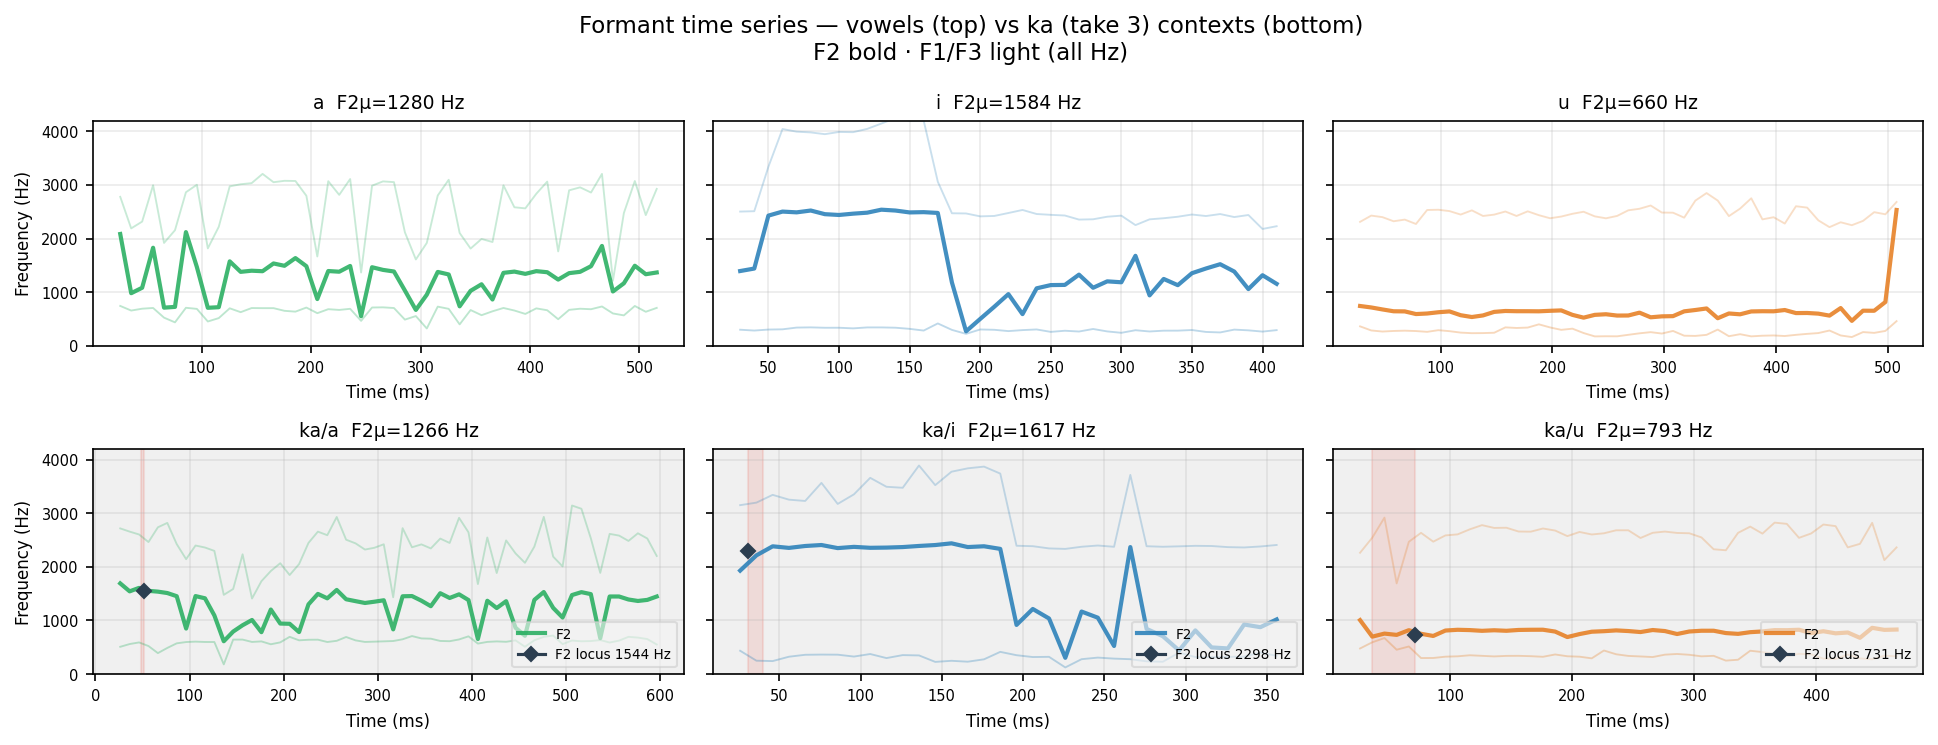
Human take 3
F2 bold · F1/F3 light (alpha). ◆ = F2 locus (F2 at voicing onset = place of articulation marker). Red shade = burst window.
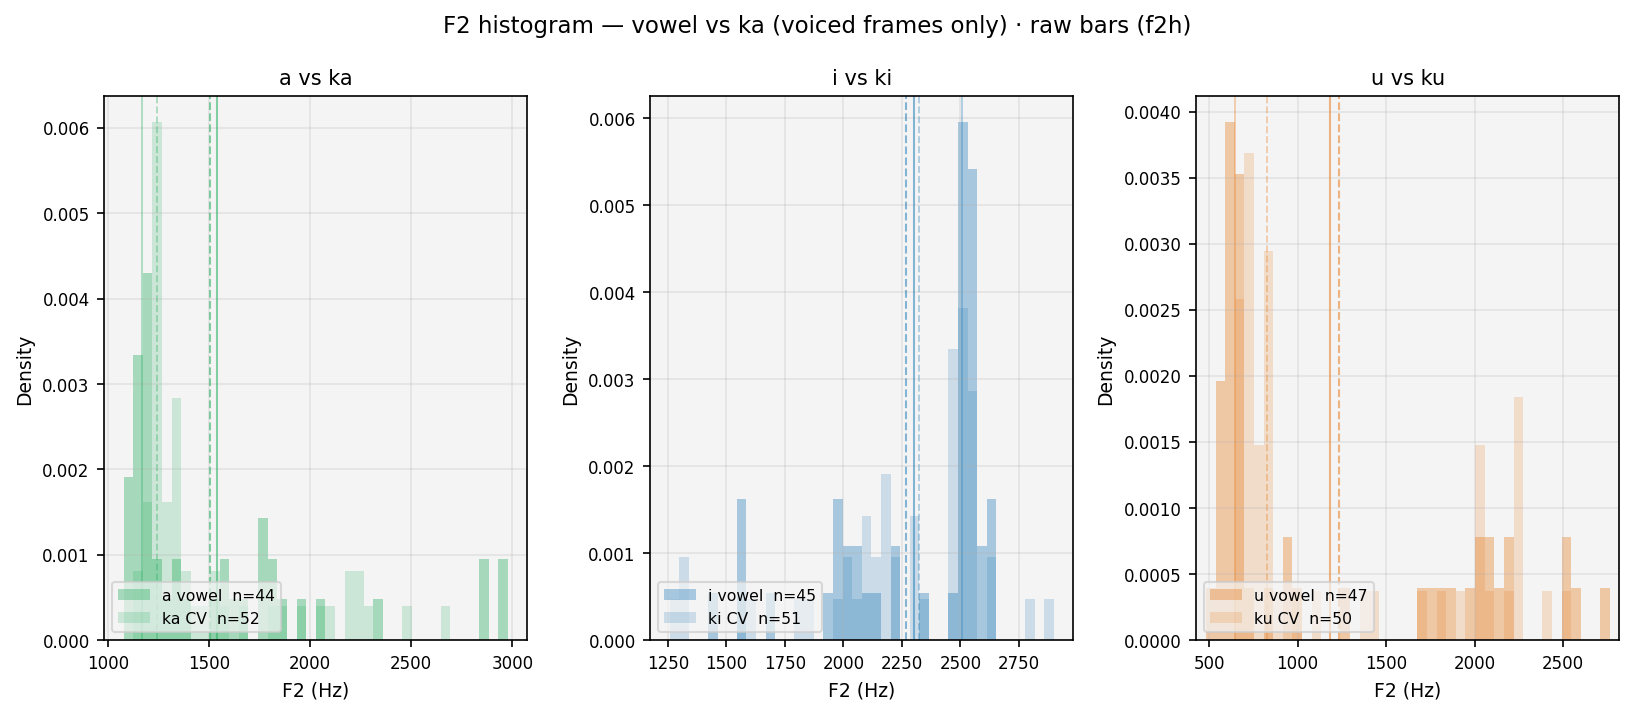
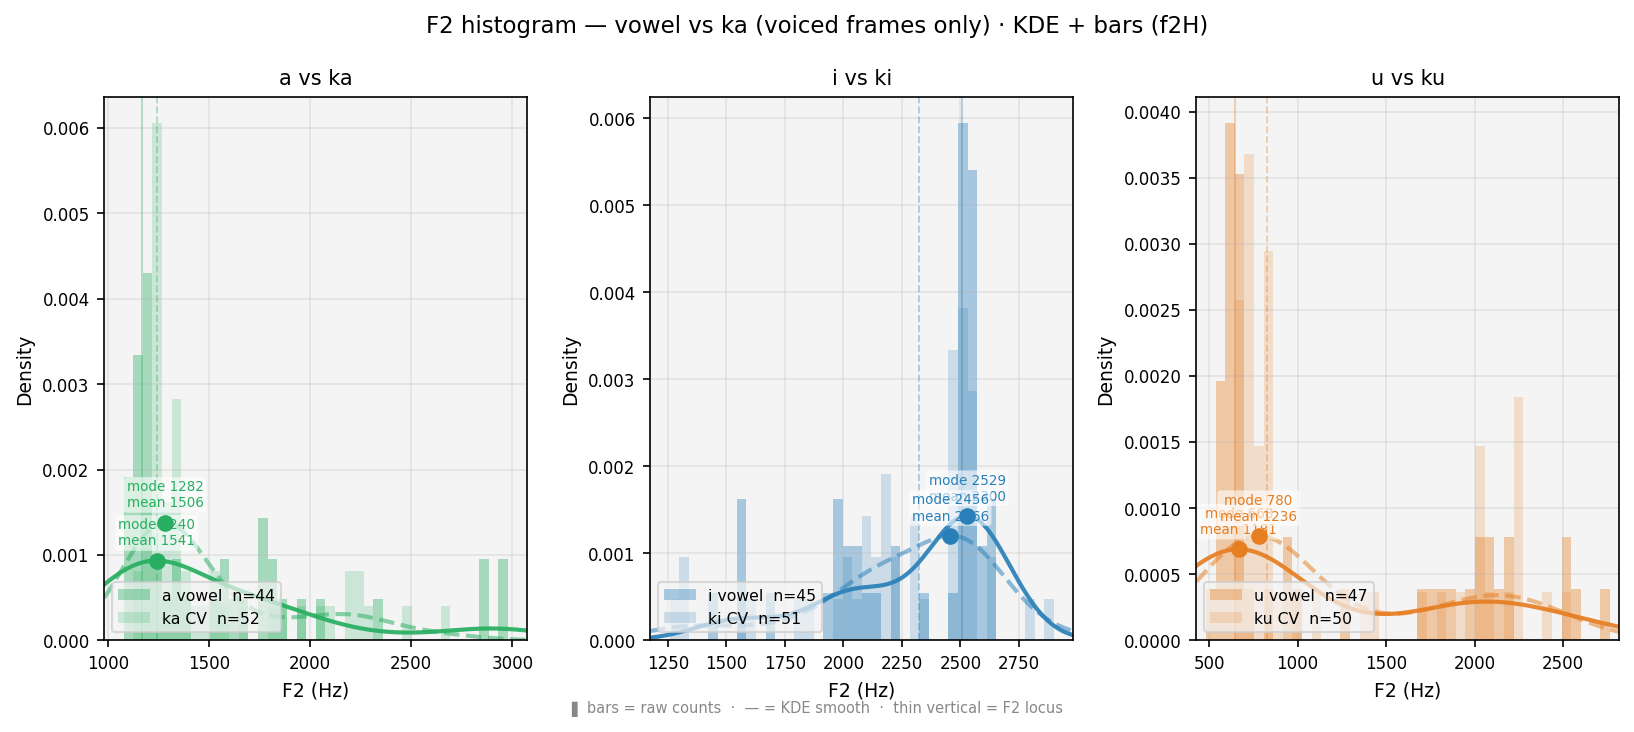
F2 smoothed histogram — vowel (solid) vs CV (dashed). ● = primary peak (mode, most frequent F2). ■ = secondary peak (smaller square). Thin verticals = F2 locus (F2 at voicing onset). Shift between curves = coarticulation. Locus stability across a/i/u contexts characterises the consonant.
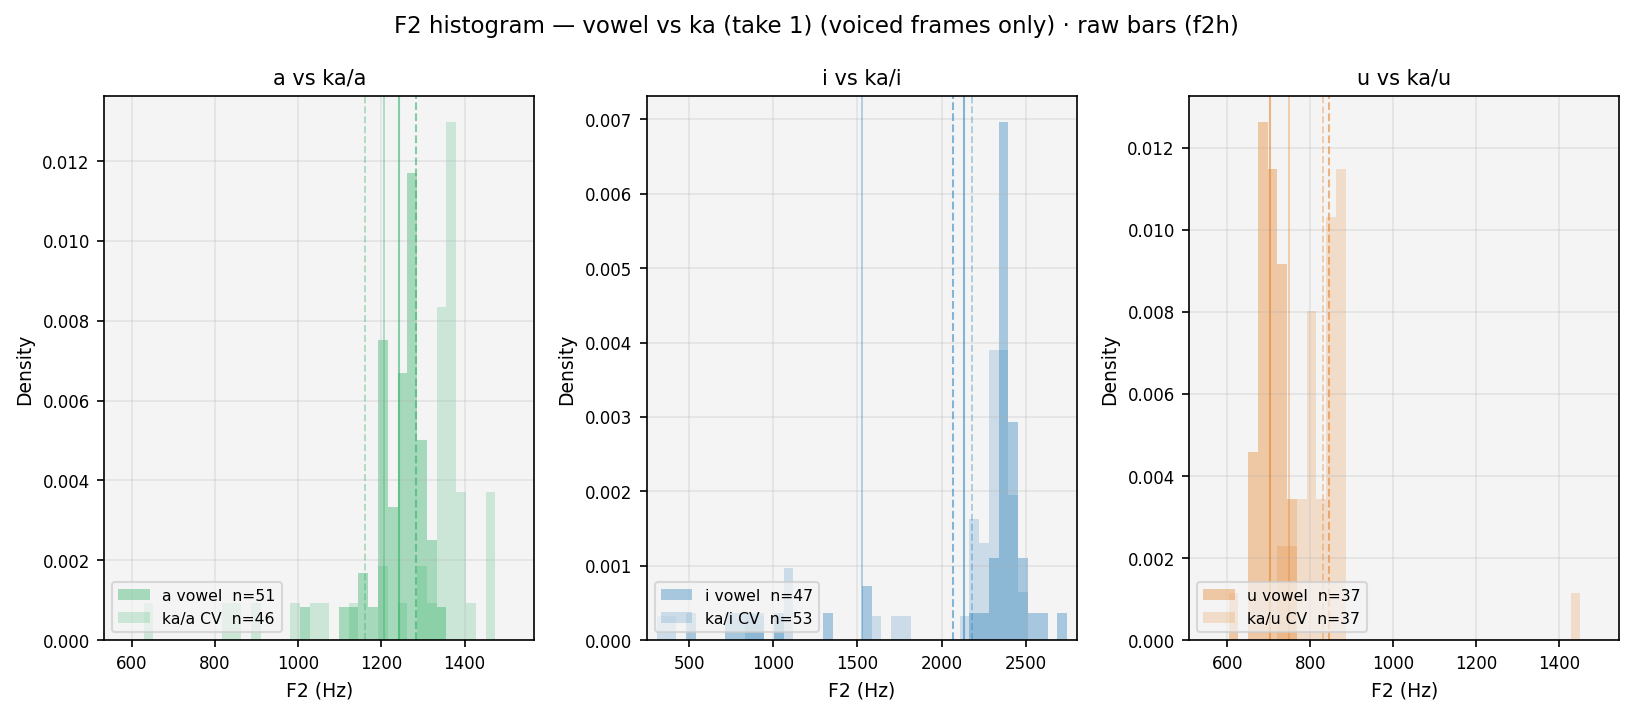
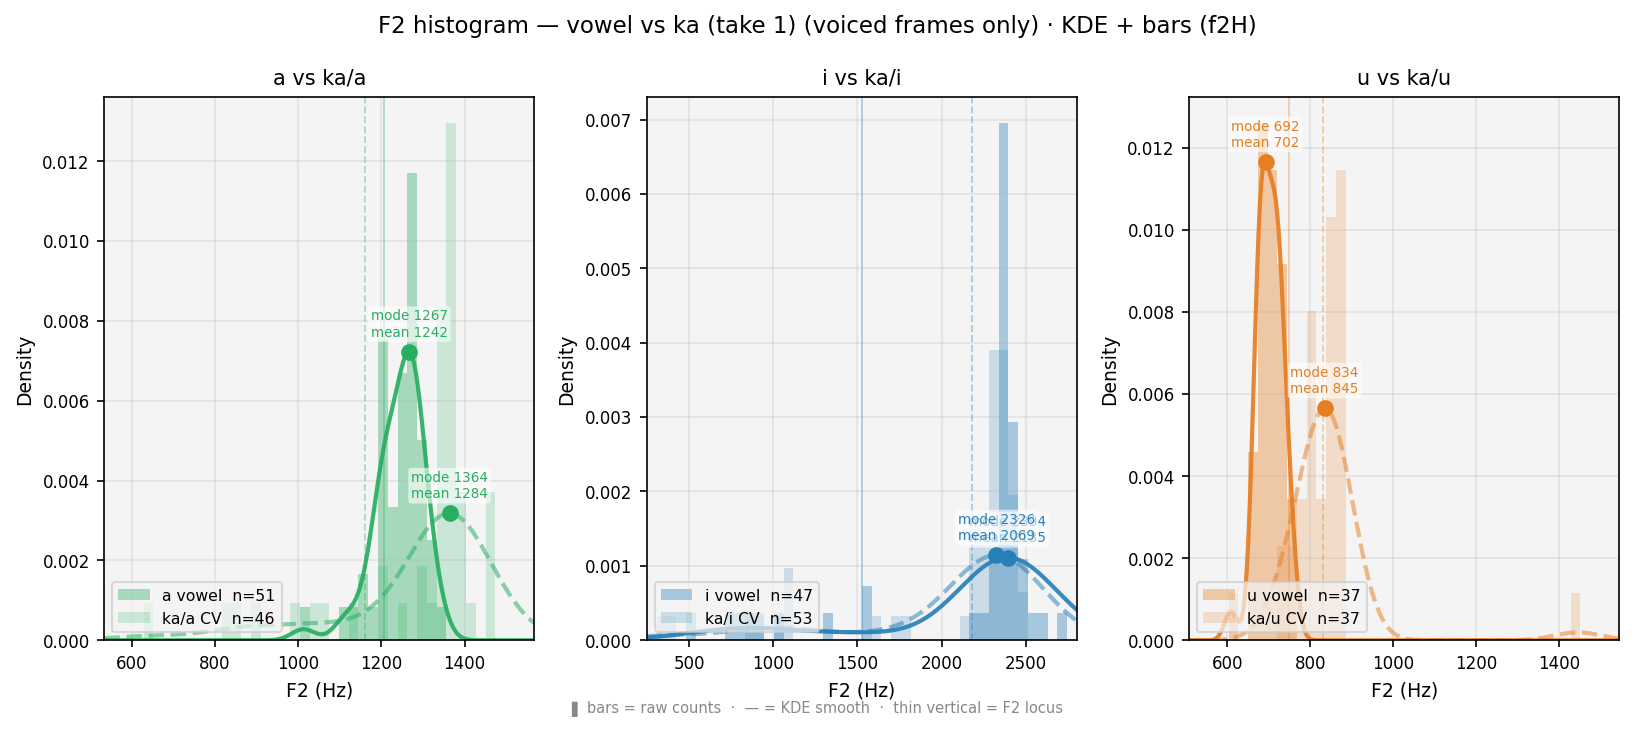
F2 smoothed histogram — vowel (solid) vs CV (dashed). ● = primary peak (mode, most frequent F2). ■ = secondary peak (smaller square). Thin verticals = F2 locus (F2 at voicing onset). Shift between curves = coarticulation. Locus stability across a/i/u contexts characterises the consonant.
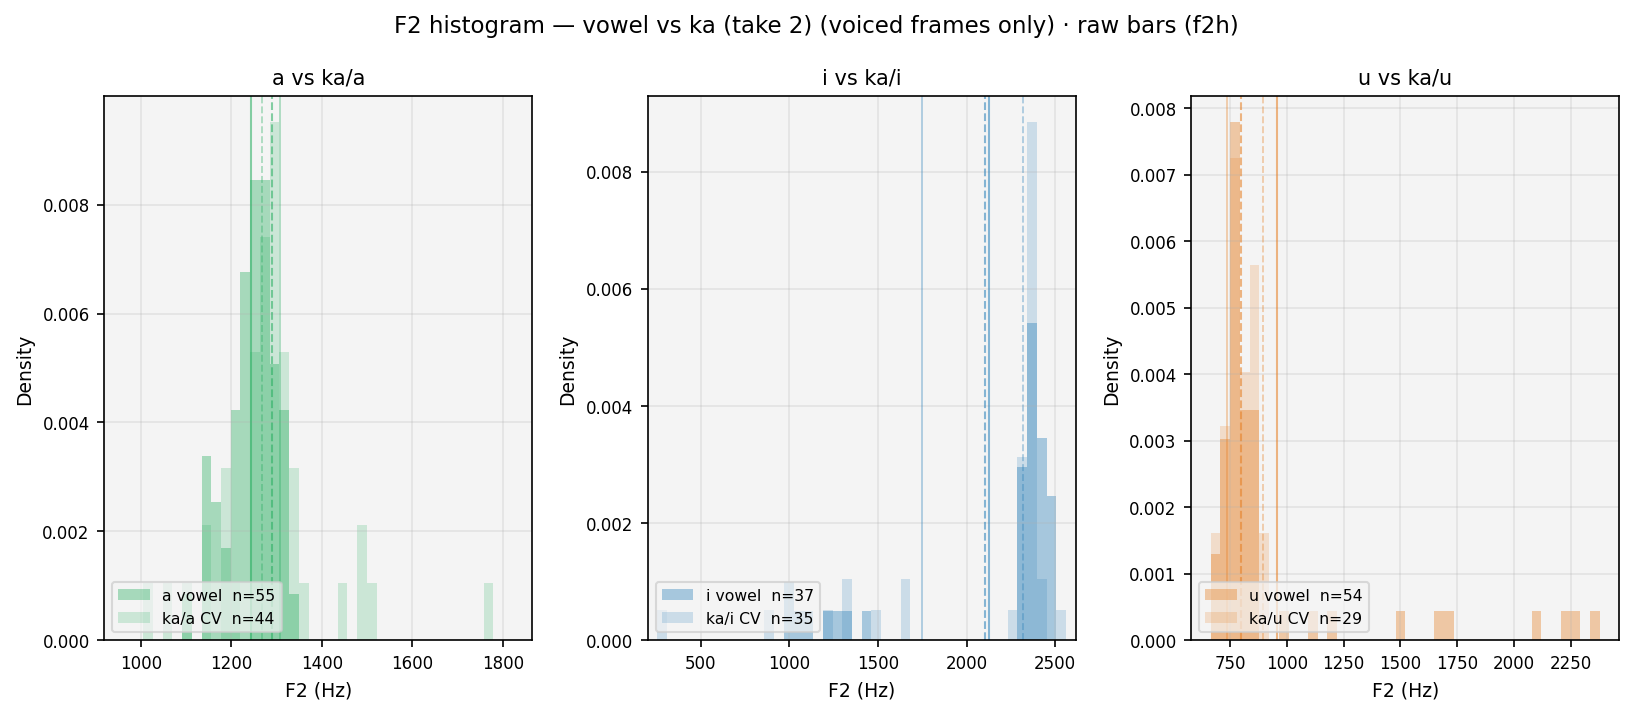
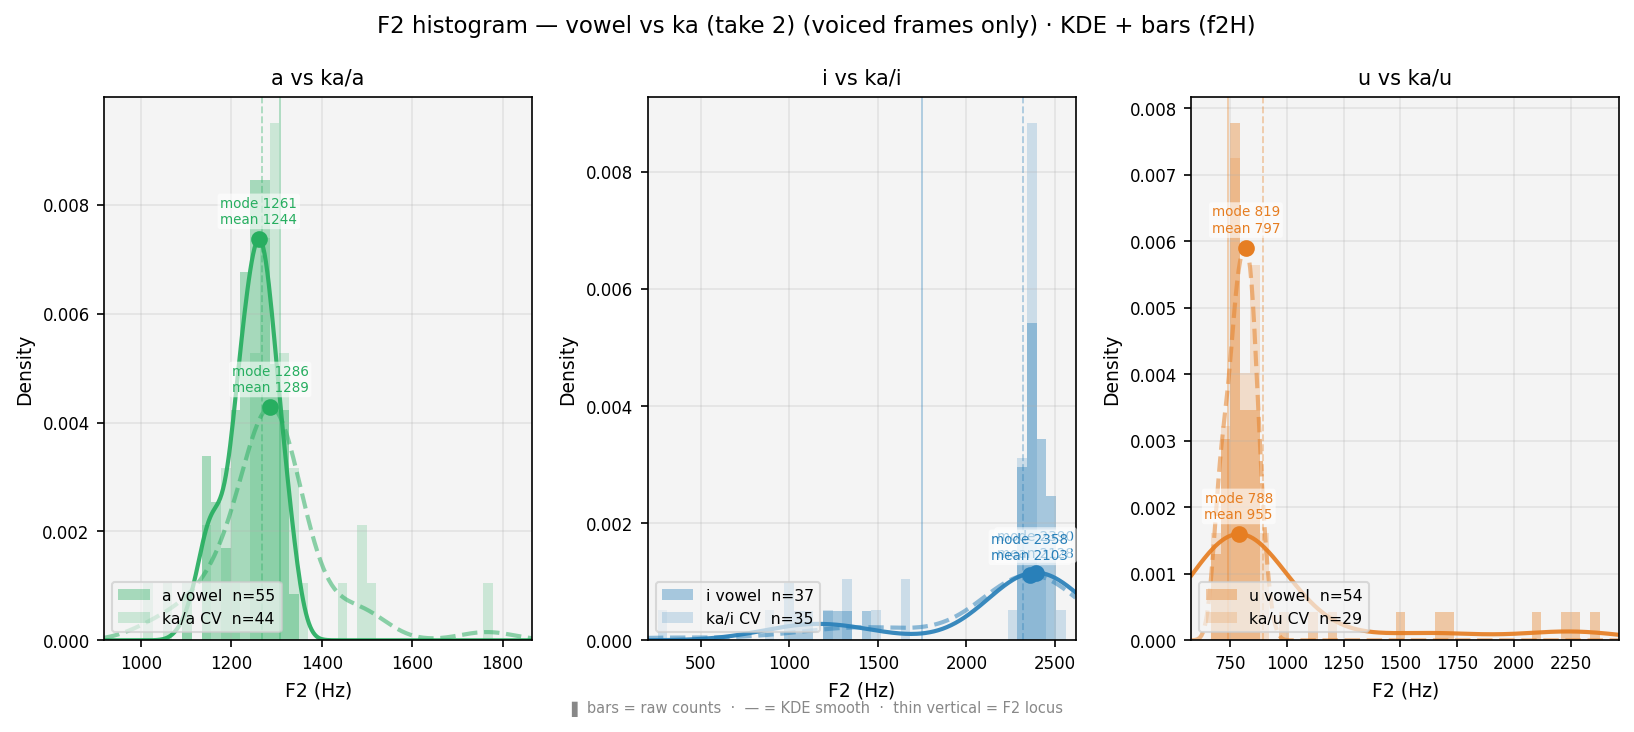
F2 smoothed histogram — vowel (solid) vs CV (dashed). ● = primary peak (mode, most frequent F2). ■ = secondary peak (smaller square). Thin verticals = F2 locus (F2 at voicing onset). Shift between curves = coarticulation. Locus stability across a/i/u contexts characterises the consonant.
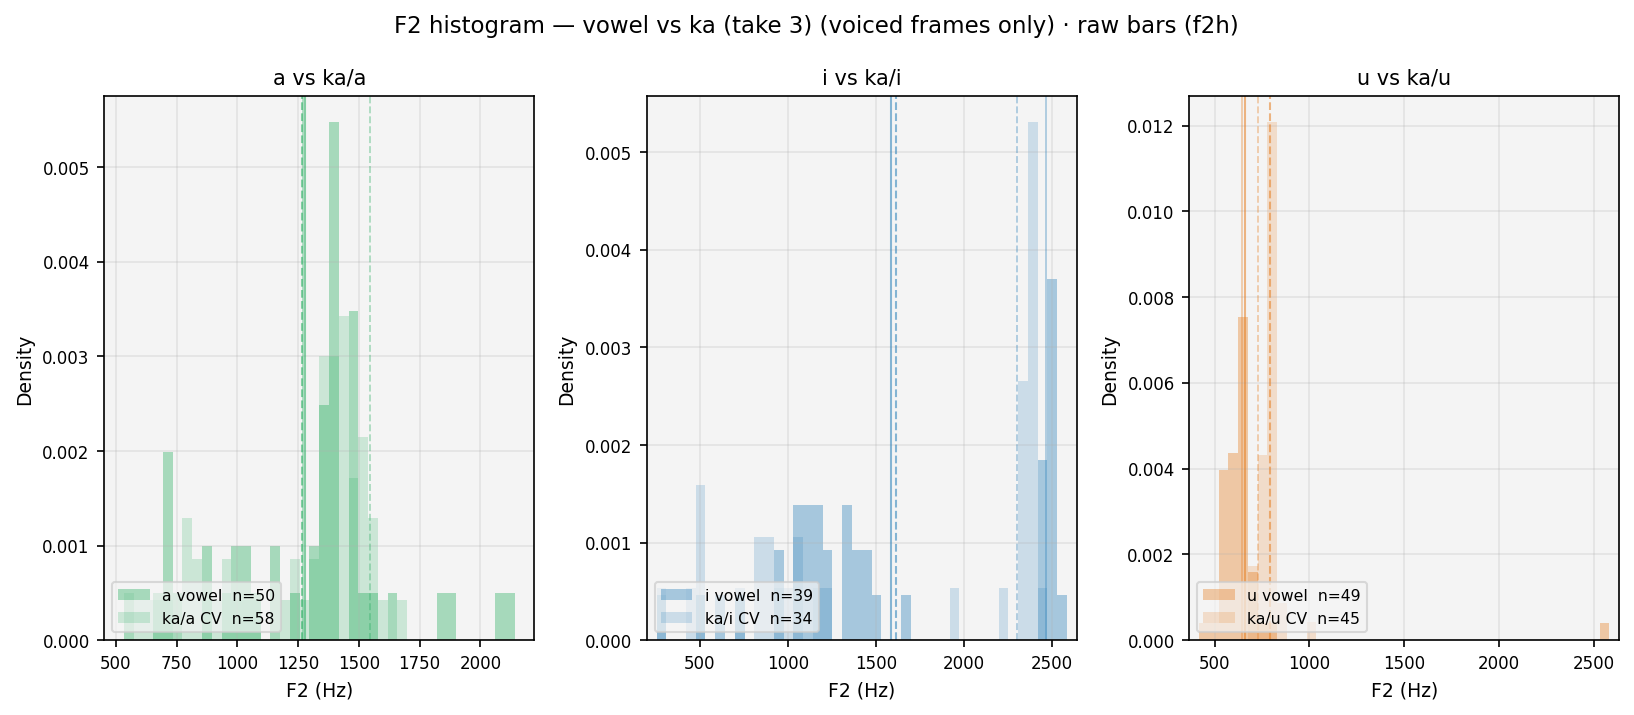
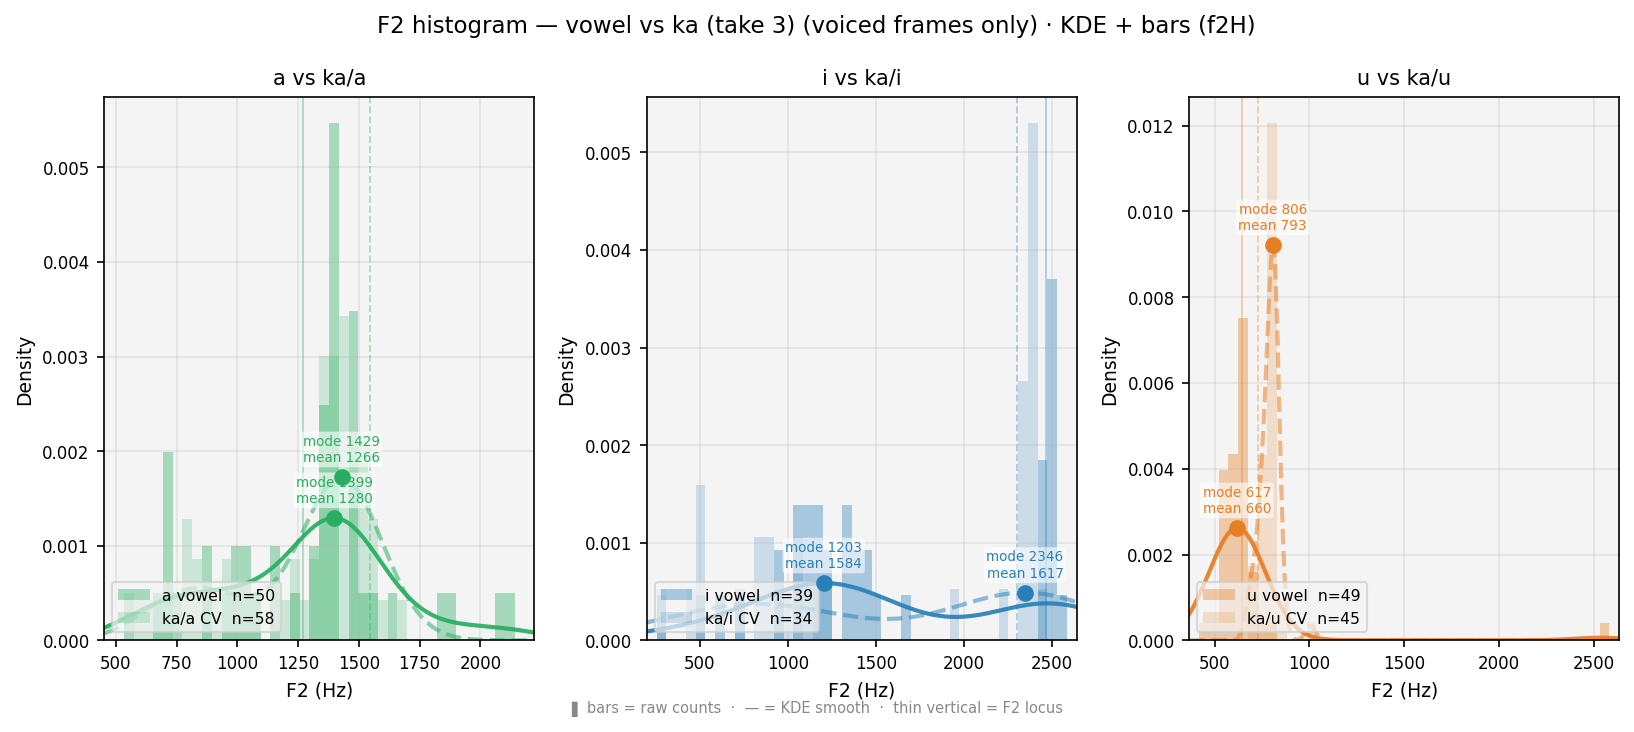
F2 smoothed histogram — vowel (solid) vs CV (dashed). ● = primary peak (mode, most frequent F2). ■ = secondary peak (smaller square). Thin verticals = F2 locus (F2 at voicing onset). Shift between curves = coarticulation. Locus stability across a/i/u contexts characterises the consonant.
| Metric — kȧ (Velar) | a context | i context | u context | mean ± σ (क् estimate) |
|---|---|---|---|---|
| Pitch gap / burst (ms) | 41 | 29 | 31 | 33 ±5 |
| Pitch/F0 primary peak (Hz) | 96 | 135 | 134 | 122 ±18 |
| Pitch/F0 secondary peak (Hz) | 128 | 103 | — | 115 ±12 |
| ΔF0 secondary−primary (Hz) | 32 | -32 | — | -0 ±32 |
| F2 locus at voicing onset (Hz) | 1241 | 2321 | 828 | 1464 ±630 |
| F2 steady-state / vowel (Hz) | 1816 | 2125 | 1809 | 1917 ±148 |
| Reference vowels — no consonant onset: | ||||
| a (pure vowel) | Pitch/F0 mean 107 Hz · F2 locus 1169 Hz · F2 steady 1946 Hz | — | ||
| i (pure vowel) | Pitch/F0 mean 109 Hz · F2 locus 2506 Hz · F2 steady 2058 Hz | — | ||
| u (pure vowel) | Pitch/F0 mean 114 Hz · F2 locus 647 Hz · F2 steady 1814 Hz | — | ||
| Metric — kȧ (Velar) | a context | i context | u context | mean ± σ (क् estimate) |
|---|---|---|---|---|
| Pitch gap / burst (ms) | 18 | 2 | 22 | 14 ±9 |
| Pitch/F0 primary peak (Hz) | 171 | 233 | 177 | 193 ±28 |
| Pitch/F0 secondary peak (Hz) | 240 | 168 | — | 204 ±36 |
| ΔF0 secondary−primary (Hz) | 69 | -65 | — | 2 ±67 |
| F2 locus at voicing onset (Hz) | 1161 | 2182 | 831 | 1391 ±575 |
| F2 steady-state / vowel (Hz) | 1351 | 1941 | 839 | 1377 ±450 |
| Reference vowels — no consonant onset: | ||||
| a (pure vowel) | Pitch/F0 mean 187 Hz · F2 locus 1207 Hz · F2 steady 1270 Hz | — | ||
| i (pure vowel) | Pitch/F0 mean 188 Hz · F2 locus 1529 Hz · F2 steady 1895 Hz | — | ||
| u (pure vowel) | Pitch/F0 mean 174 Hz · F2 locus 748 Hz · F2 steady 703 Hz | — | ||
| Metric — kȧ (Velar) | a context | i context | u context | mean ± σ (क् estimate) |
|---|---|---|---|---|
| Pitch gap / burst (ms) | 41 | 39 | 0 | 27 ±19 |
| Pitch/F0 primary peak (Hz) | 155 | 88 | 175 | 139 ±37 |
| Pitch/F0 secondary peak (Hz) | — | 175 | — | 175 |
| ΔF0 secondary−primary (Hz) | — | 87 | — | 87 |
| F2 locus at voicing onset (Hz) | 1267 | 2320 | 894 | 1494 ±604 |
| F2 steady-state / vowel (Hz) | 1247 | 1851 | 774 | 1290 ±441 |
| Reference vowels — no consonant onset: | ||||
| a (pure vowel) | Pitch/F0 mean 177 Hz · F2 locus 1308 Hz · F2 steady 1225 Hz | — | ||
| i (pure vowel) | Pitch/F0 mean 151 Hz · F2 locus 1750 Hz · F2 steady 1954 Hz | — | ||
| u (pure vowel) | Pitch/F0 mean 105 Hz · F2 locus 739 Hz · F2 steady 1205 Hz | — | ||
| Metric — kȧ (Velar) | a context | i context | u context | mean ± σ (क् estimate) |
|---|---|---|---|---|
| Pitch gap / burst (ms) | 3 | 0 | 35 | 13 ±16 |
| Pitch/F0 primary peak (Hz) | 148 | 164 | 170 | 161 ±9 |
| Pitch/F0 secondary peak (Hz) | — | — | — | — |
| ΔF0 secondary−primary (Hz) | — | — | — | — |
| F2 locus at voicing onset (Hz) | 1544 | 2298 | 731 | 1524 ±640 |
| F2 steady-state / vowel (Hz) | 1287 | 870 | 790 | 982 ±218 |
| Reference vowels — no consonant onset: | ||||
| a (pure vowel) | Pitch/F0 mean 140 Hz · F2 locus 1271 Hz · F2 steady 1273 Hz | — | ||
| i (pure vowel) | Pitch/F0 mean 165 Hz · F2 locus 2466 Hz · F2 steady 1254 Hz | — | ||
| u (pure vowel) | Pitch/F0 mean 151 Hz · F2 locus 644 Hz · F2 steady 711 Hz | — | ||
च ca · Palatal · Talavya ⠿ drag sections to reorder · 👁 toggle visibility
| TTS — Wavenet-B | |||
|---|---|---|---|
| Vowel | a | i | u |
| CV | ca | ci | cu |
| Human — take 1 | |||
|---|---|---|---|
| Vowel | a | i | u |
| CV | ca/a | ca/i | ca/u |
| Human — take 2 | |||
|---|---|---|---|
| Vowel | a | i | u |
| CV | ca/a | ca/i | ca/u |
| Human — take 3 | |||
|---|---|---|---|
| Vowel | a | i | u |
| CV | ca/a | ca/i | ca/u |
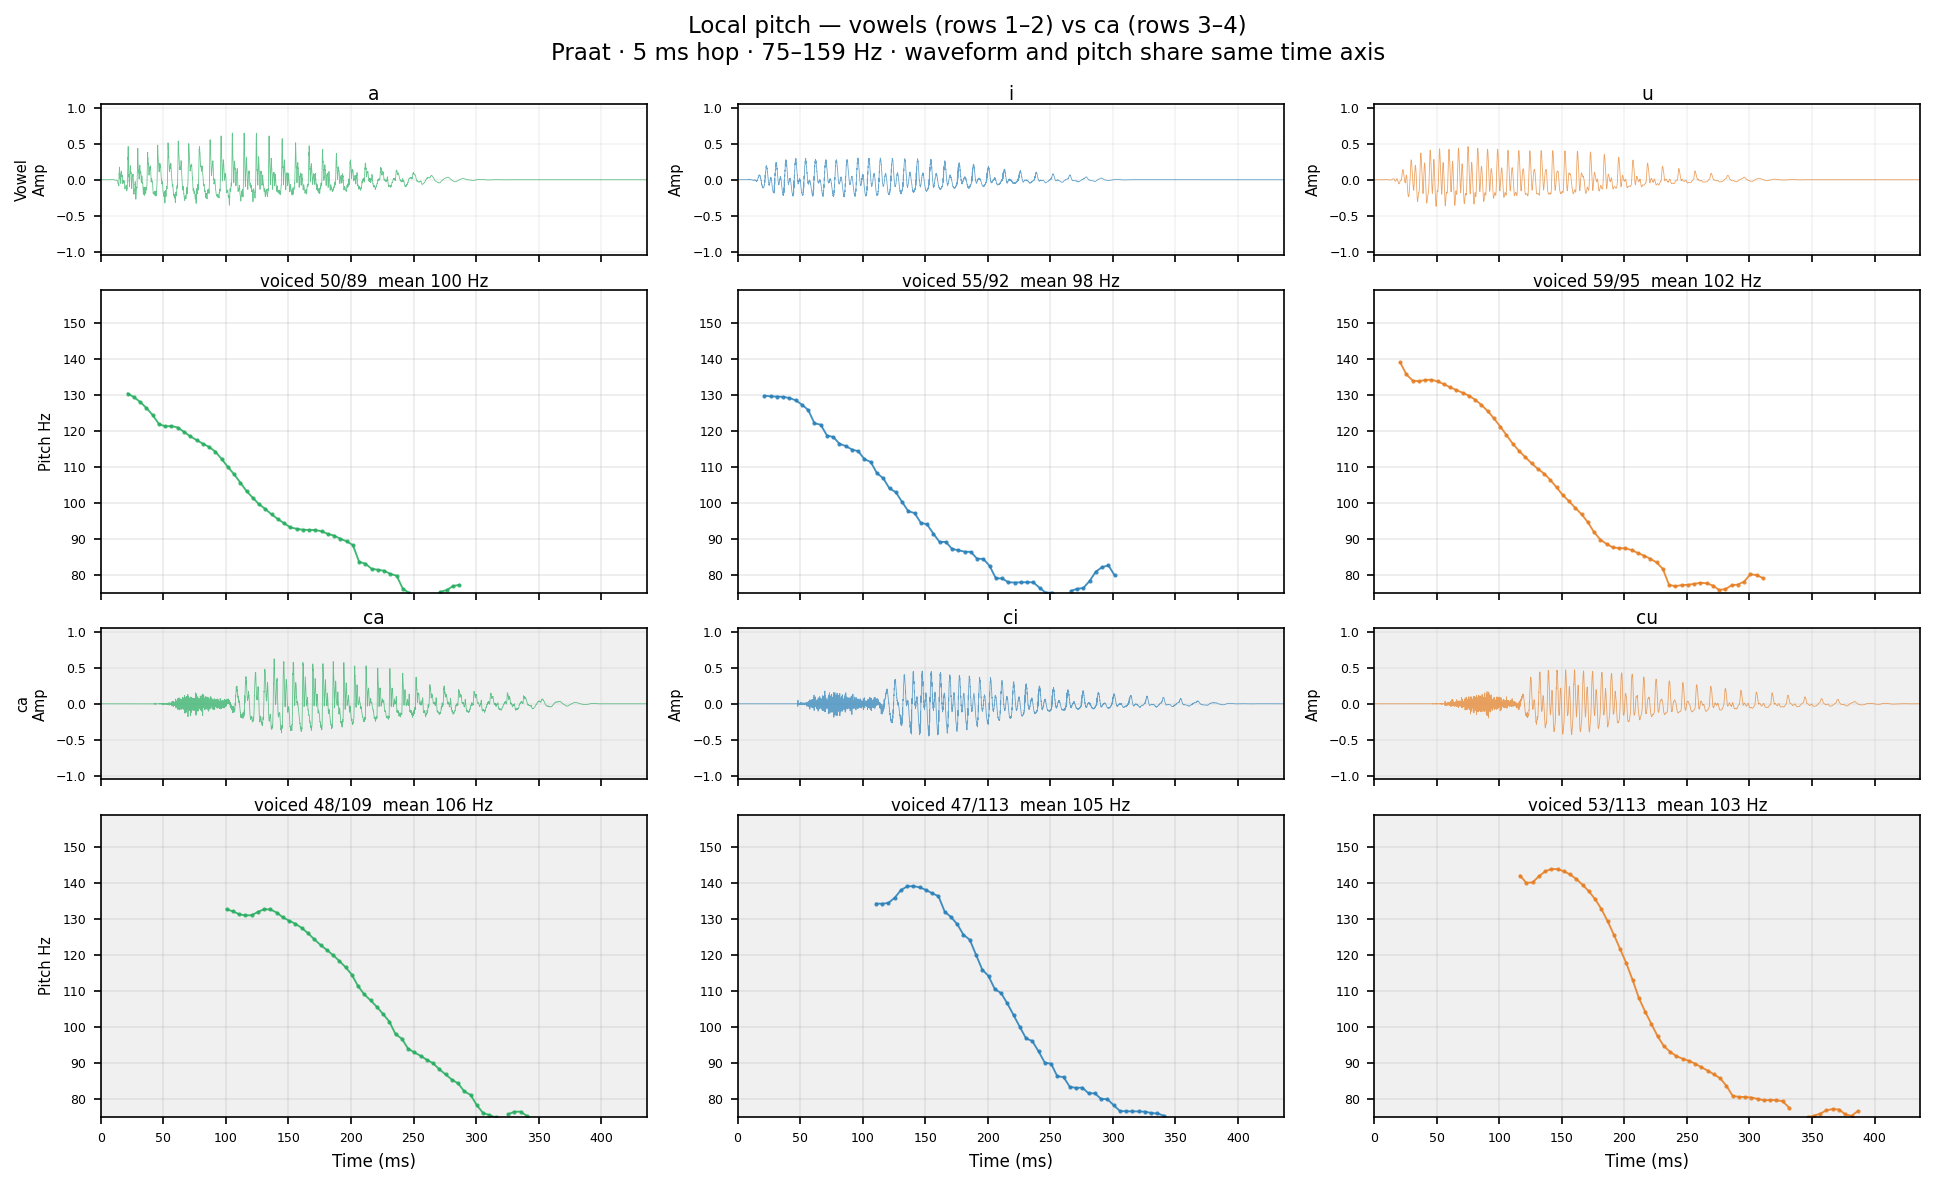
Local pitch (Prof's view): Praat autocorrelation at 5 ms hop, 75–500 Hz range, no voiced/unvoiced separation — gaps only at true silence. Matches Praat's "local pitch plot." Finer time step shows rapid micro-variation in pitch; vowels show relatively flat regions; burst/transitions show gaps or jumps. Compare with the Pitch/IF panel below (10 ms hop, voiced-only, with IF overlay).
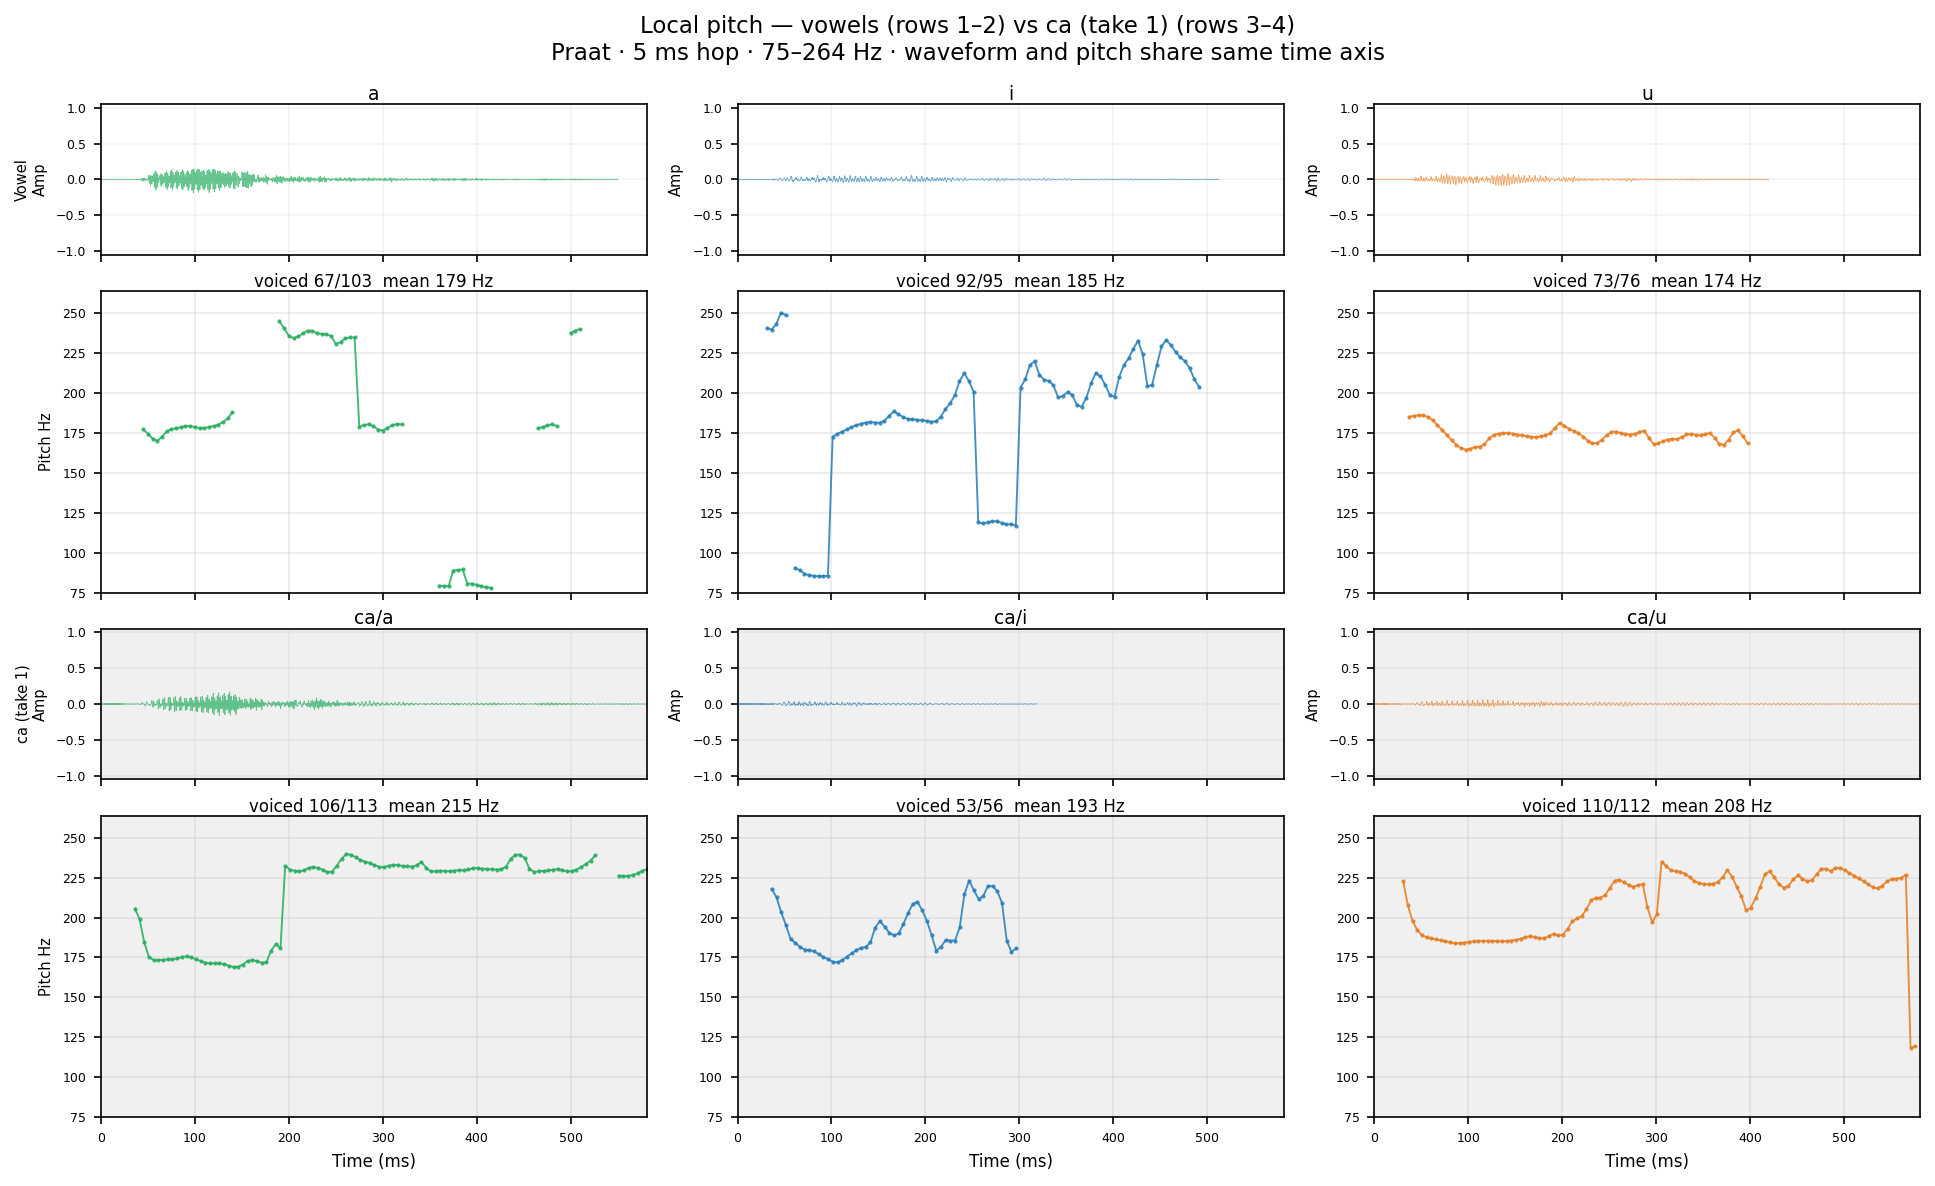
Human take 1 Same Praat settings as TTS. Compare burst gap duration and F0 onset.
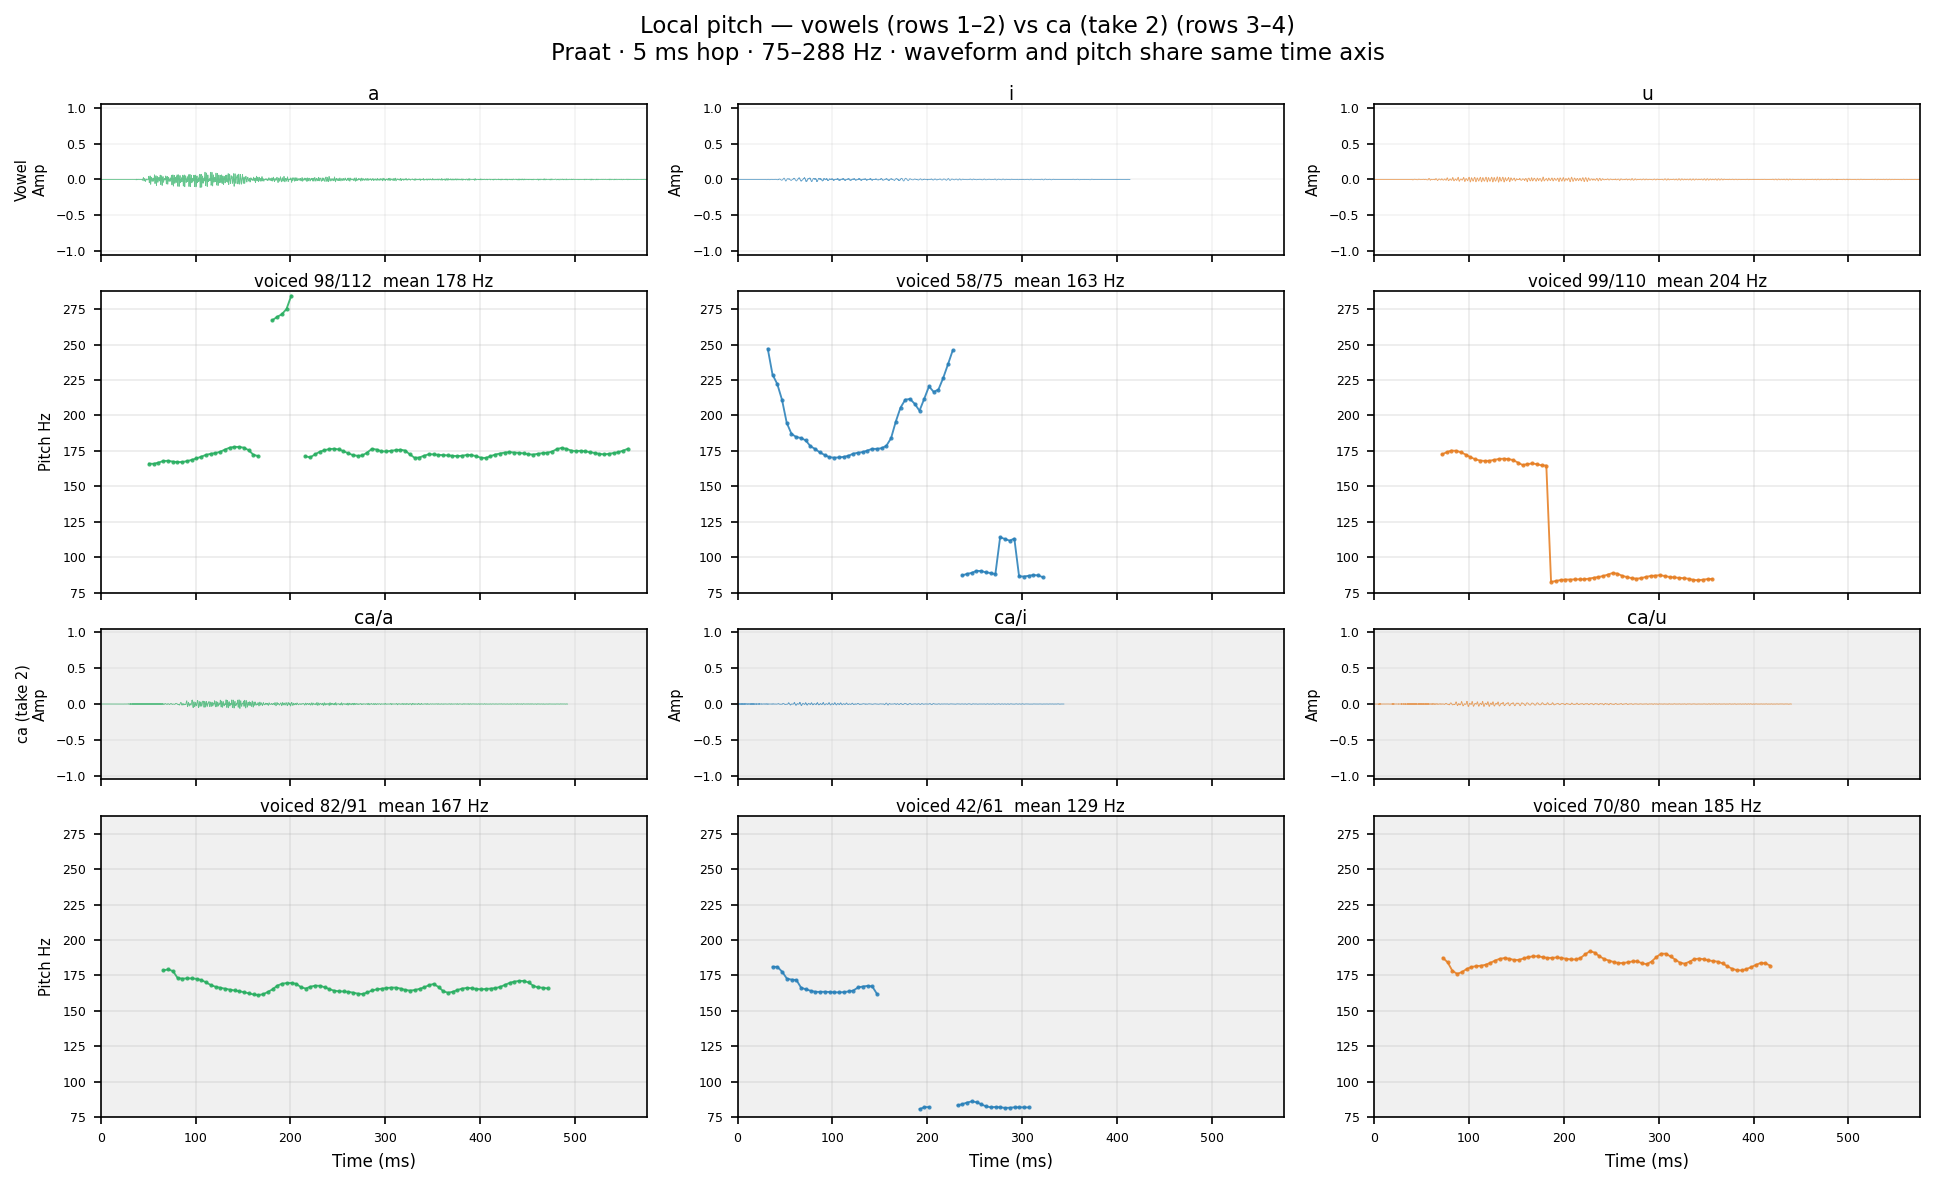
Human take 2 Same Praat settings as TTS. Compare burst gap duration and F0 onset.
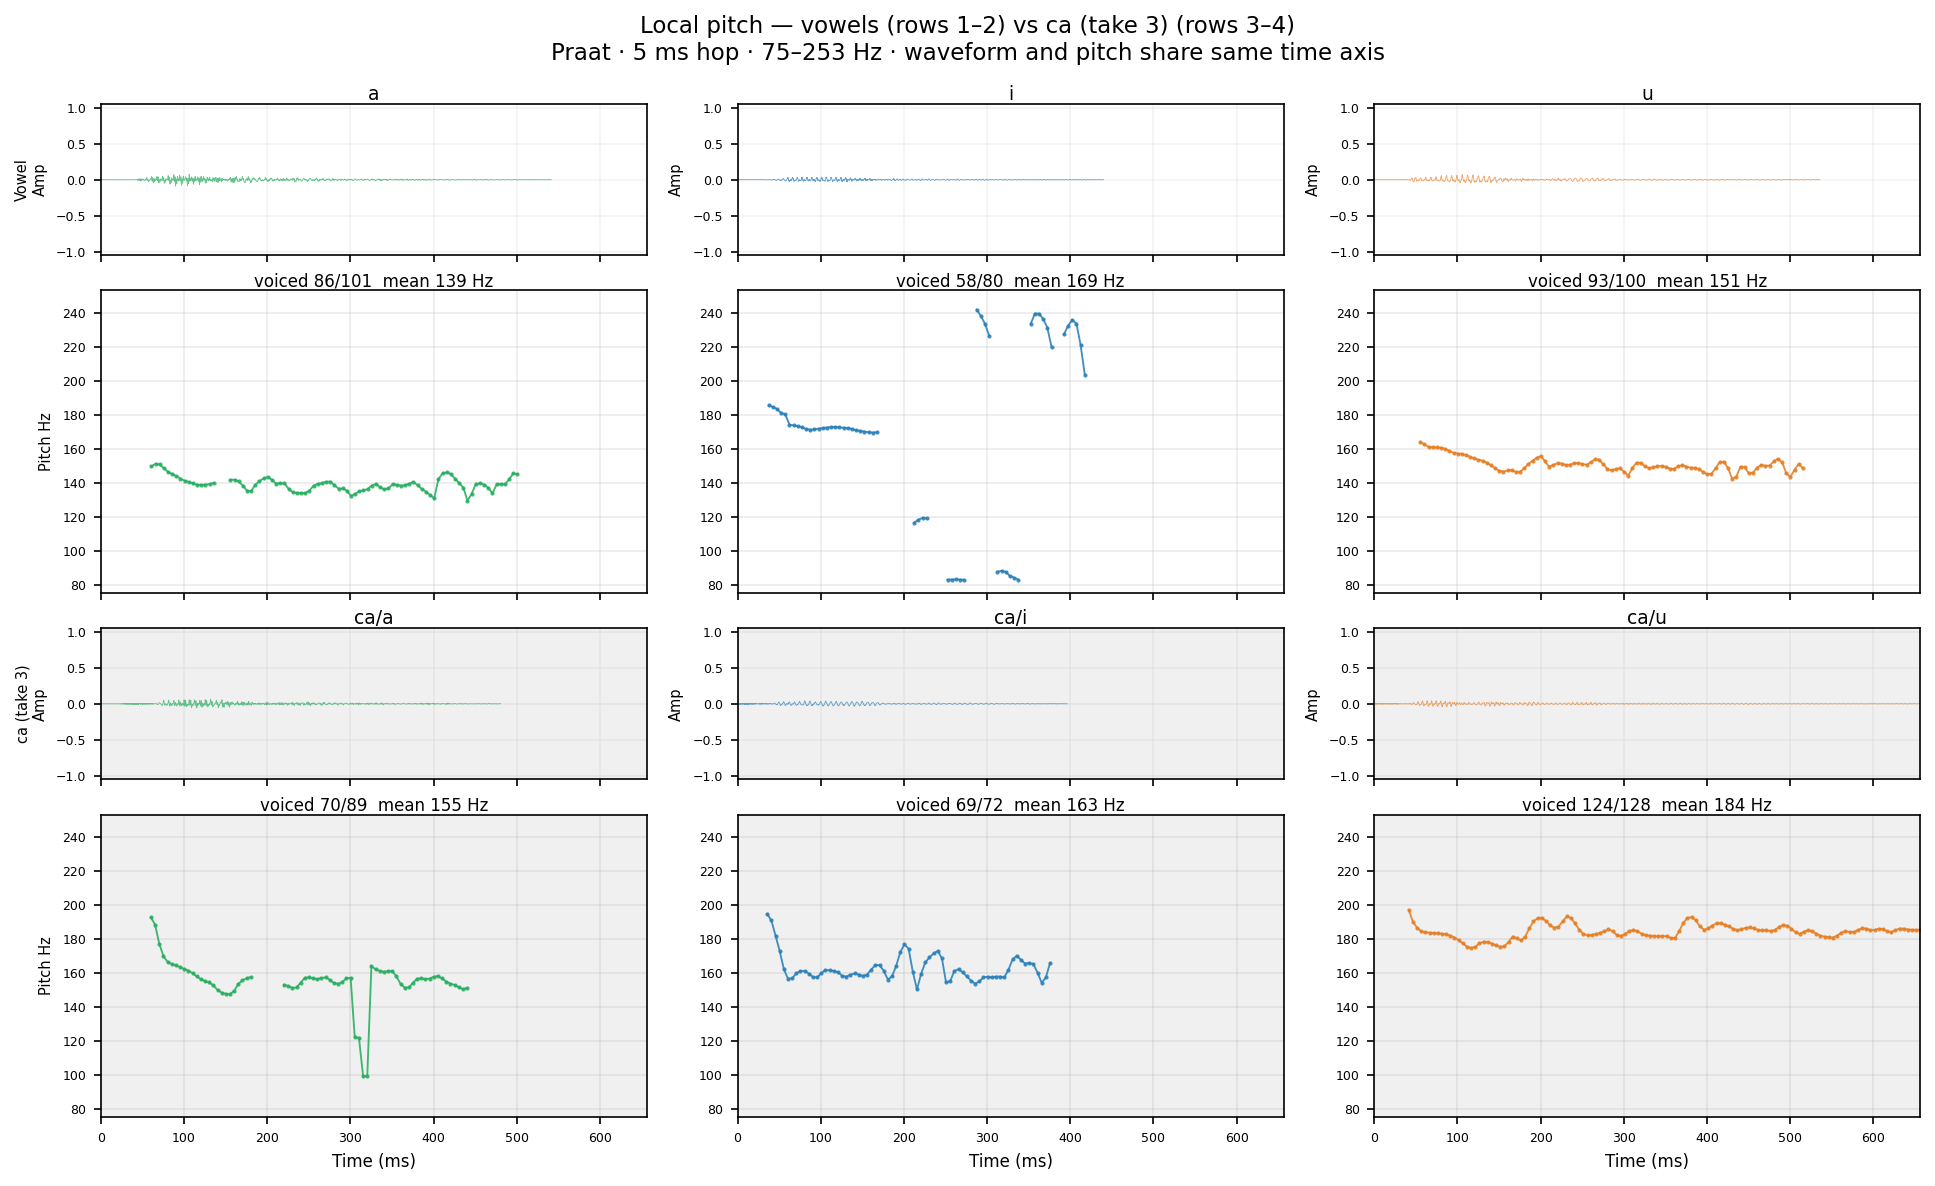
Human take 3 Same Praat settings as TTS. Compare burst gap duration and F0 onset.
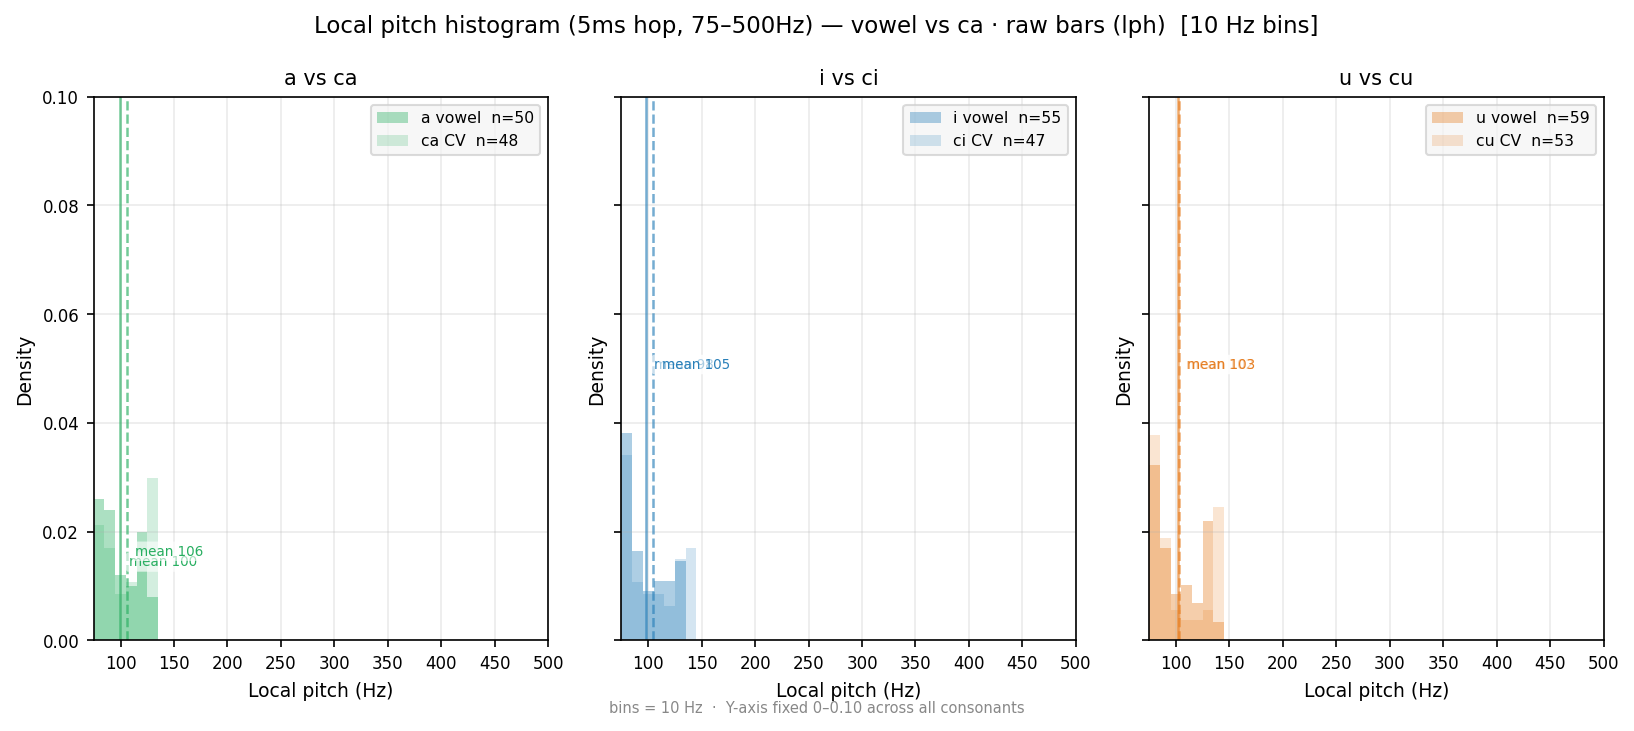
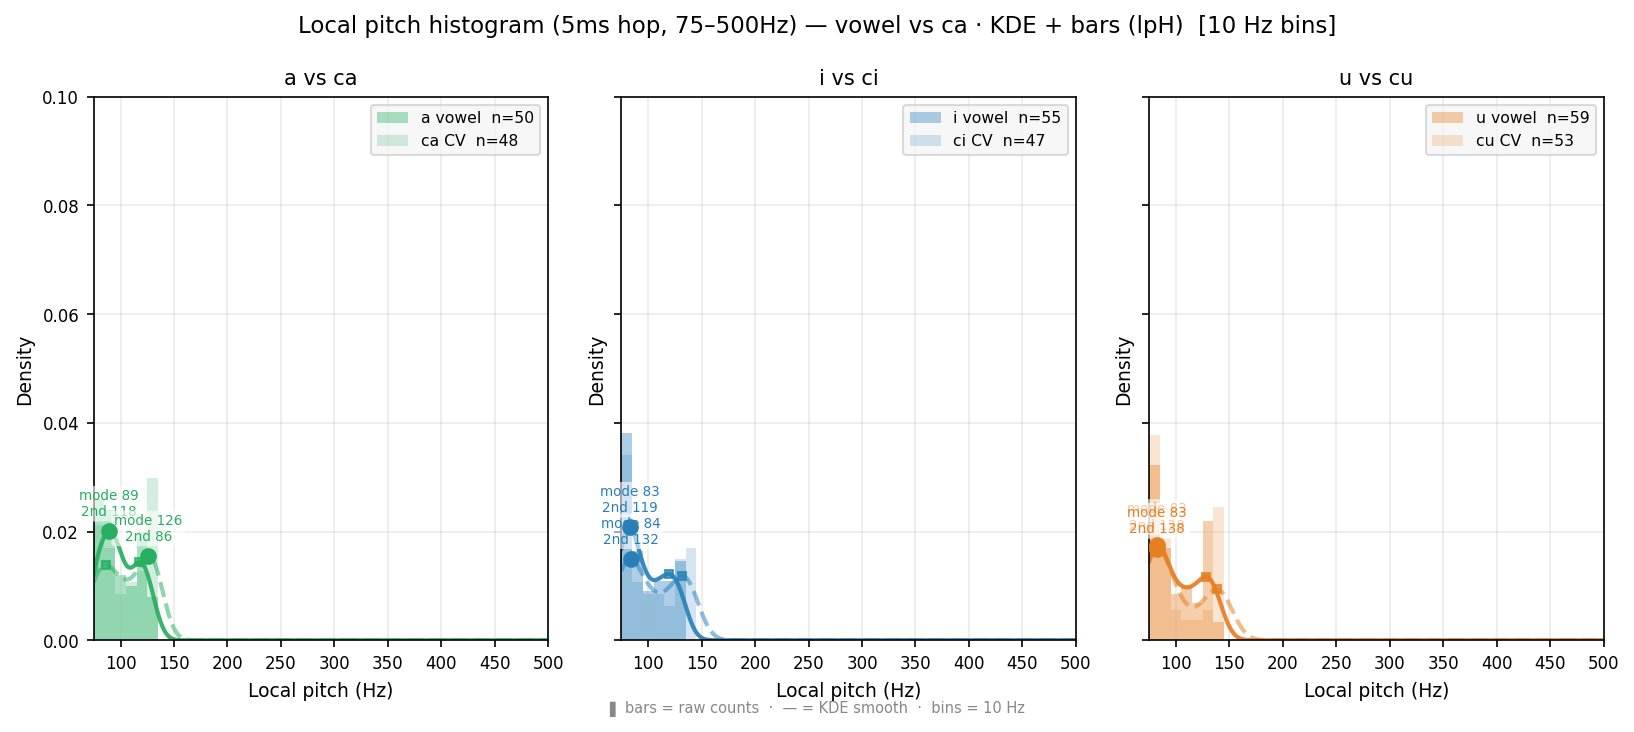
Local pitch (5ms hop, 75–500Hz) histogram — wider range than Pitch/F0 distribution (10ms, 75–300Hz). lpH = alpha bars + KDE smooth: readable peaks, secondary bump visible. lph = raw bars: unsmoothed, honest bin counts. Primary ● and secondary ■ peaks marked on KDE curve (lpH only). Wider X-axis (to 500Hz) may reveal F1 leakage for /i/ /u/ above 300Hz. Compare with Pitch/F0 distribution below for time-step and frequency-range effect.
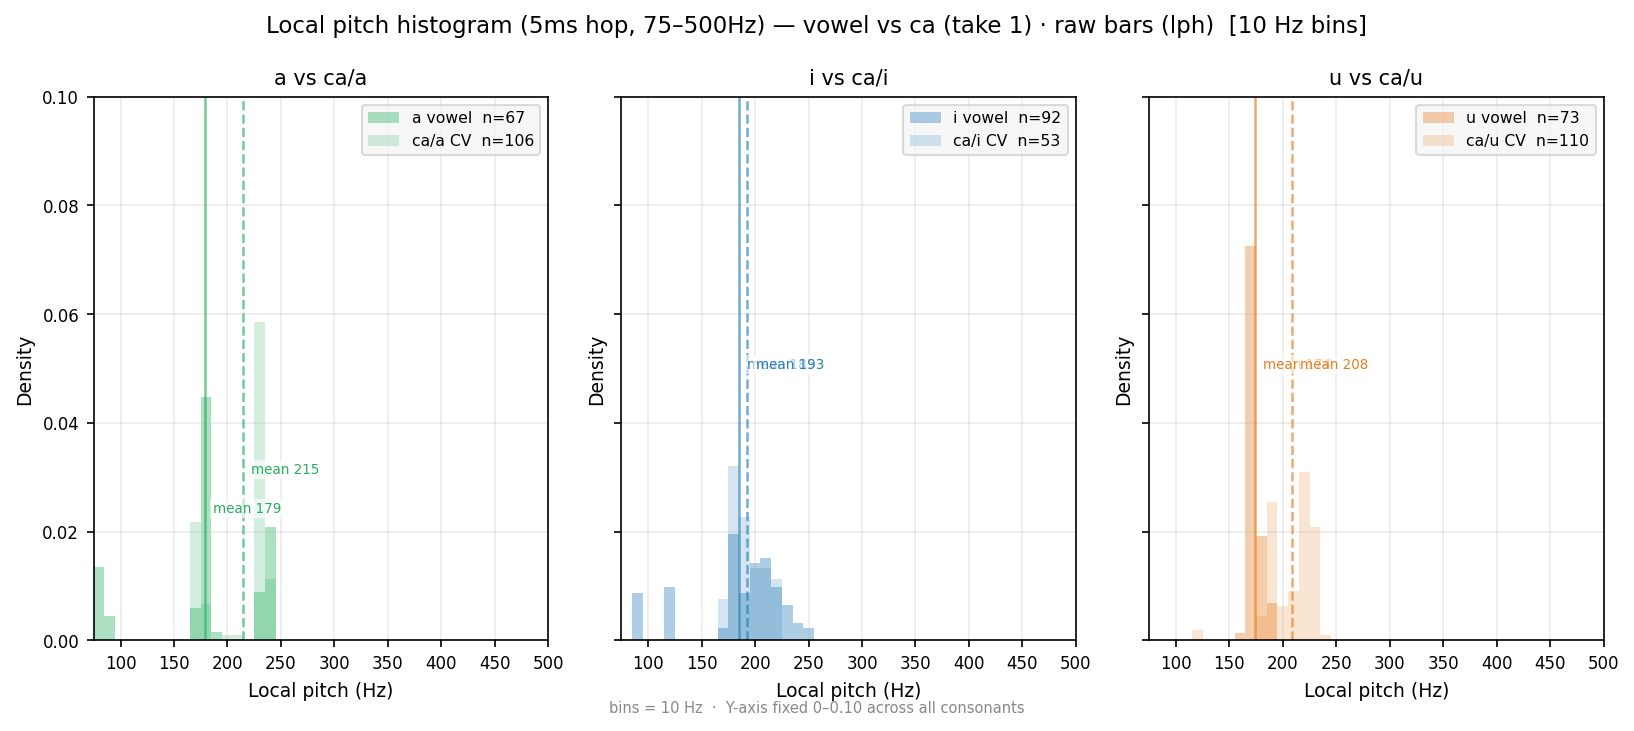
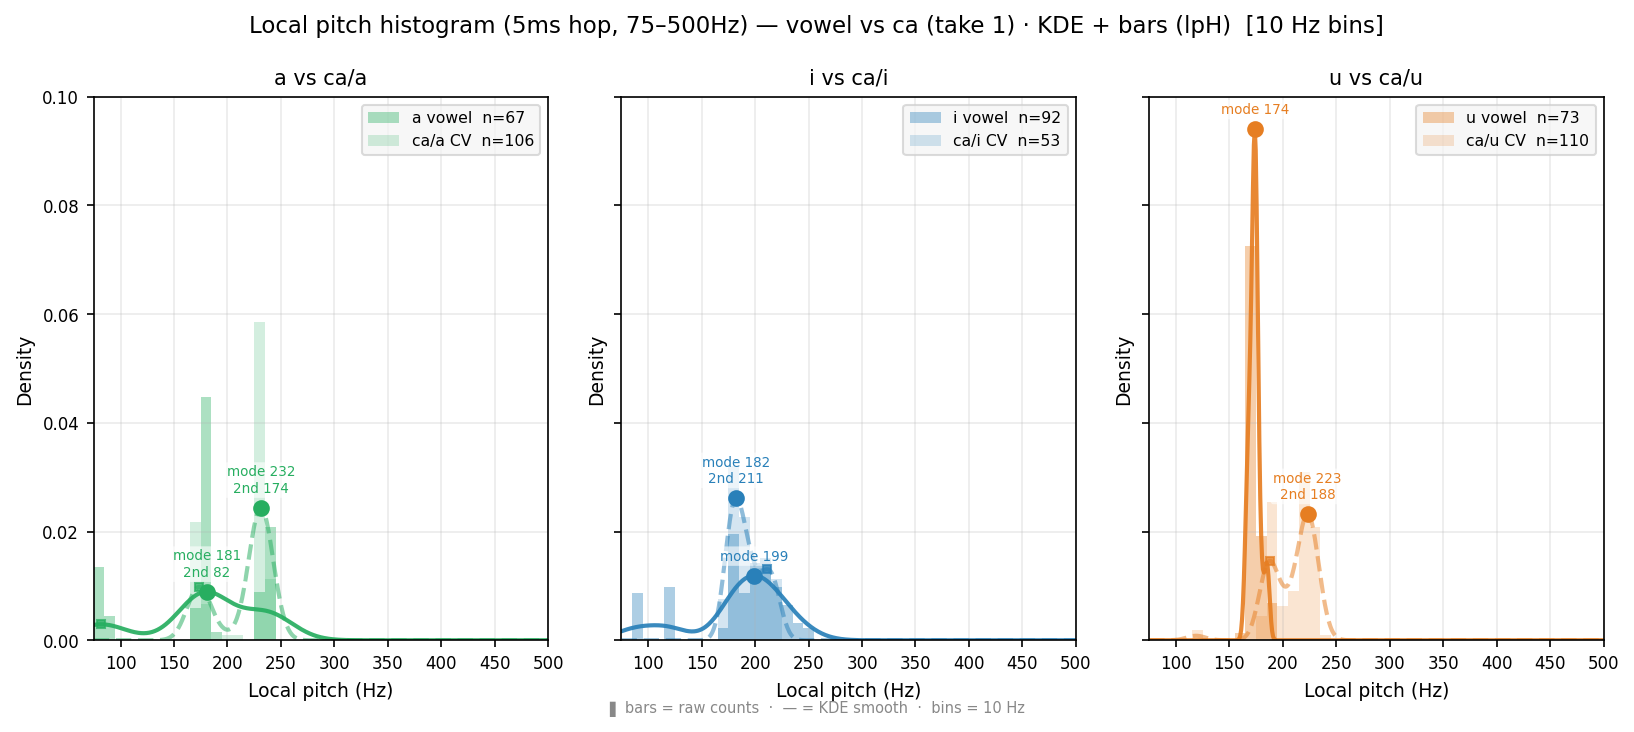
Local pitch (5ms hop, 75–500Hz) histogram — wider range than Pitch/F0 distribution (10ms, 75–300Hz). lpH = alpha bars + KDE smooth: readable peaks, secondary bump visible. lph = raw bars: unsmoothed, honest bin counts. Primary ● and secondary ■ peaks marked on KDE curve (lpH only). Wider X-axis (to 500Hz) may reveal F1 leakage for /i/ /u/ above 300Hz. Compare with Pitch/F0 distribution below for time-step and frequency-range effect.
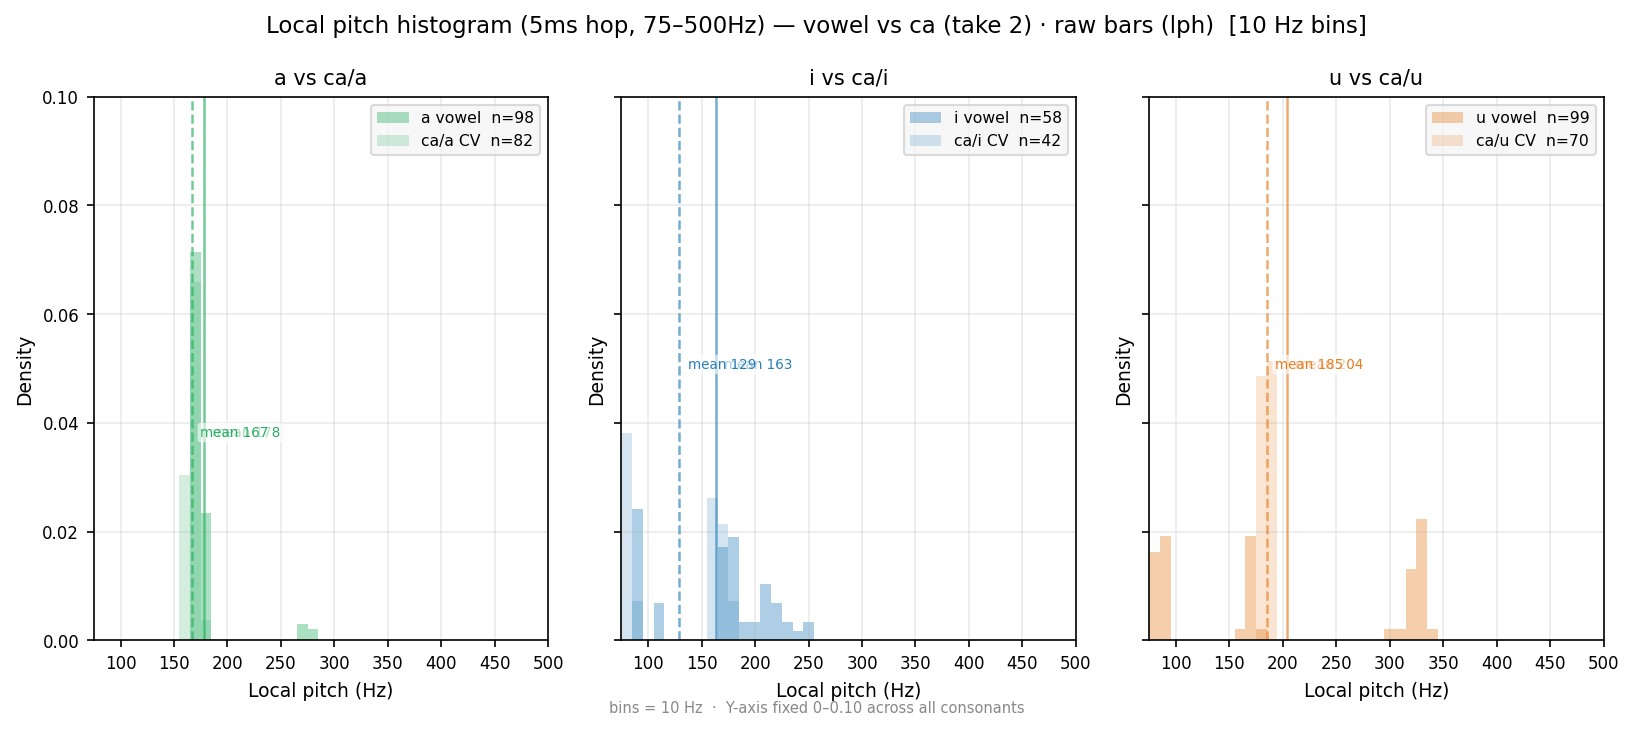
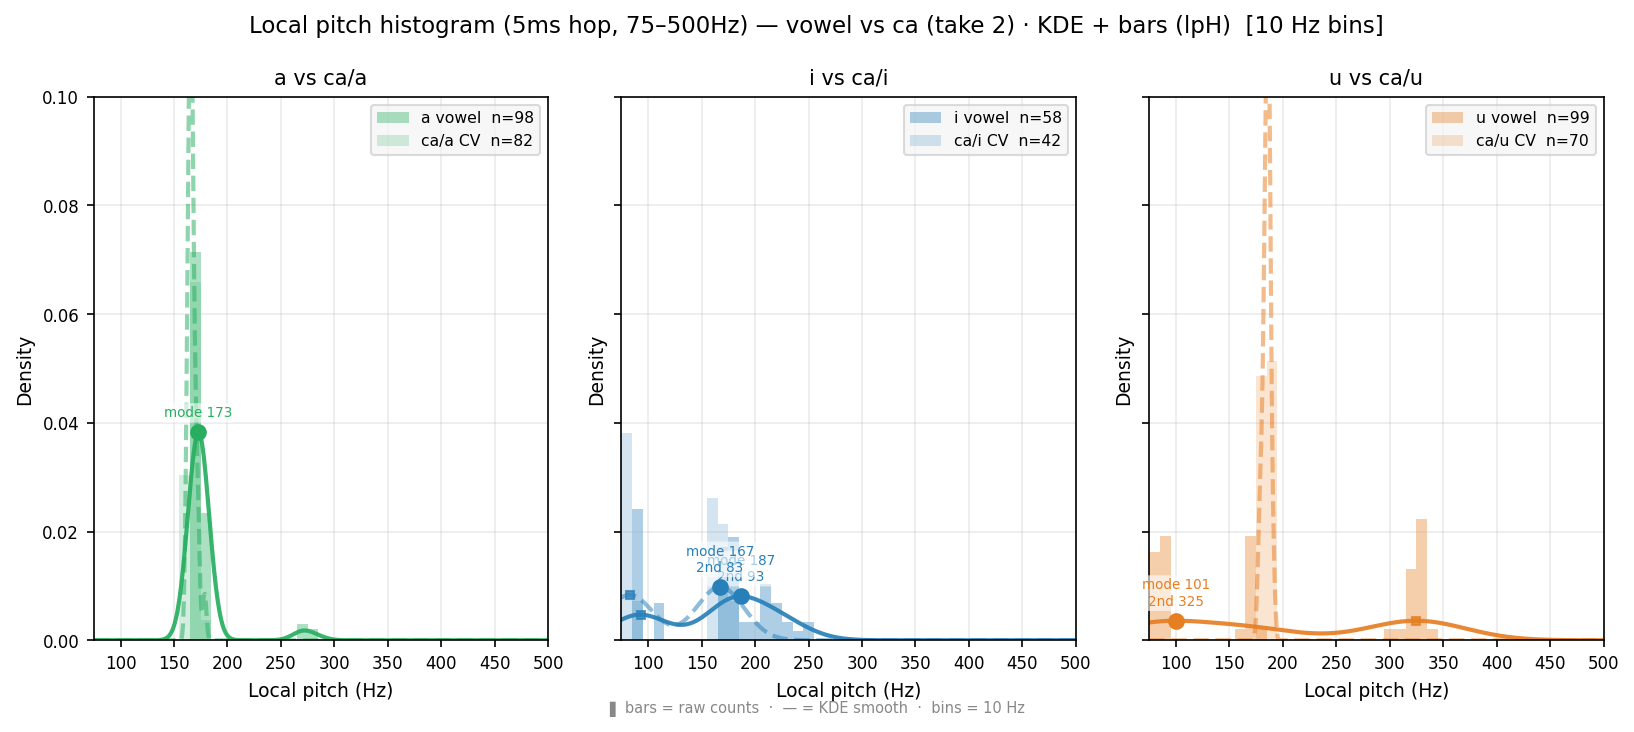
Local pitch (5ms hop, 75–500Hz) histogram — wider range than Pitch/F0 distribution (10ms, 75–300Hz). lpH = alpha bars + KDE smooth: readable peaks, secondary bump visible. lph = raw bars: unsmoothed, honest bin counts. Primary ● and secondary ■ peaks marked on KDE curve (lpH only). Wider X-axis (to 500Hz) may reveal F1 leakage for /i/ /u/ above 300Hz. Compare with Pitch/F0 distribution below for time-step and frequency-range effect.
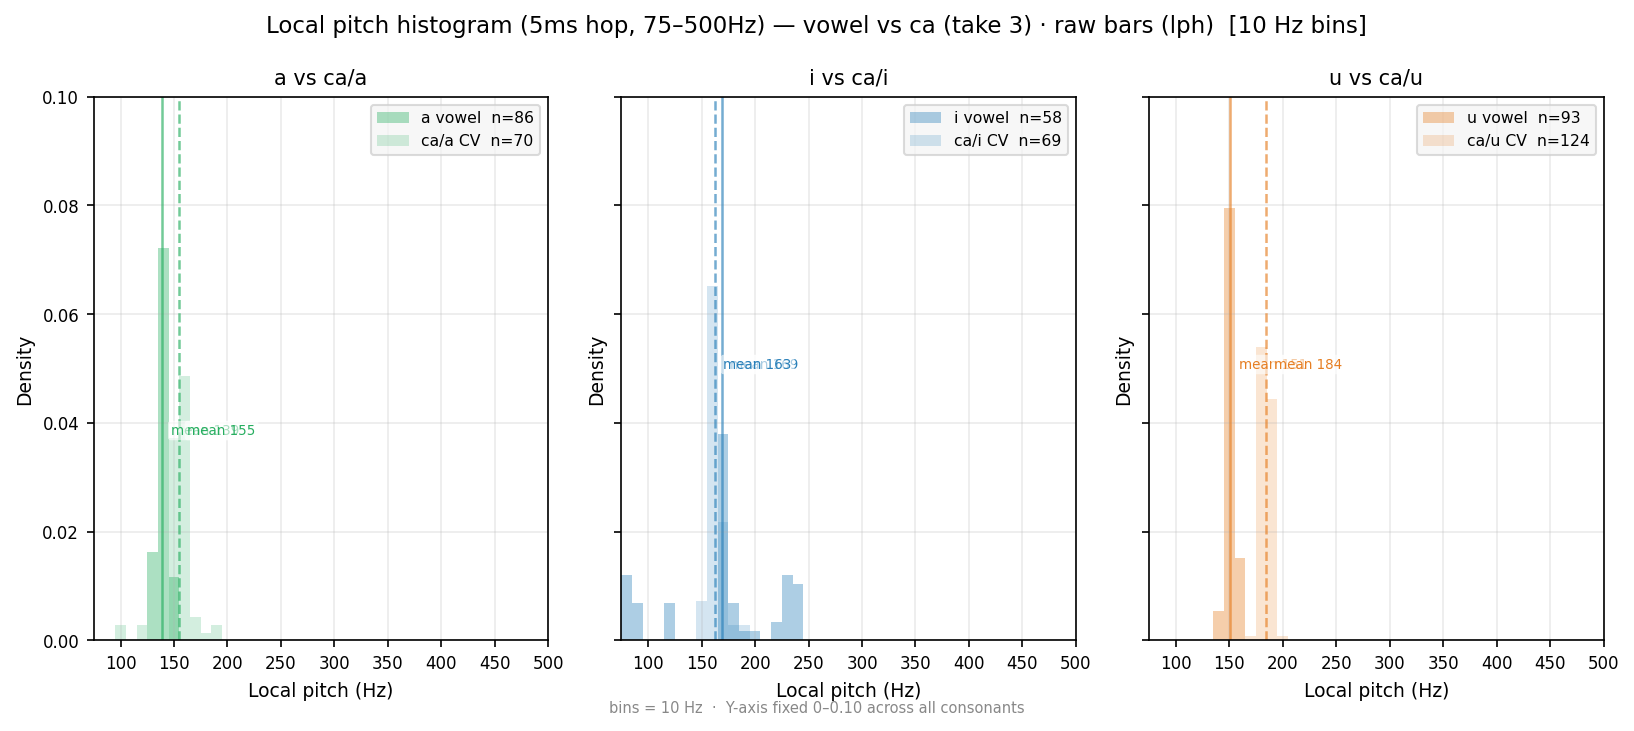
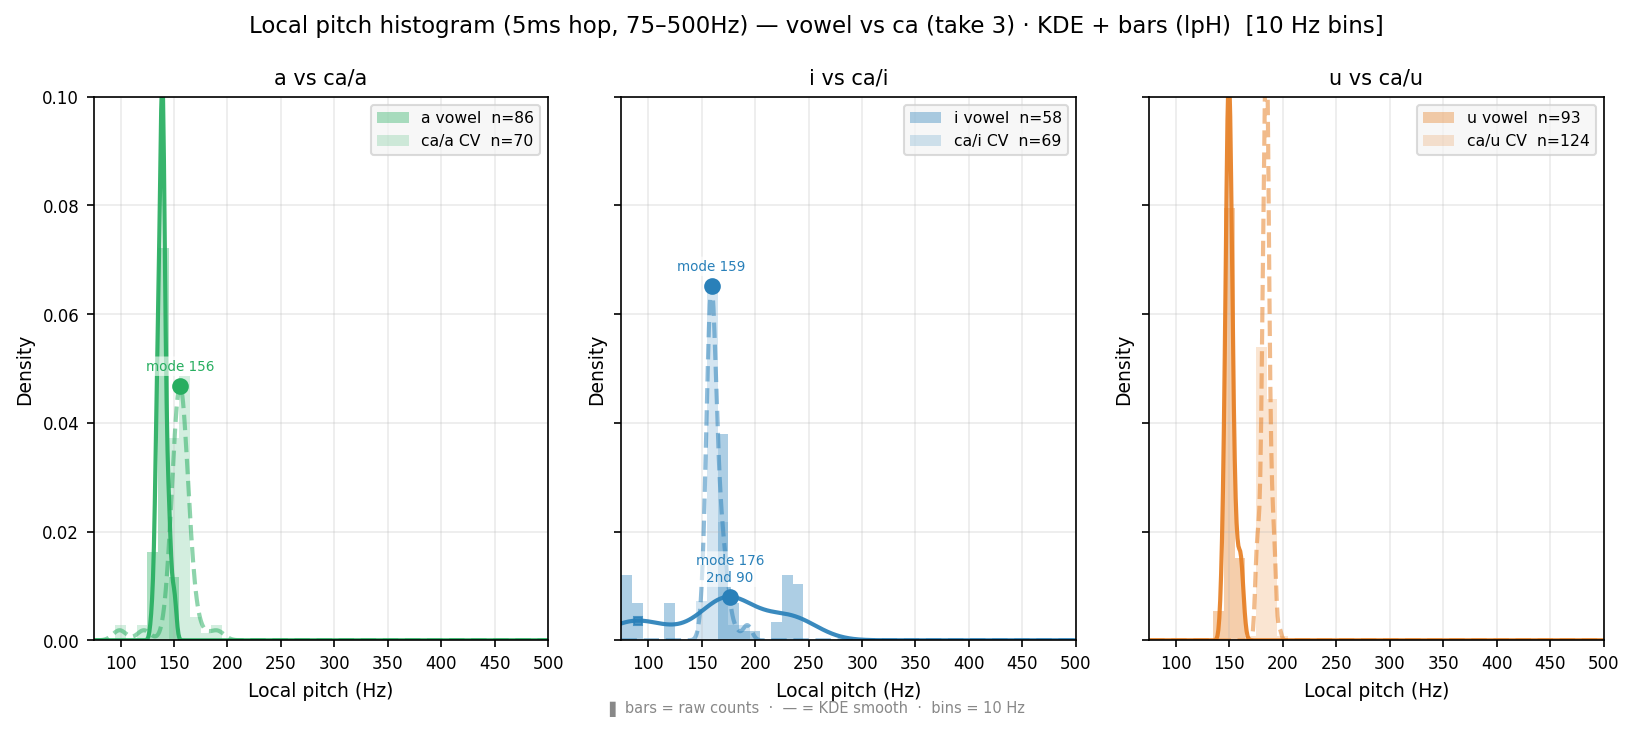
Local pitch (5ms hop, 75–500Hz) histogram — wider range than Pitch/F0 distribution (10ms, 75–300Hz). lpH = alpha bars + KDE smooth: readable peaks, secondary bump visible. lph = raw bars: unsmoothed, honest bin counts. Primary ● and secondary ■ peaks marked on KDE curve (lpH only). Wider X-axis (to 500Hz) may reveal F1 leakage for /i/ /u/ above 300Hz. Compare with Pitch/F0 distribution below for time-step and frequency-range effect.
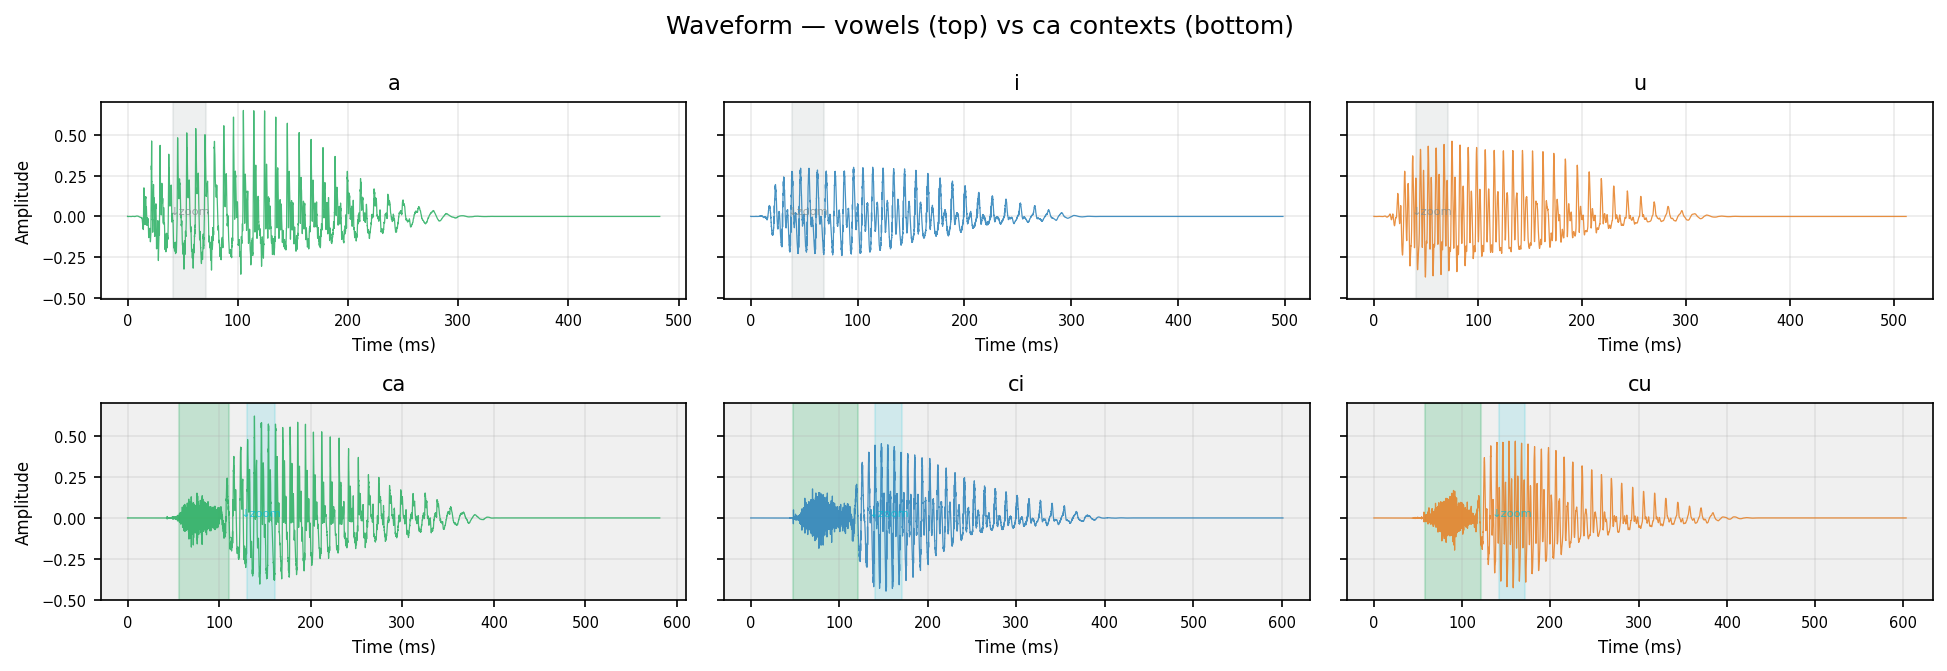
Green shading on CV waveforms = detected burst window (speech onset → first Praat-voiced frame).
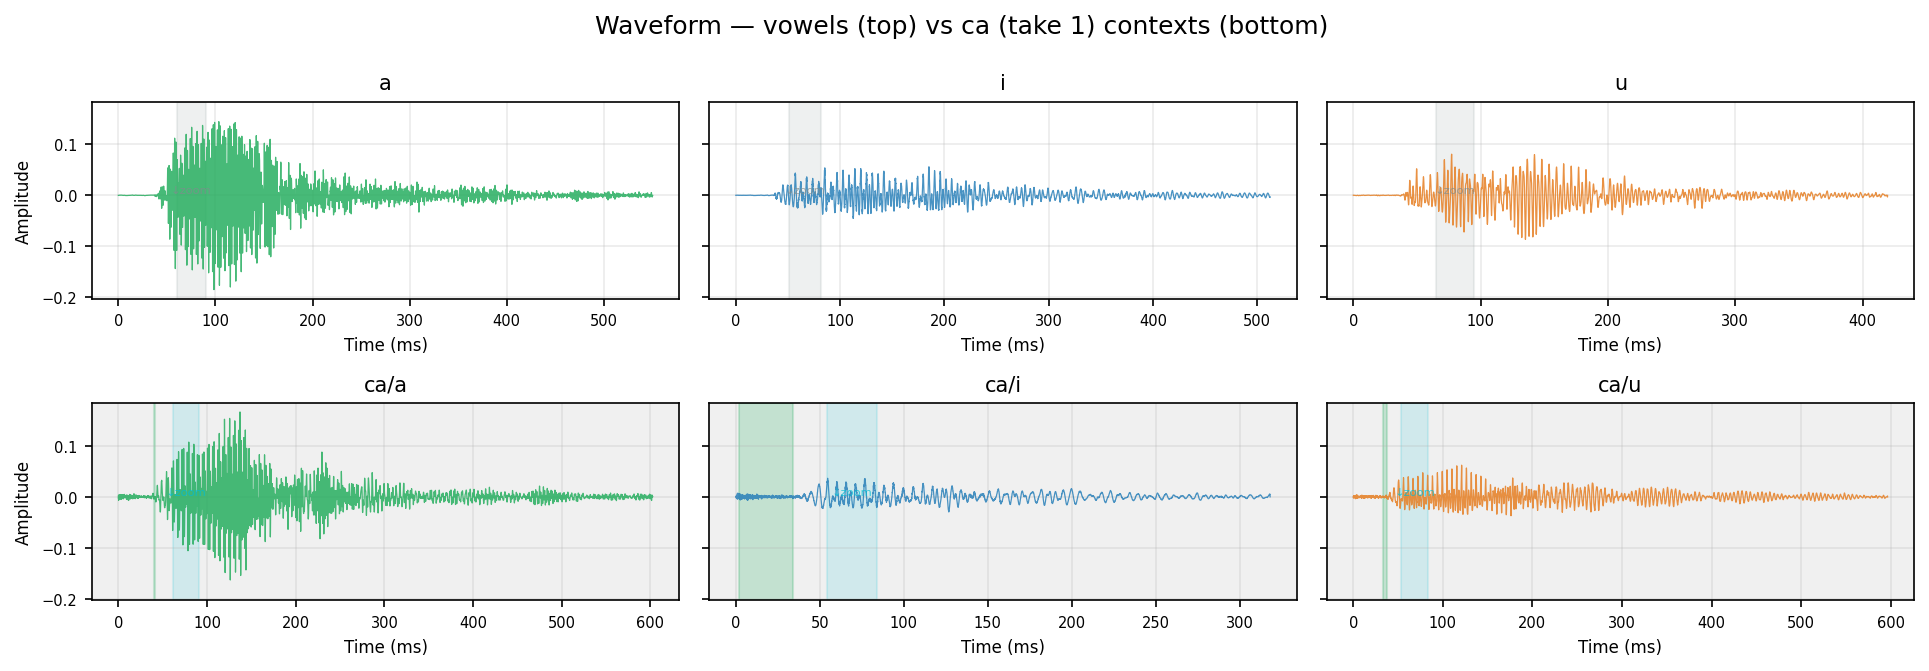
Human take 1
Green shading on CV waveforms = detected burst window (speech onset → first Praat-voiced frame).
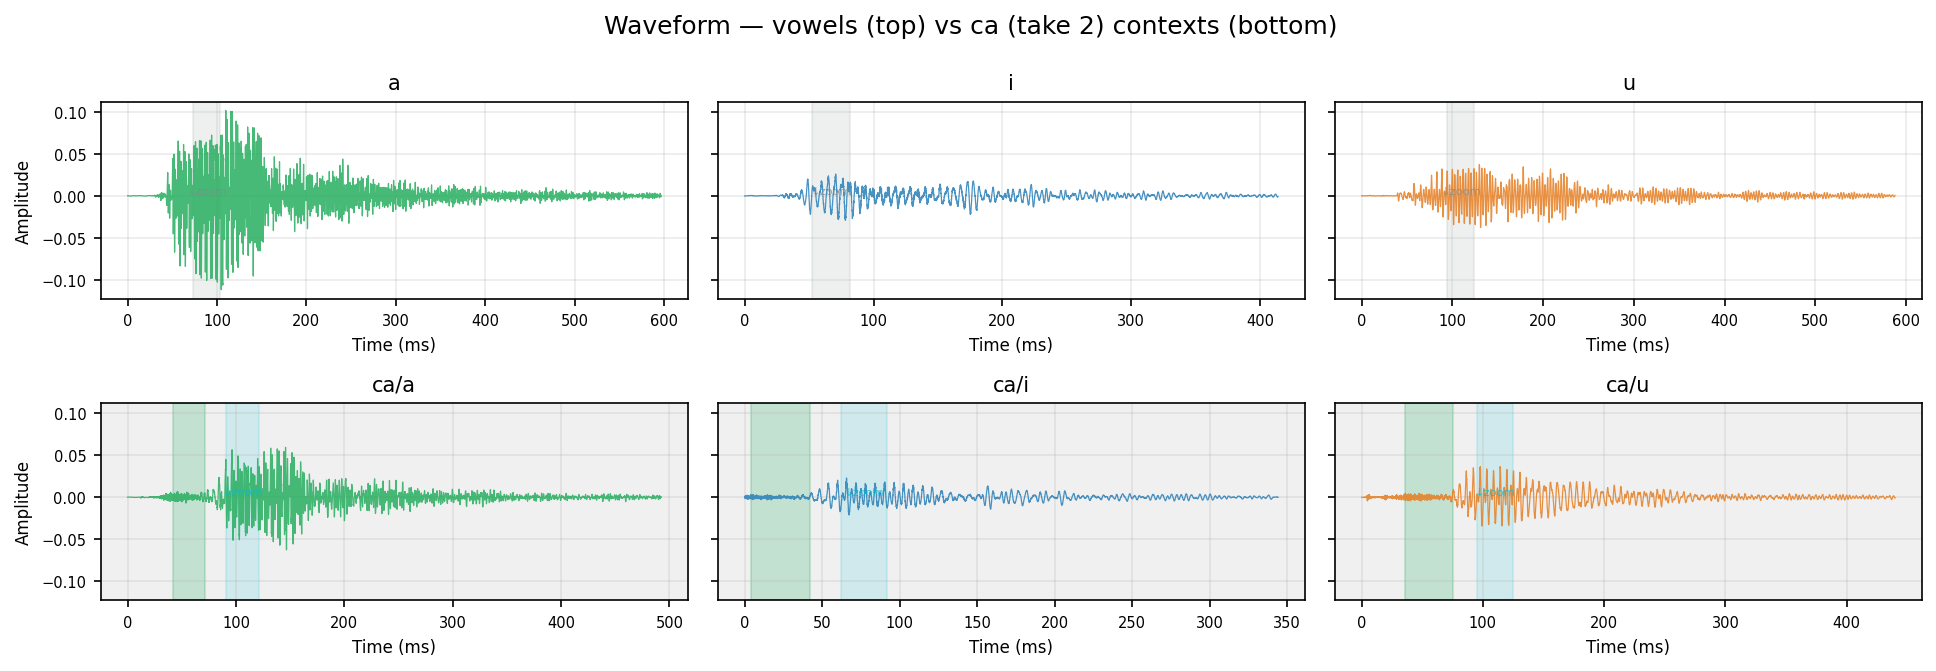
Human take 2
Green shading on CV waveforms = detected burst window (speech onset → first Praat-voiced frame).
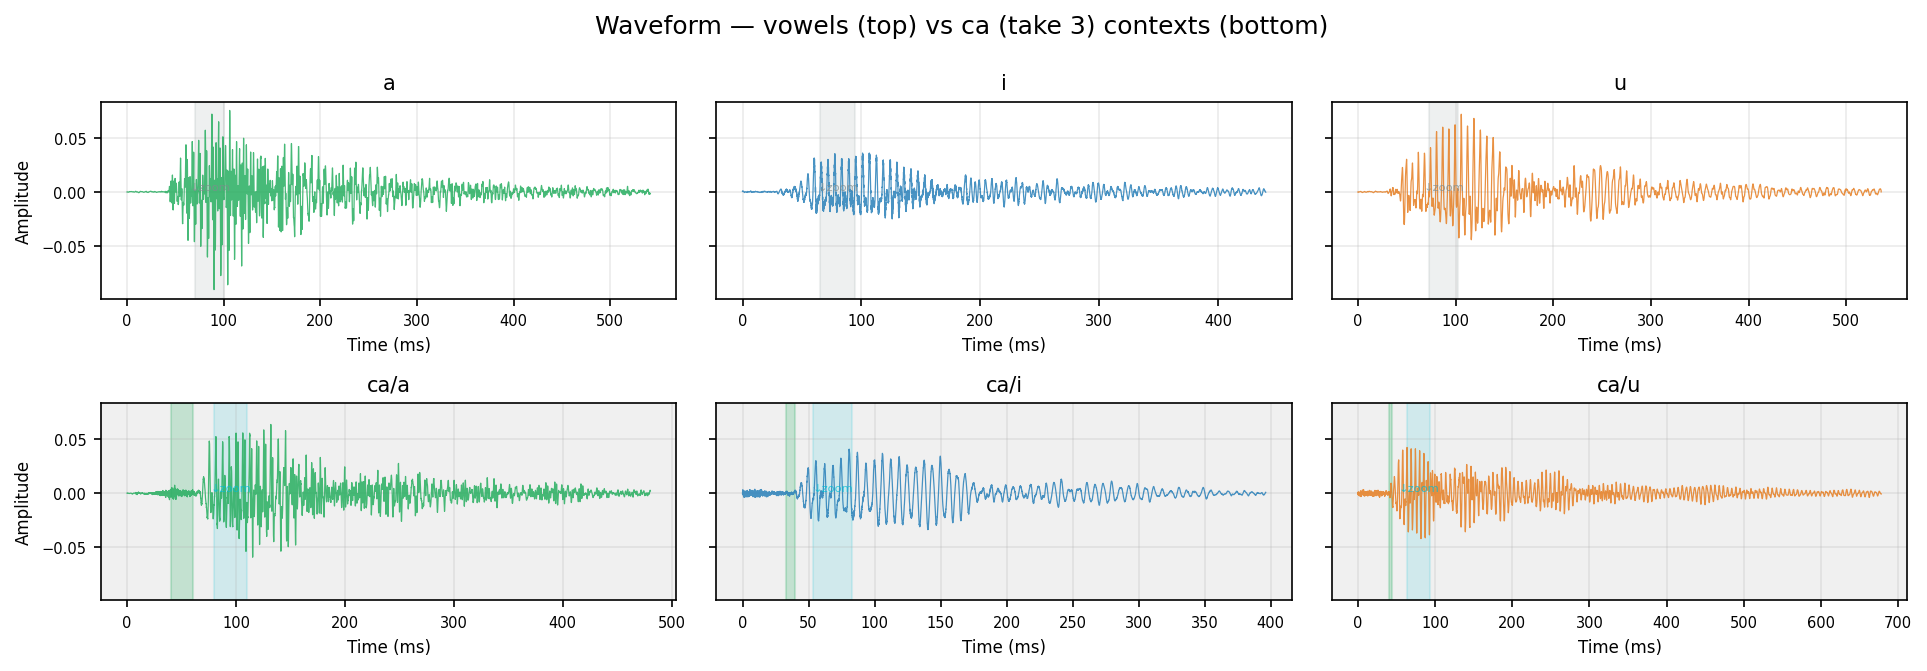
Human take 3
Green shading on CV waveforms = detected burst window (speech onset → first Praat-voiced frame).
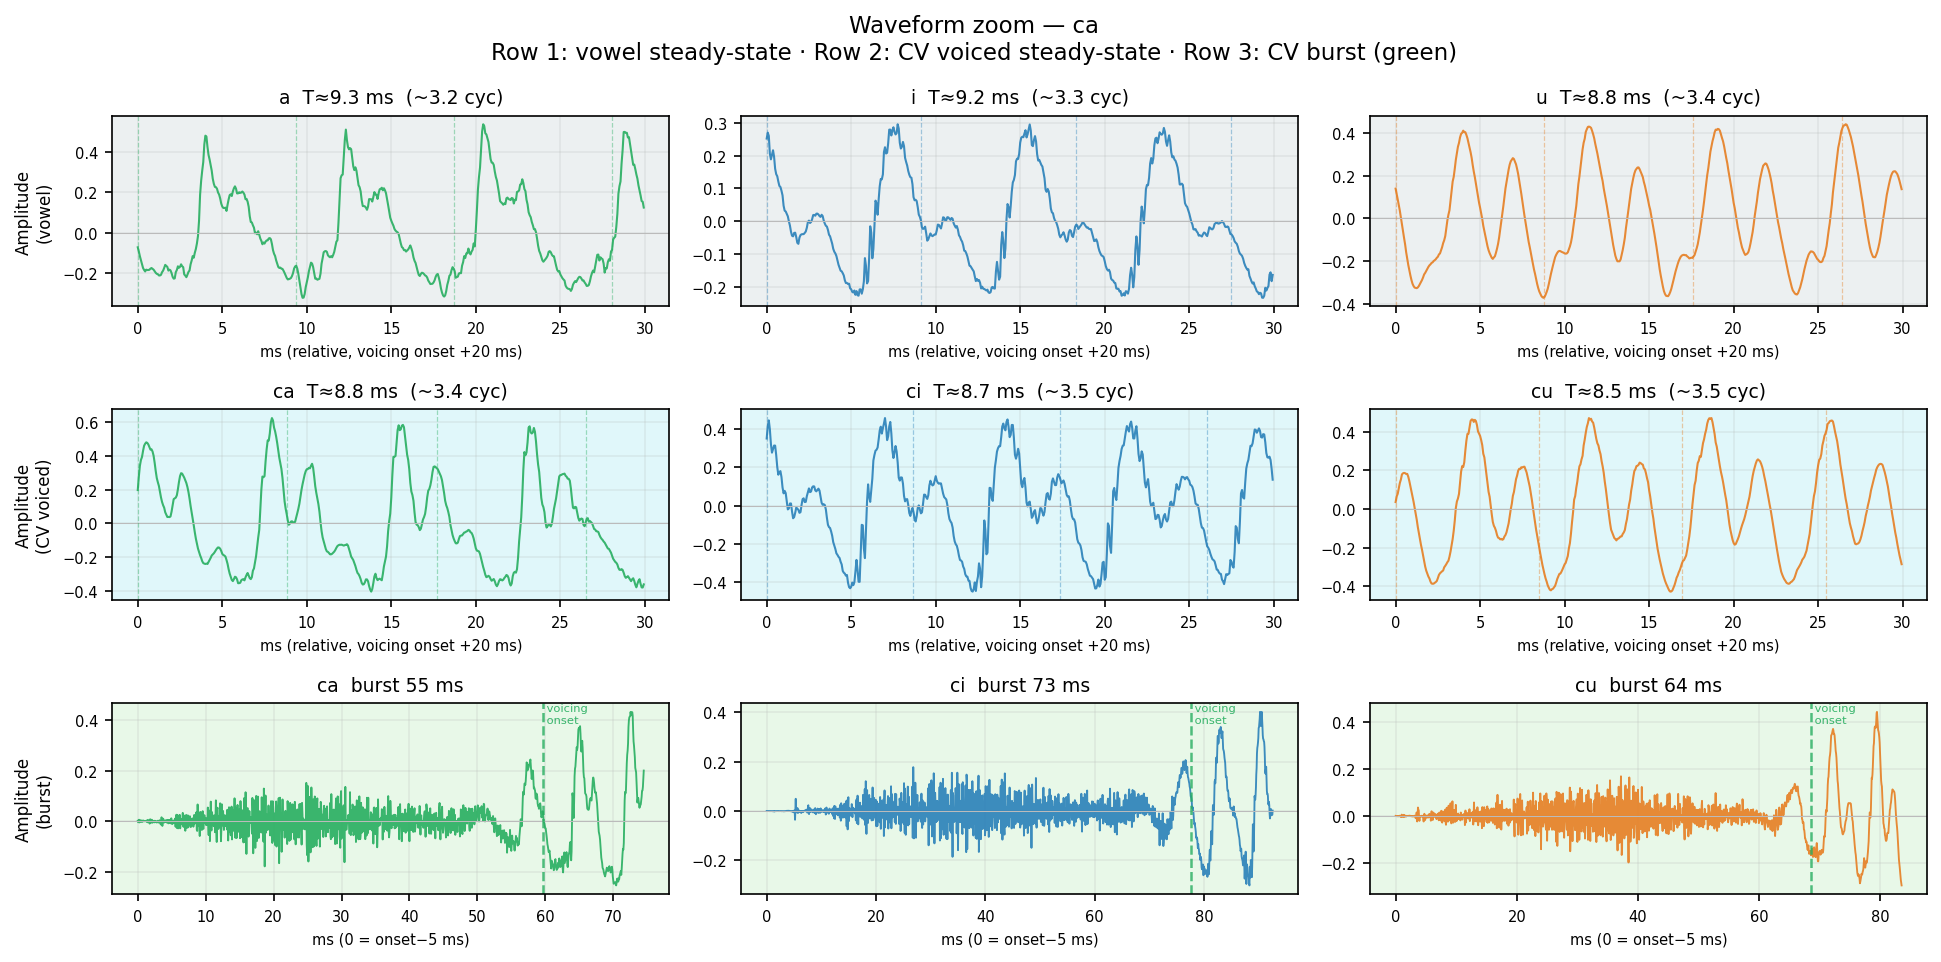
Row 1 (gray): Pure vowel steady-state — 30 ms, 20 ms after voicing onset. Row 2 (cyan): CV voiced steady-state — same window, shows vowel after consonant release. Row 3 (green): CV burst — aperiodic noise from stop release → transition to voicing (green dashed line = first voiced frame). Burst shape and duration differ by place of articulation. Dashed verticals in rows 1–2 = expected glottal period T = 1/F0. Waveform complexity = harmonic richness (pure sine = single harmonic; jagged = rich harmonics).
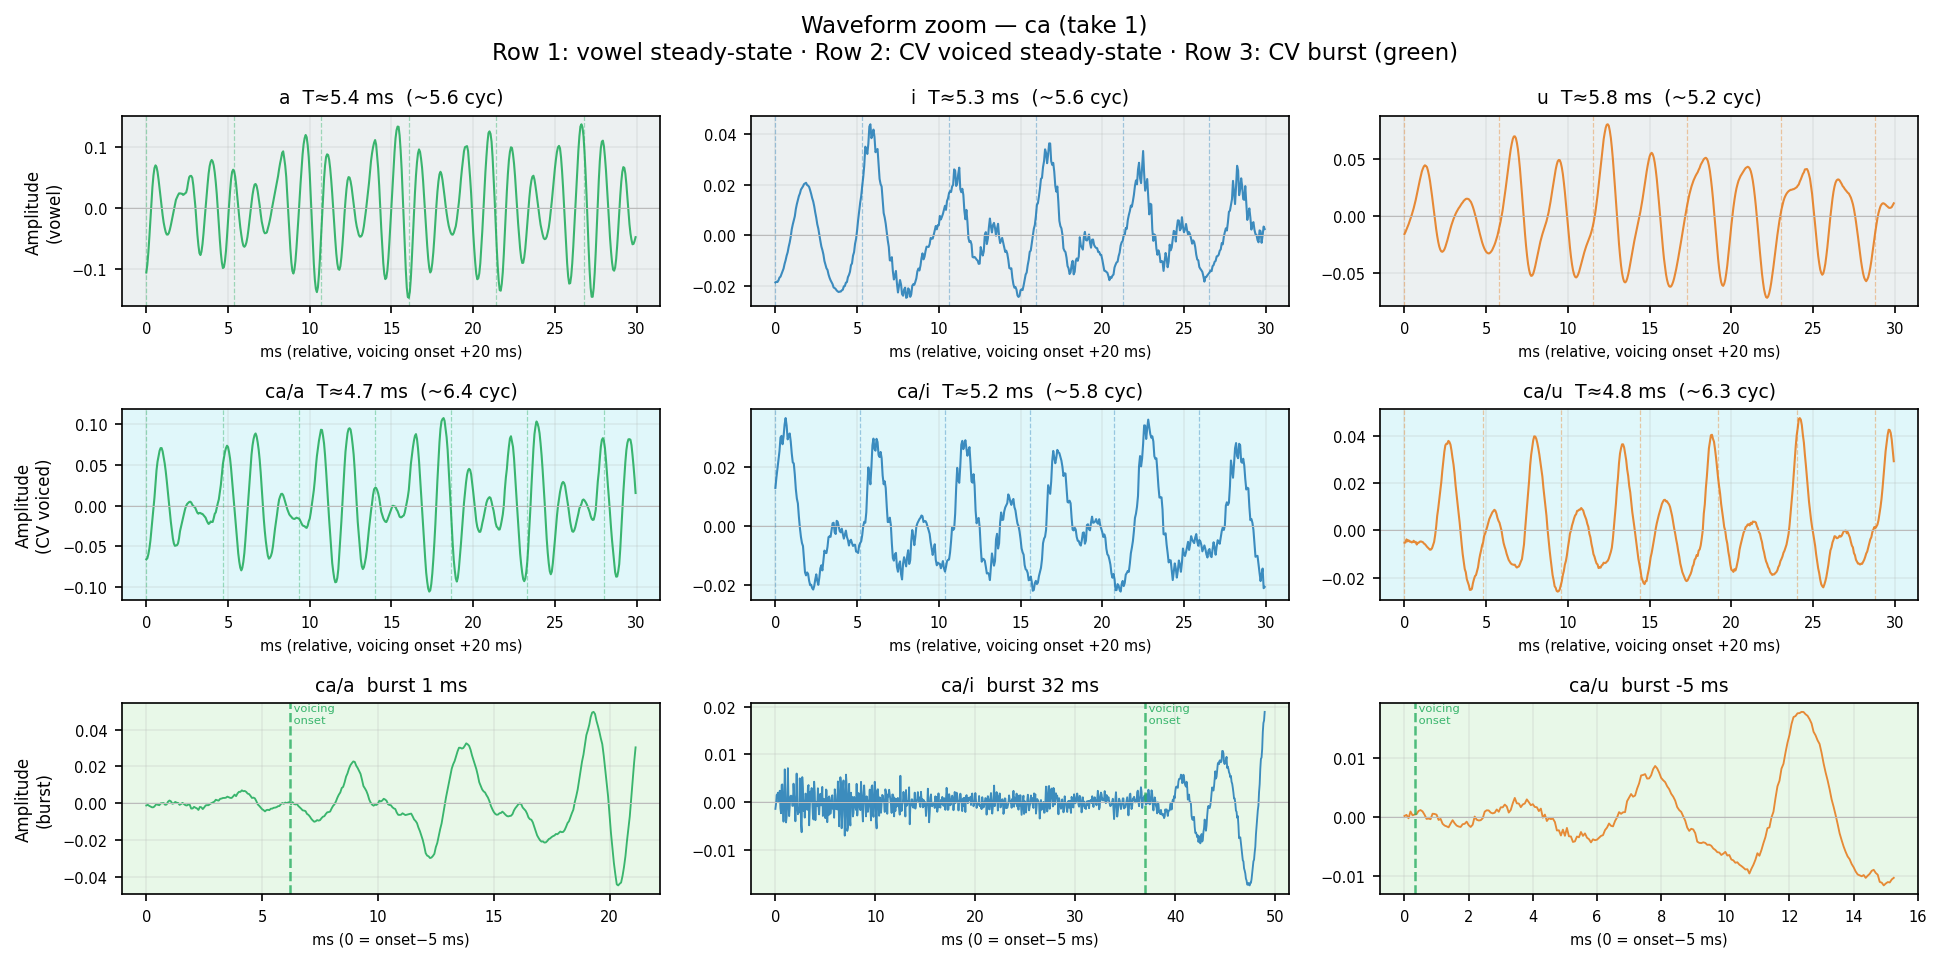
Human take 1
Row 1 (gray): Pure vowel steady-state — 30 ms, 20 ms after voicing onset. Row 2 (cyan): CV voiced steady-state — same window, shows vowel after consonant release. Row 3 (green): CV burst — aperiodic noise from stop release → transition to voicing (green dashed line = first voiced frame). Burst shape and duration differ by place of articulation. Dashed verticals in rows 1–2 = expected glottal period T = 1/F0. Waveform complexity = harmonic richness (pure sine = single harmonic; jagged = rich harmonics).
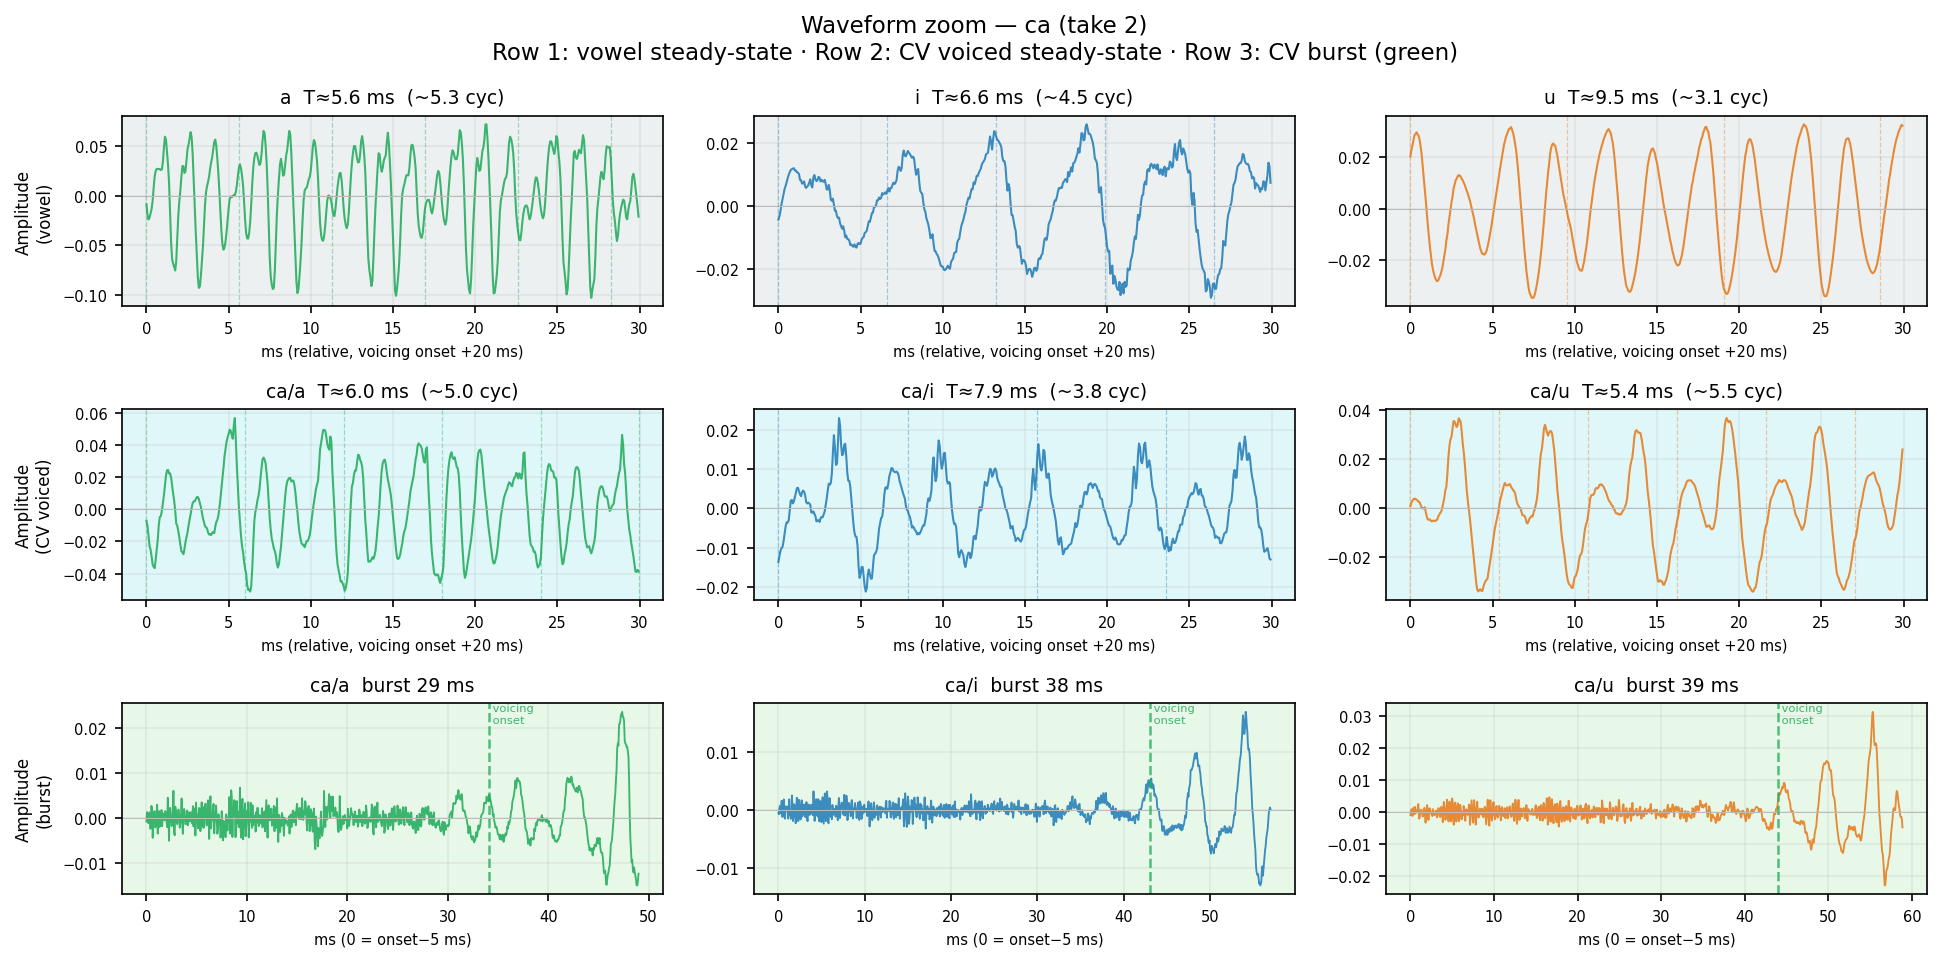
Human take 2
Row 1 (gray): Pure vowel steady-state — 30 ms, 20 ms after voicing onset. Row 2 (cyan): CV voiced steady-state — same window, shows vowel after consonant release. Row 3 (green): CV burst — aperiodic noise from stop release → transition to voicing (green dashed line = first voiced frame). Burst shape and duration differ by place of articulation. Dashed verticals in rows 1–2 = expected glottal period T = 1/F0. Waveform complexity = harmonic richness (pure sine = single harmonic; jagged = rich harmonics).
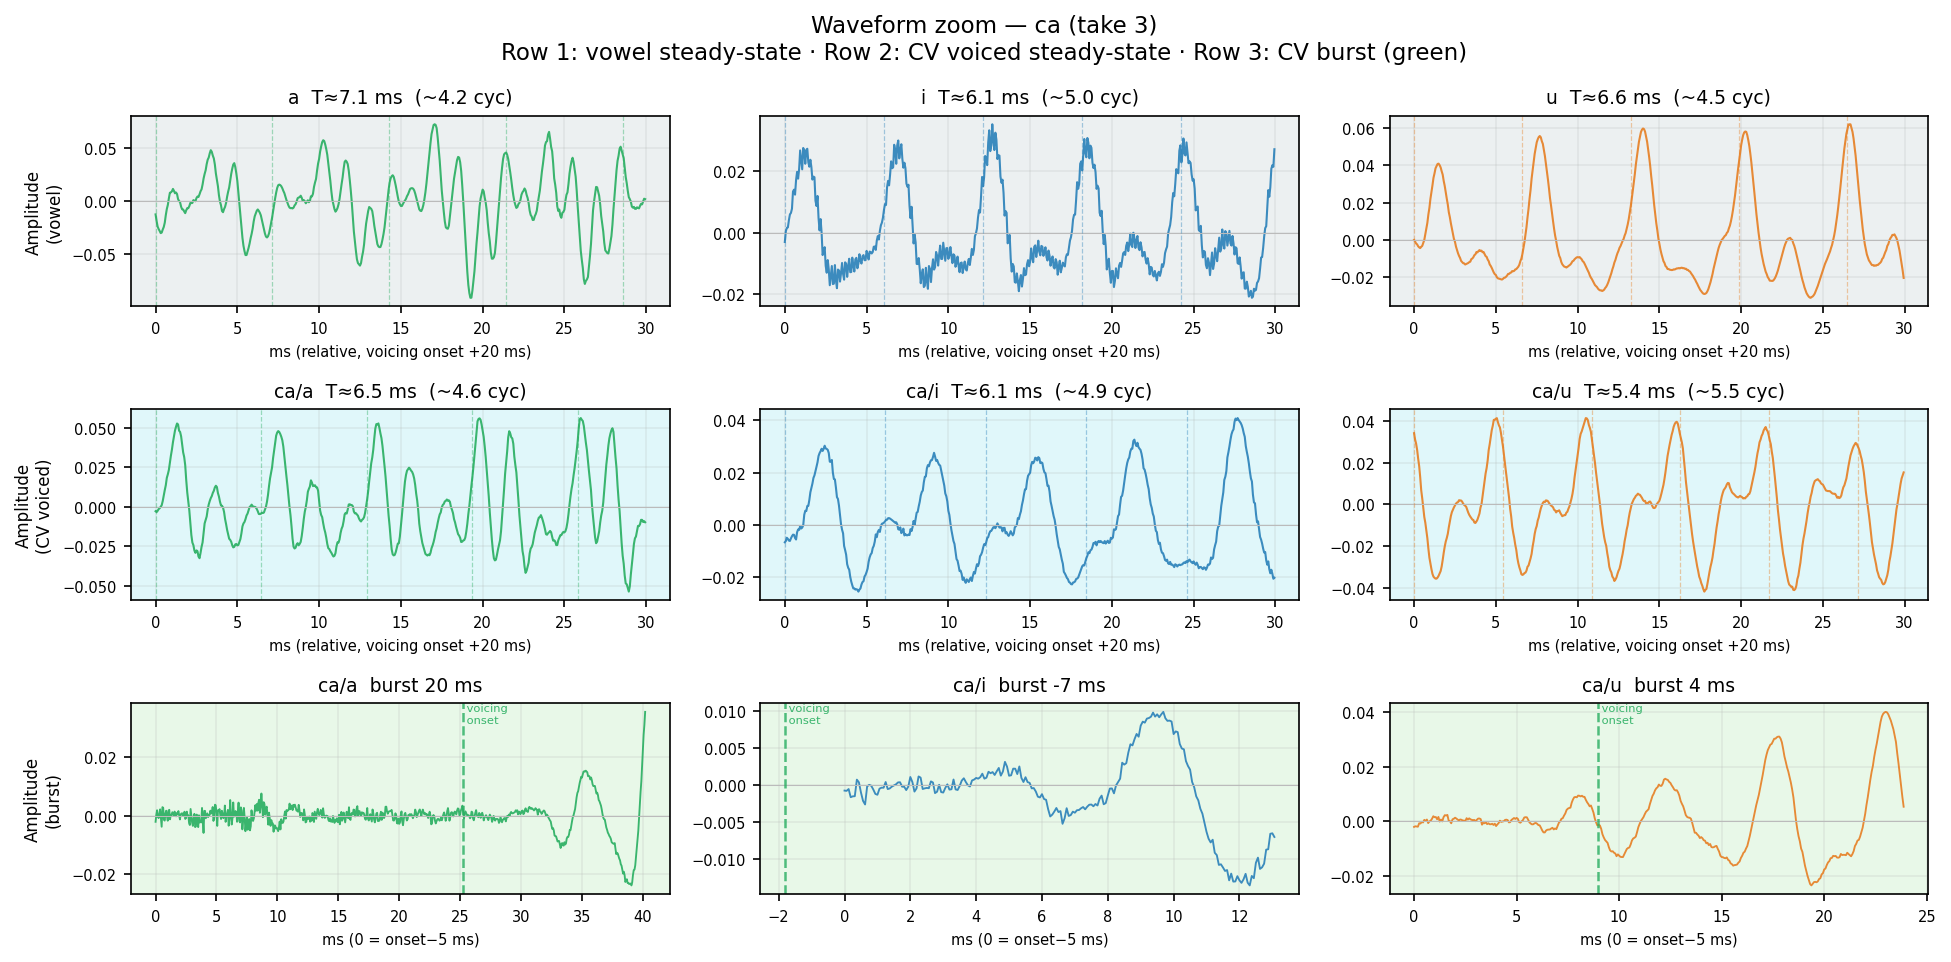
Human take 3
Row 1 (gray): Pure vowel steady-state — 30 ms, 20 ms after voicing onset. Row 2 (cyan): CV voiced steady-state — same window, shows vowel after consonant release. Row 3 (green): CV burst — aperiodic noise from stop release → transition to voicing (green dashed line = first voiced frame). Burst shape and duration differ by place of articulation. Dashed verticals in rows 1–2 = expected glottal period T = 1/F0. Waveform complexity = harmonic richness (pure sine = single harmonic; jagged = rich harmonics).
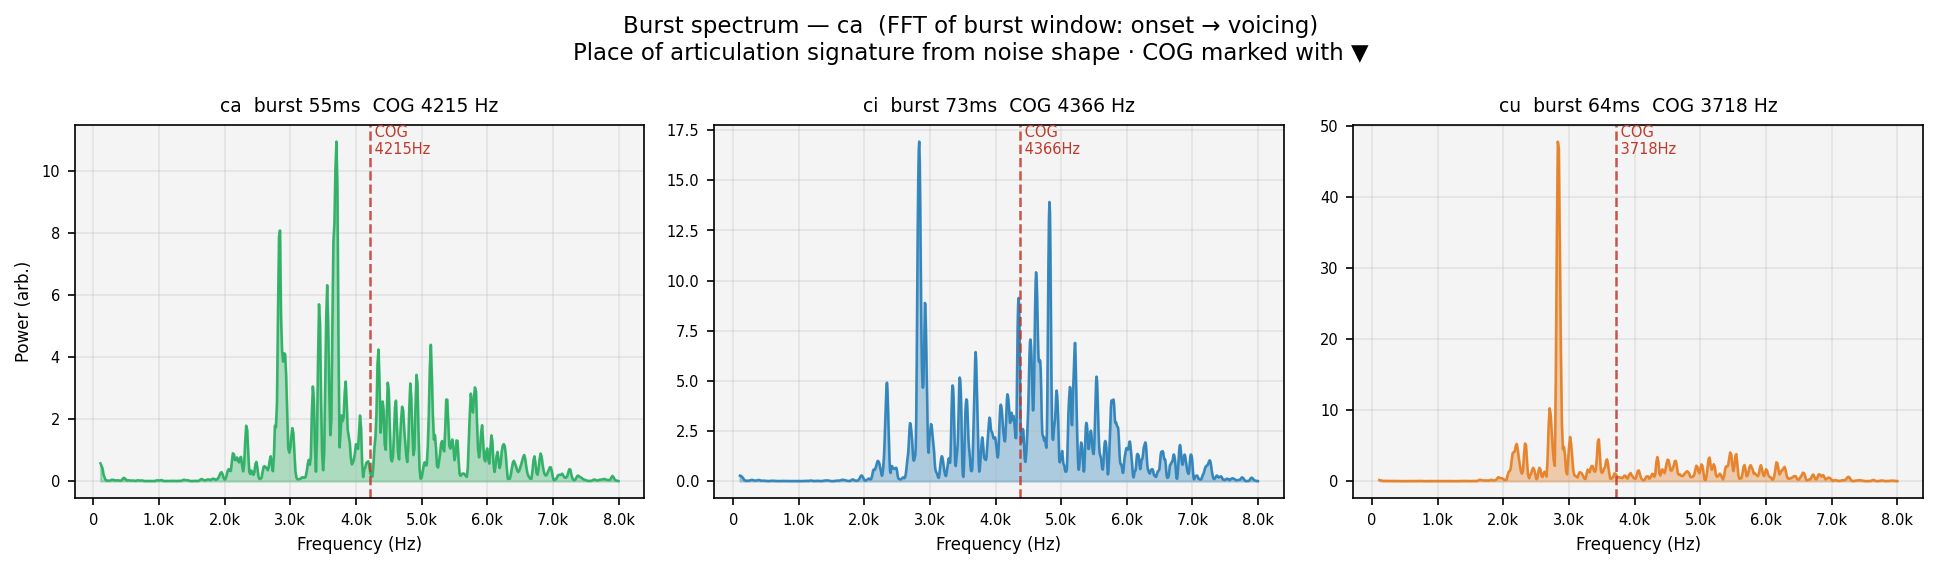
FFT of the aperiodic burst window (speech onset → first voiced frame) for each vowel context. Spectral centre of gravity (COG, red dashed) marks the dominant noise frequency — a place-of-articulation signature independent of the vowel. Velars peak mid-frequency (~1–2 kHz); dentals/alveolars peak high (>3 kHz); labials are spectrally flat. COG should be consistent across /a/i/u/ for the same consonant — vowel context should not change where the burst energy is.
Human take 1
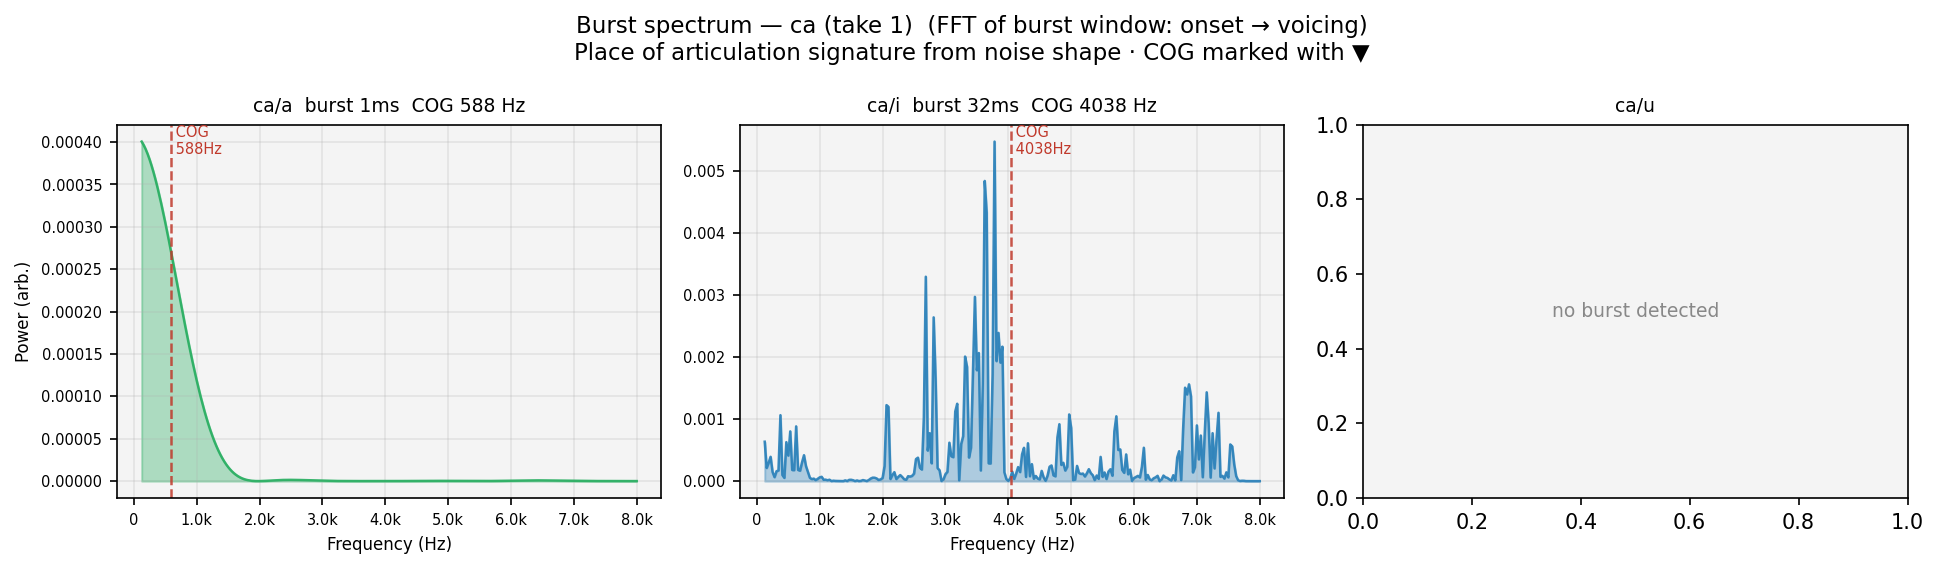
FFT of the aperiodic burst window (speech onset → first voiced frame) for each vowel context. Spectral centre of gravity (COG, red dashed) marks the dominant noise frequency — a place-of-articulation signature independent of the vowel. Velars peak mid-frequency (~1–2 kHz); dentals/alveolars peak high (>3 kHz); labials are spectrally flat. COG should be consistent across /a/i/u/ for the same consonant — vowel context should not change where the burst energy is.
Human take 2
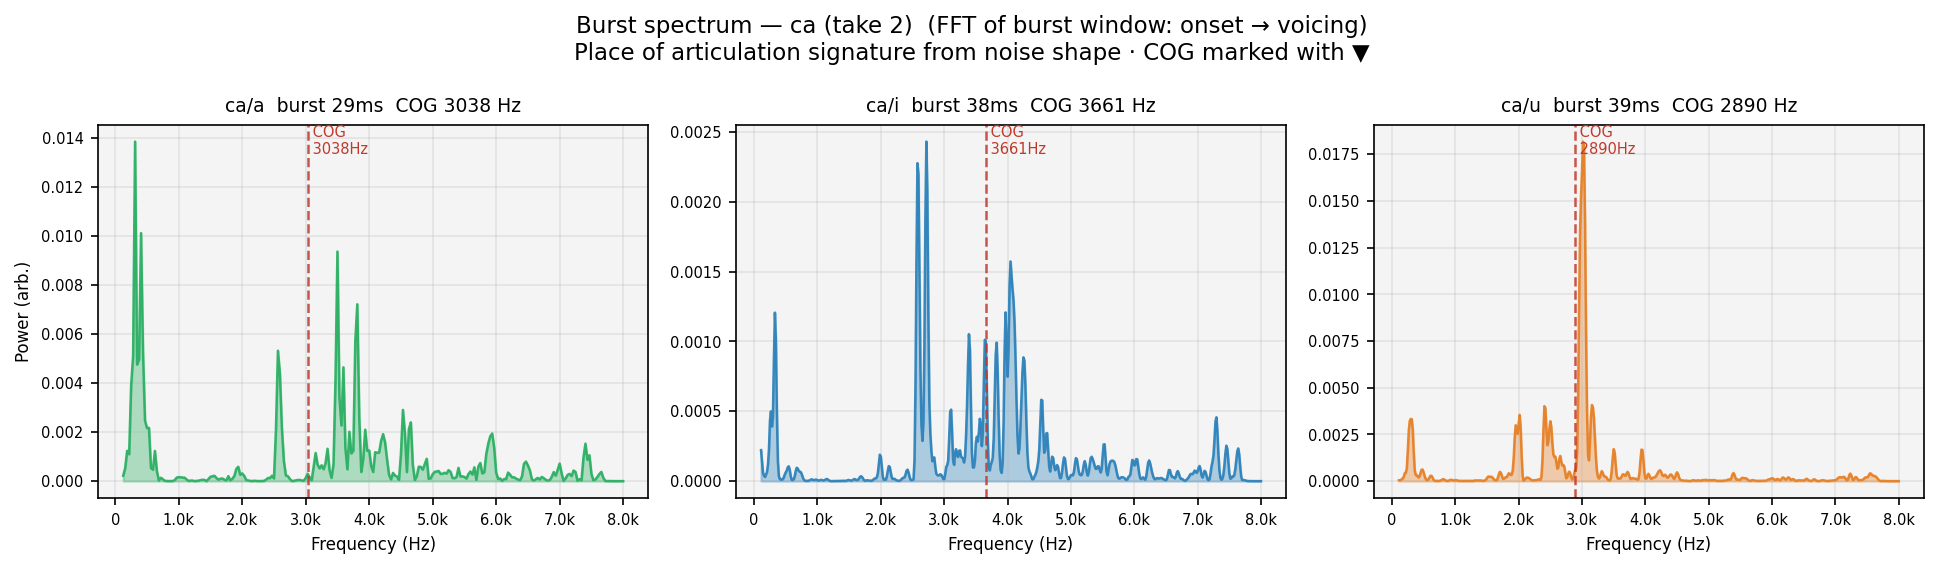
FFT of the aperiodic burst window (speech onset → first voiced frame) for each vowel context. Spectral centre of gravity (COG, red dashed) marks the dominant noise frequency — a place-of-articulation signature independent of the vowel. Velars peak mid-frequency (~1–2 kHz); dentals/alveolars peak high (>3 kHz); labials are spectrally flat. COG should be consistent across /a/i/u/ for the same consonant — vowel context should not change where the burst energy is.
Human take 3
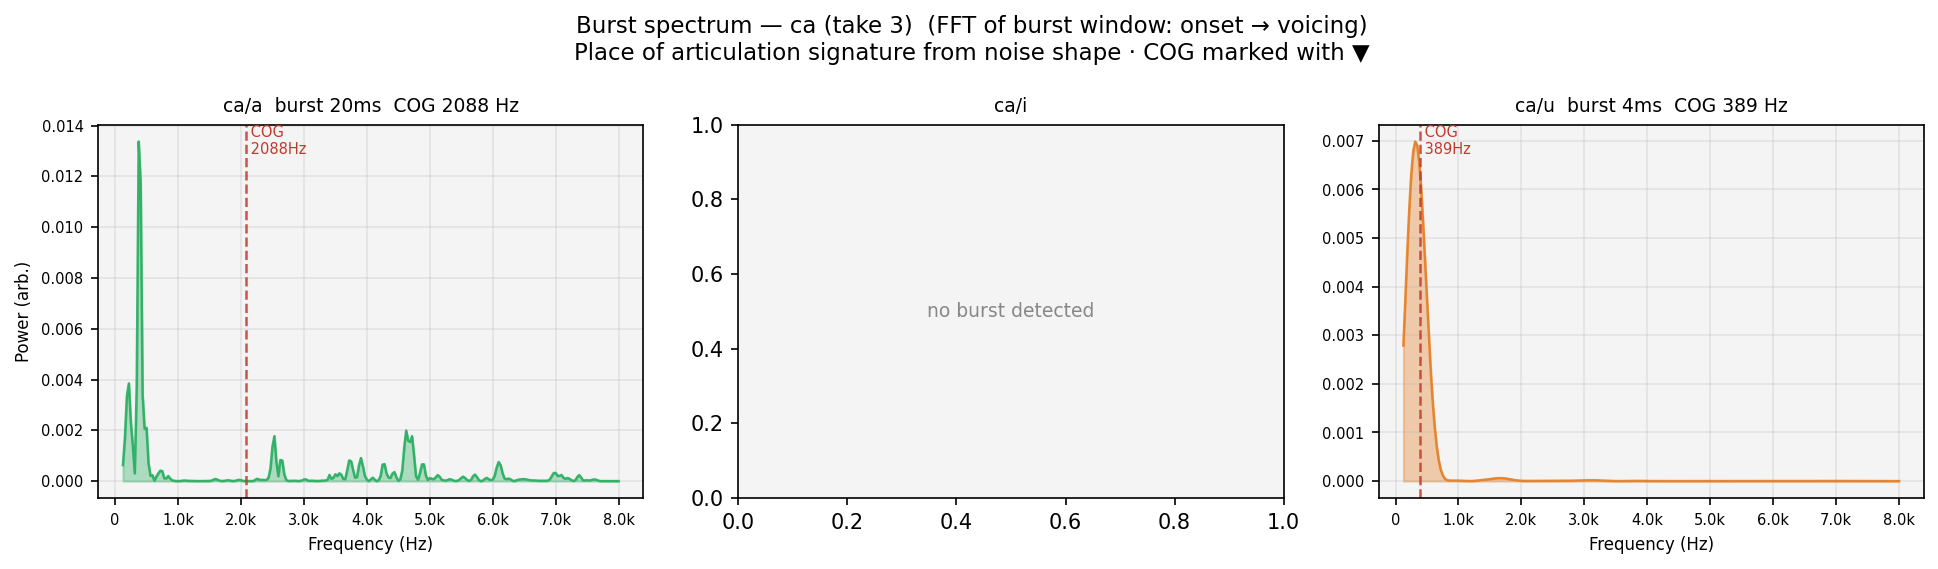
FFT of the aperiodic burst window (speech onset → first voiced frame) for each vowel context. Spectral centre of gravity (COG, red dashed) marks the dominant noise frequency — a place-of-articulation signature independent of the vowel. Velars peak mid-frequency (~1–2 kHz); dentals/alveolars peak high (>3 kHz); labials are spectrally flat. COG should be consistent across /a/i/u/ for the same consonant — vowel context should not change where the burst energy is.
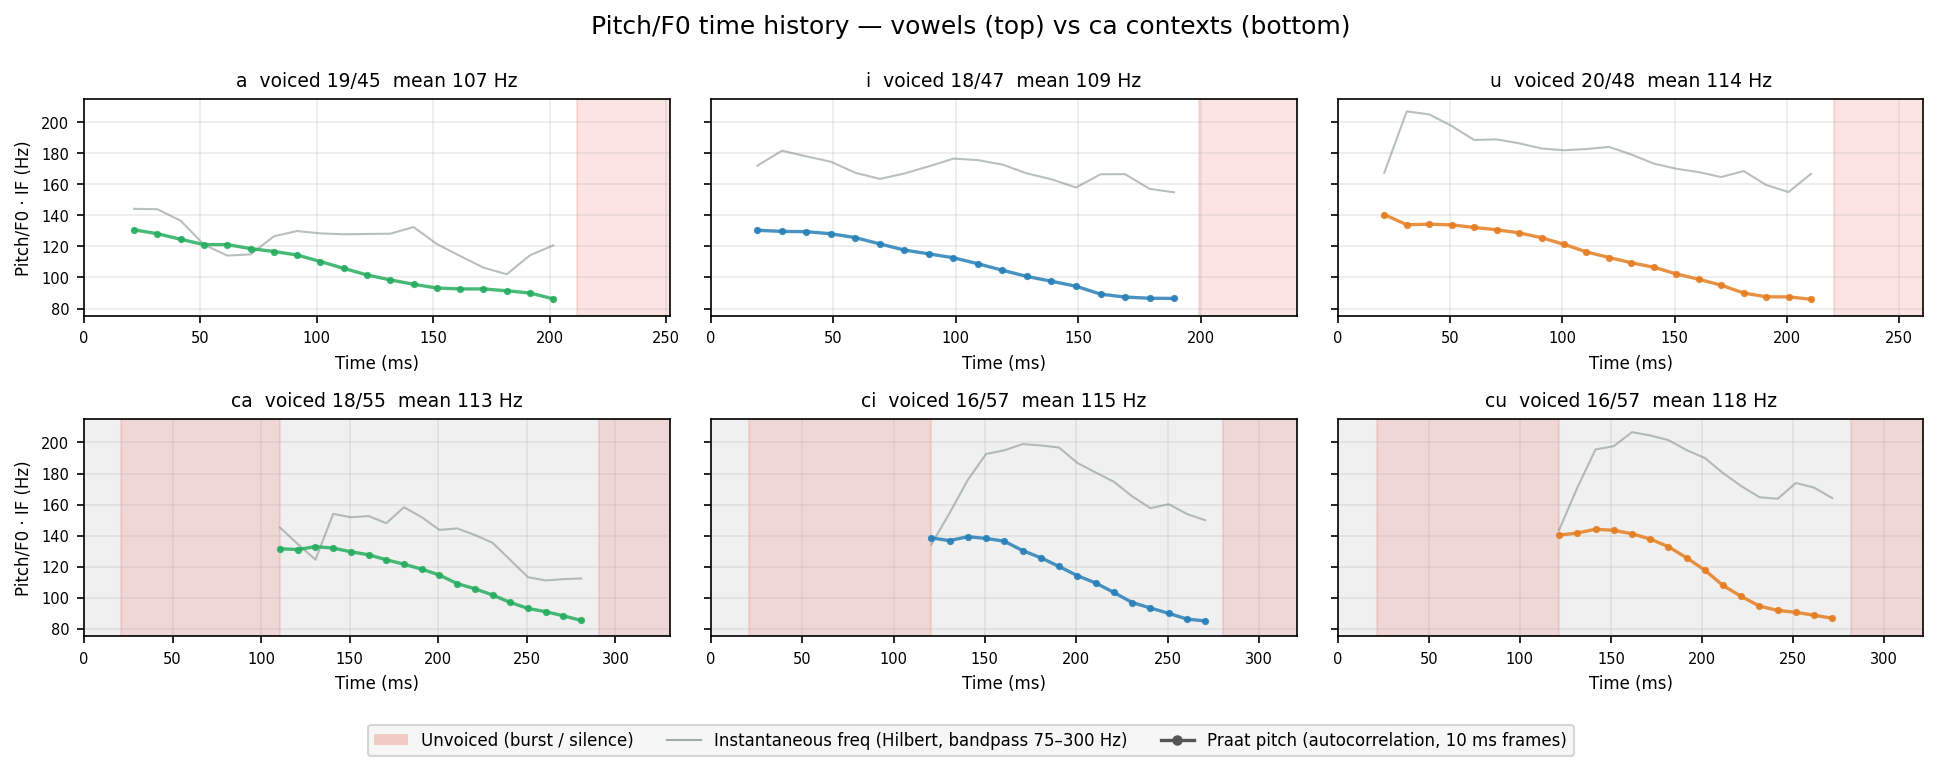
Colored dots = Praat pitch (autocorrelation, 10 ms frames). Gray line = instantaneous frequency (Hilbert transform on 75–300 Hz bandpass). Both show F0 region — IF is noisier; Praat smooths by choosing the most periodic candidate. Red shade = unvoiced (burst / silence).
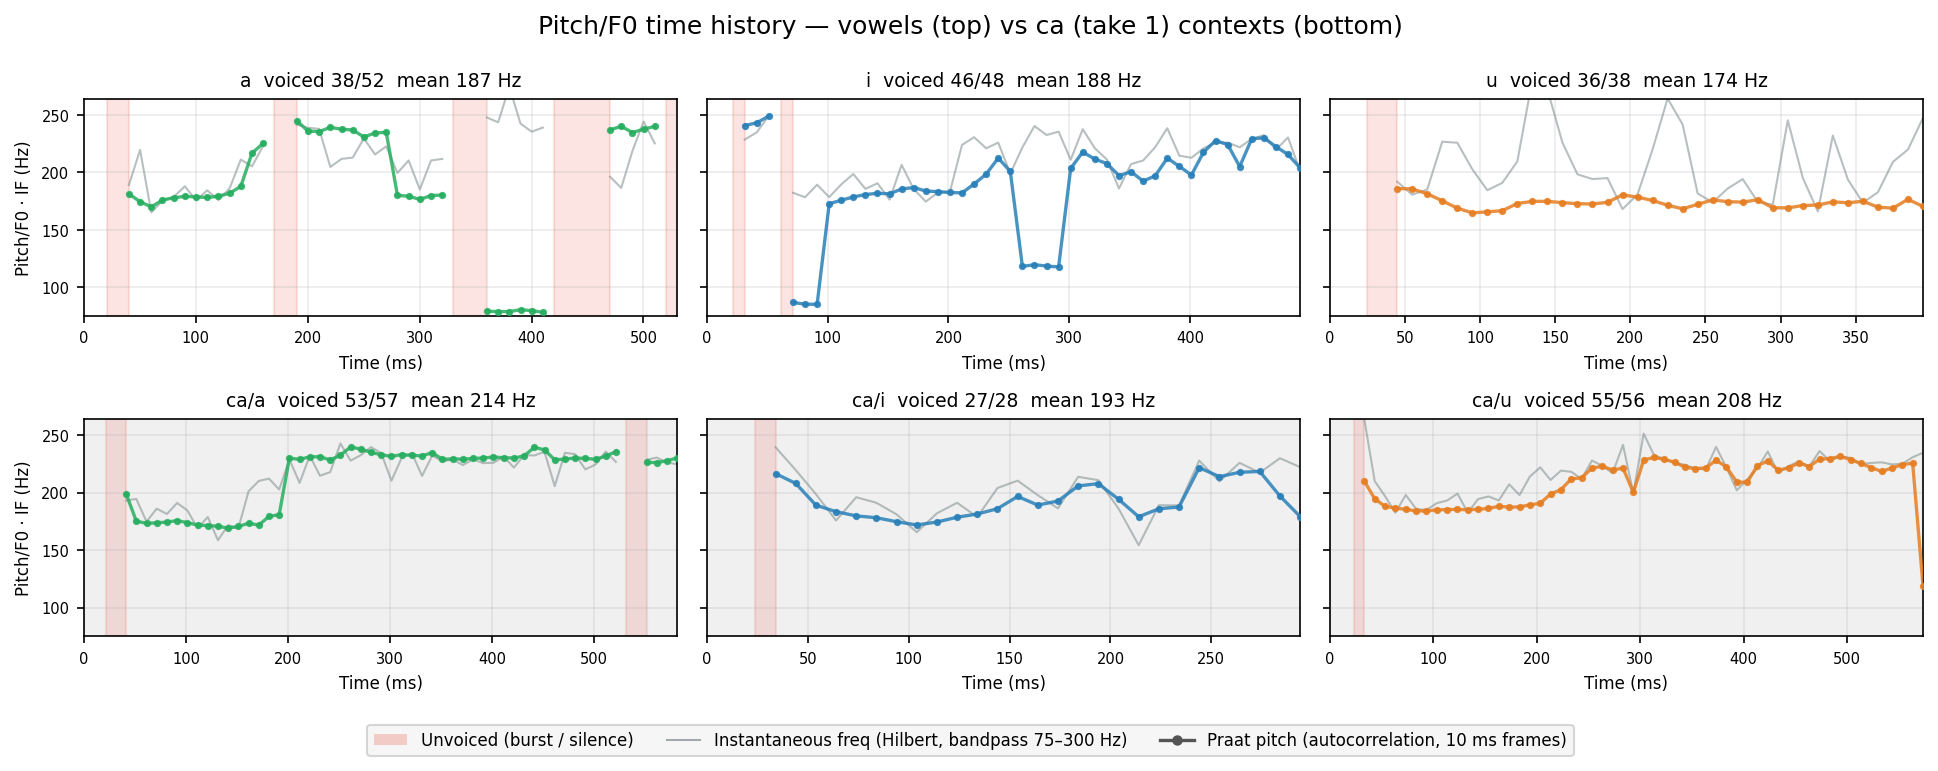
Human take 1
Colored dots = Praat pitch (autocorrelation, 10 ms frames). Gray line = instantaneous frequency (Hilbert transform on 75–300 Hz bandpass). Both show F0 region — IF is noisier; Praat smooths by choosing the most periodic candidate. Red shade = unvoiced (burst / silence).
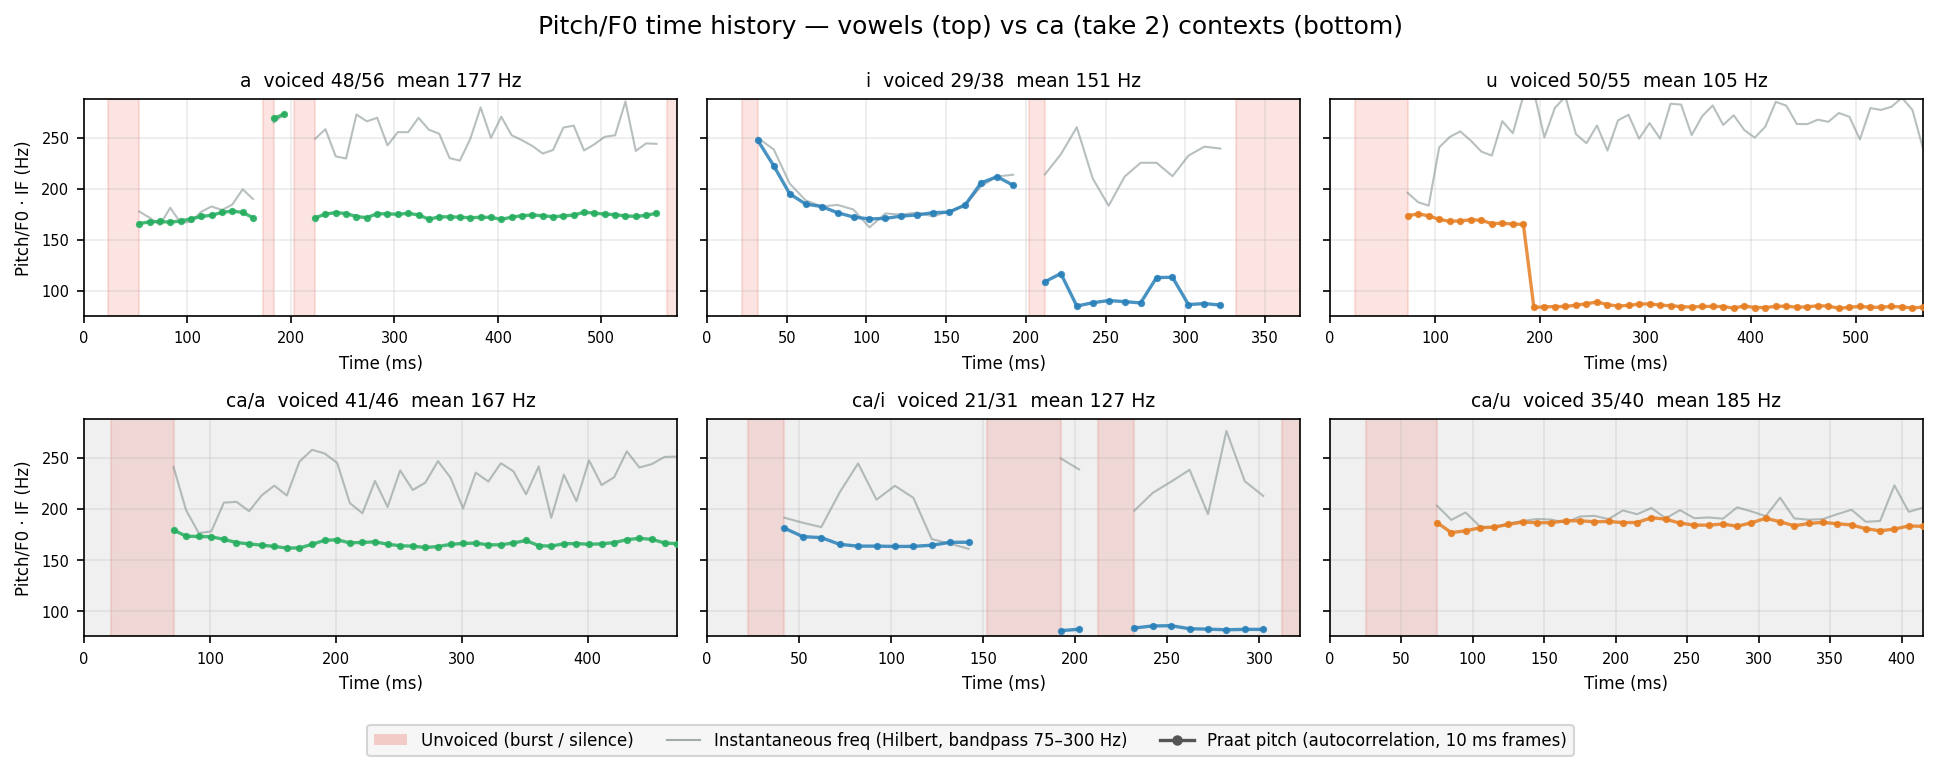
Human take 2
Colored dots = Praat pitch (autocorrelation, 10 ms frames). Gray line = instantaneous frequency (Hilbert transform on 75–300 Hz bandpass). Both show F0 region — IF is noisier; Praat smooths by choosing the most periodic candidate. Red shade = unvoiced (burst / silence).
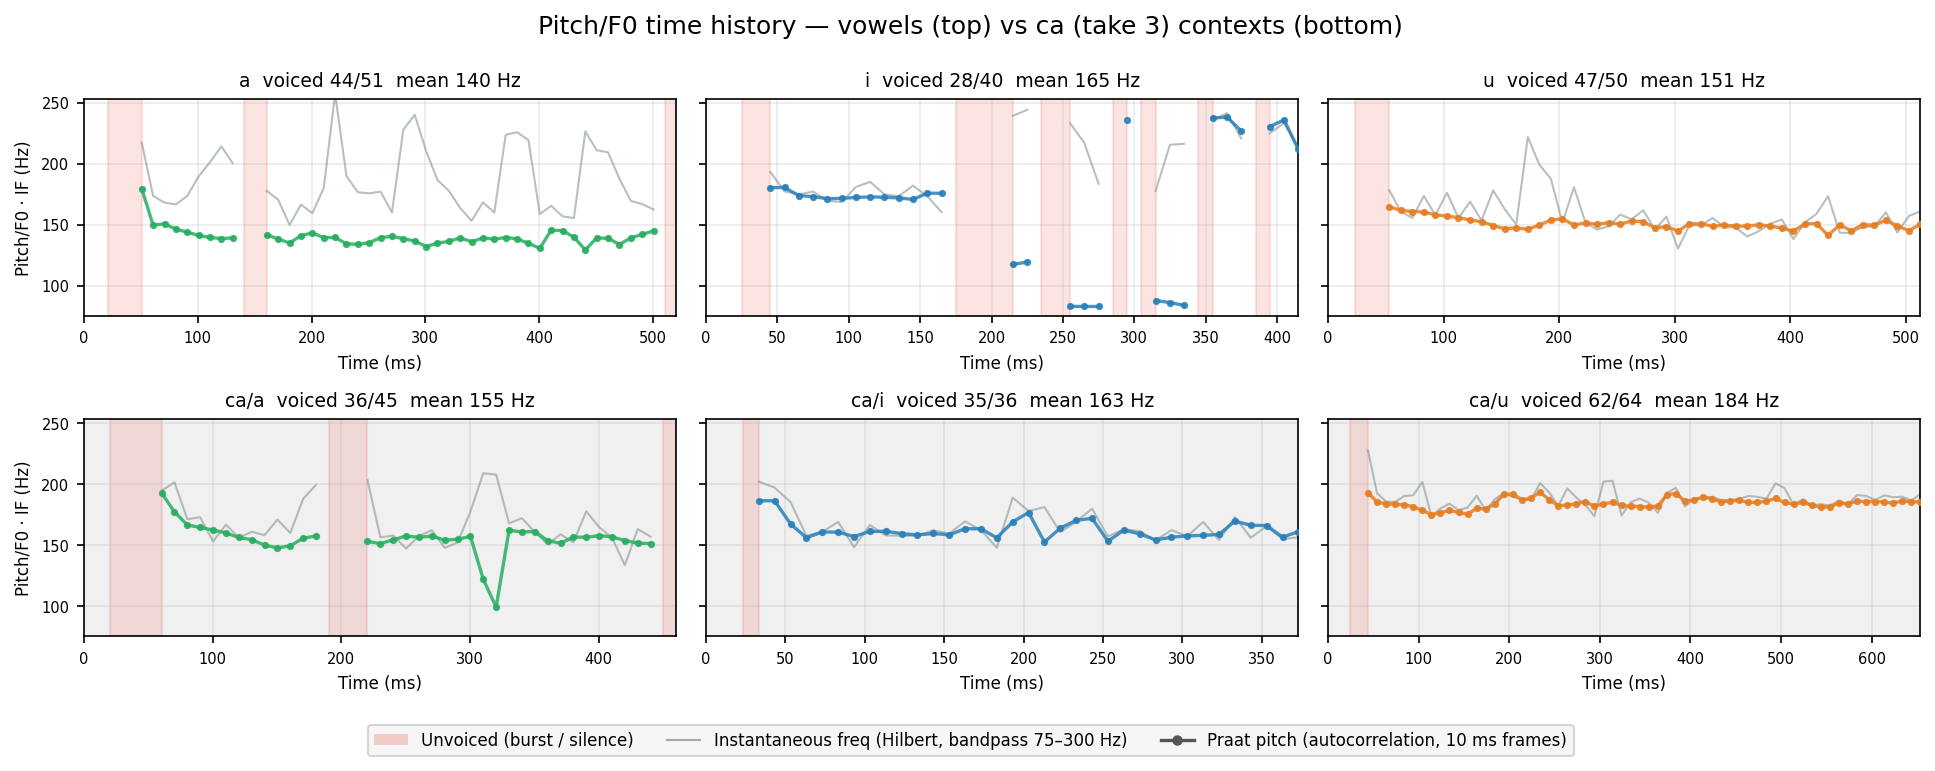
Human take 3
Colored dots = Praat pitch (autocorrelation, 10 ms frames). Gray line = instantaneous frequency (Hilbert transform on 75–300 Hz bandpass). Both show F0 region — IF is noisier; Praat smooths by choosing the most periodic candidate. Red shade = unvoiced (burst / silence).
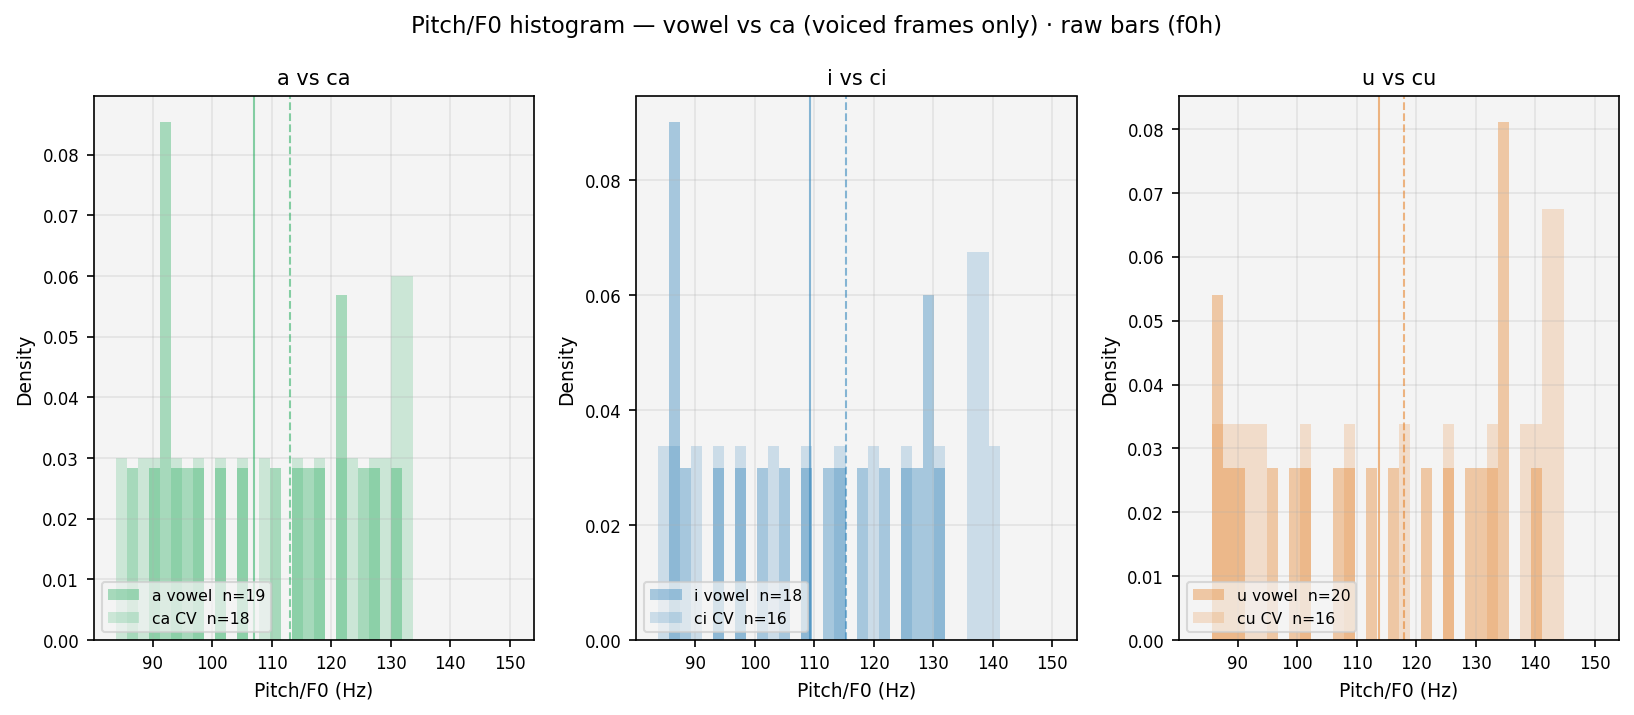
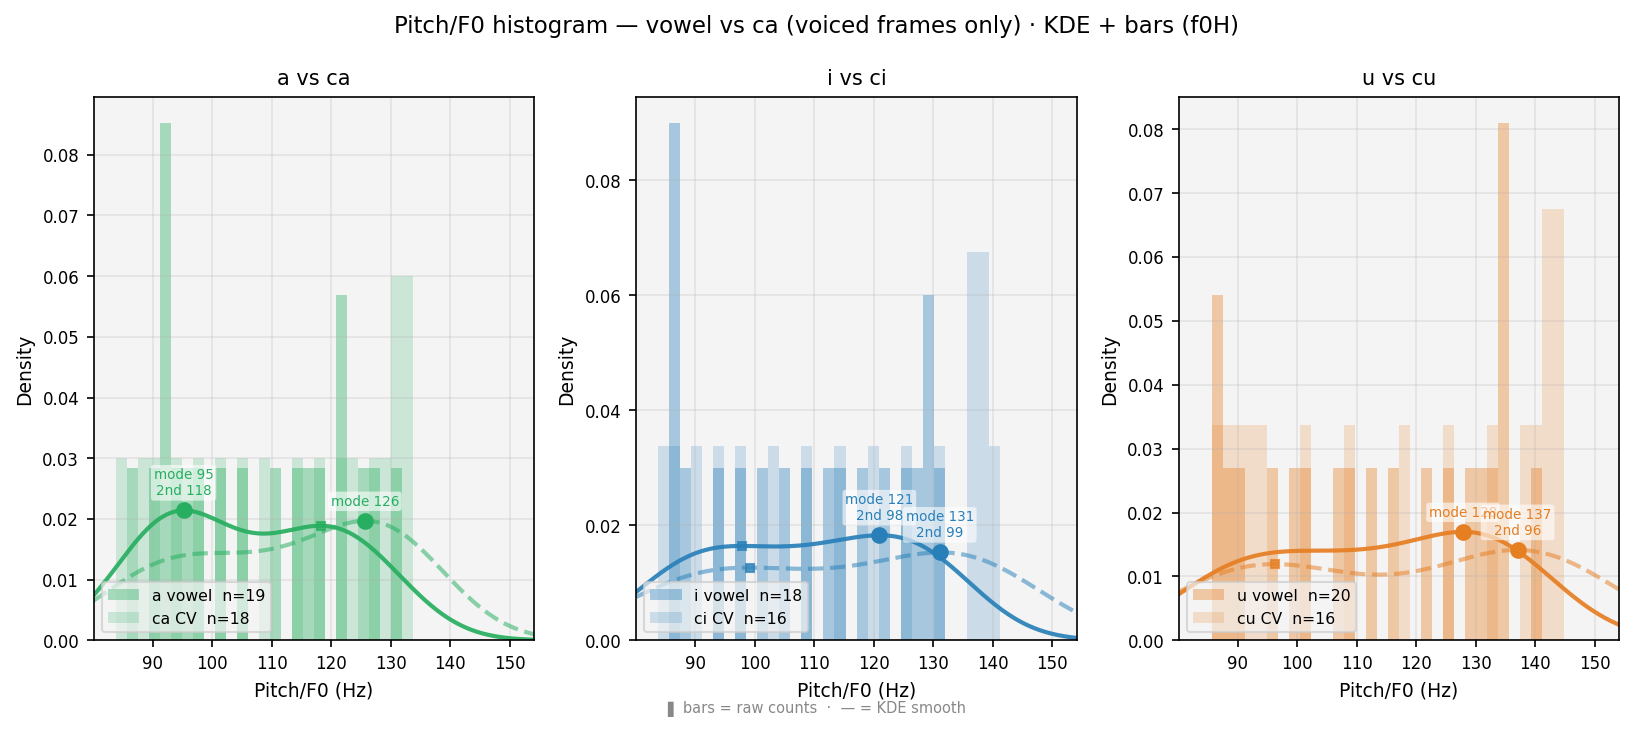
Smoothed histogram (each curve = bars drawn as a continuous line to avoid clutter from overlapping bars). Solid = vowel · Dashed = CV · voiced frames only. ● = primary peak (mode, most frequent pitch). ■ = secondary peak (onset elevation, smaller square). Thin verticals = means. Burst frames absent: voiceless stops produce no vocal-cord vibration — Praat returns NaN, so those frames never enter this plot.
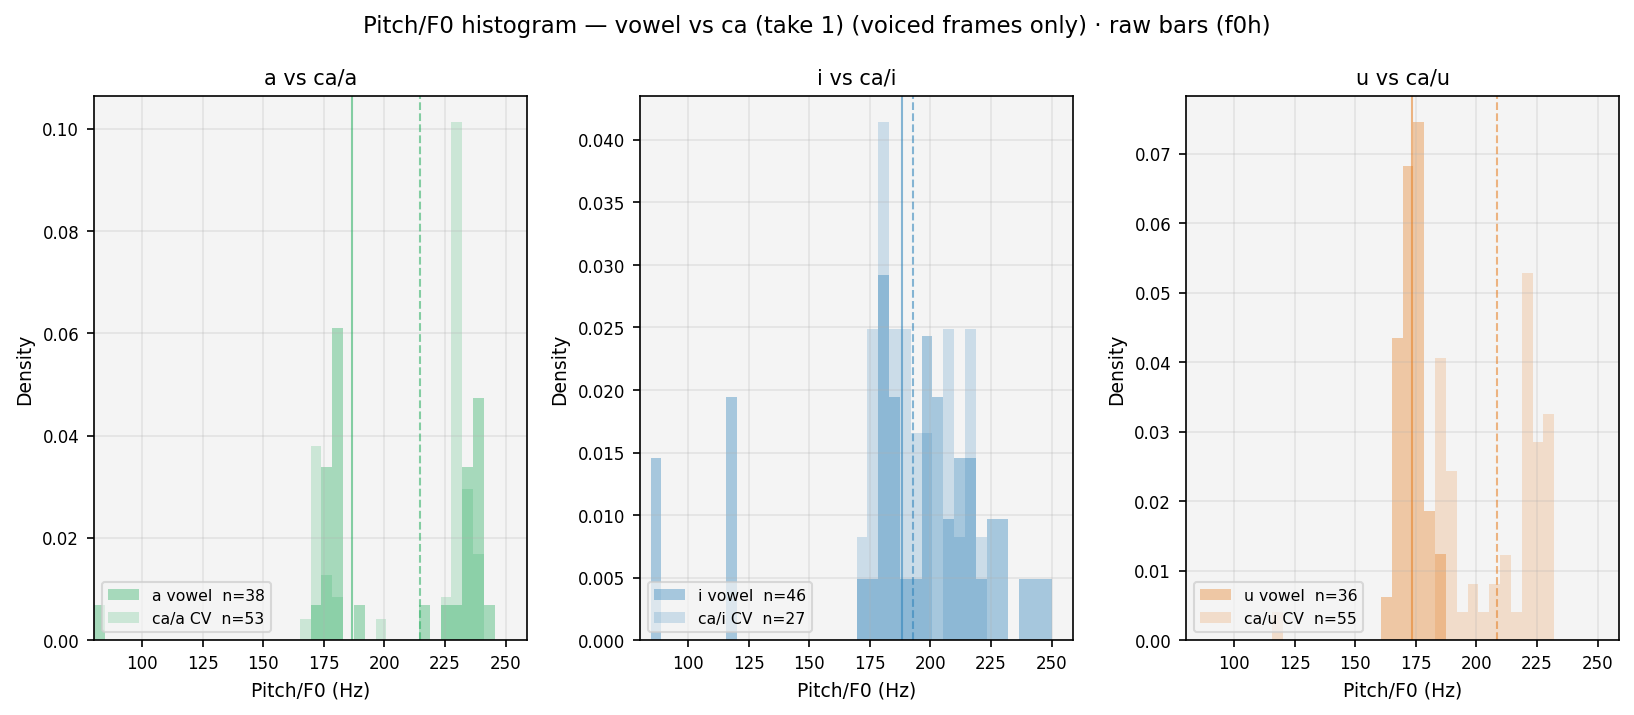
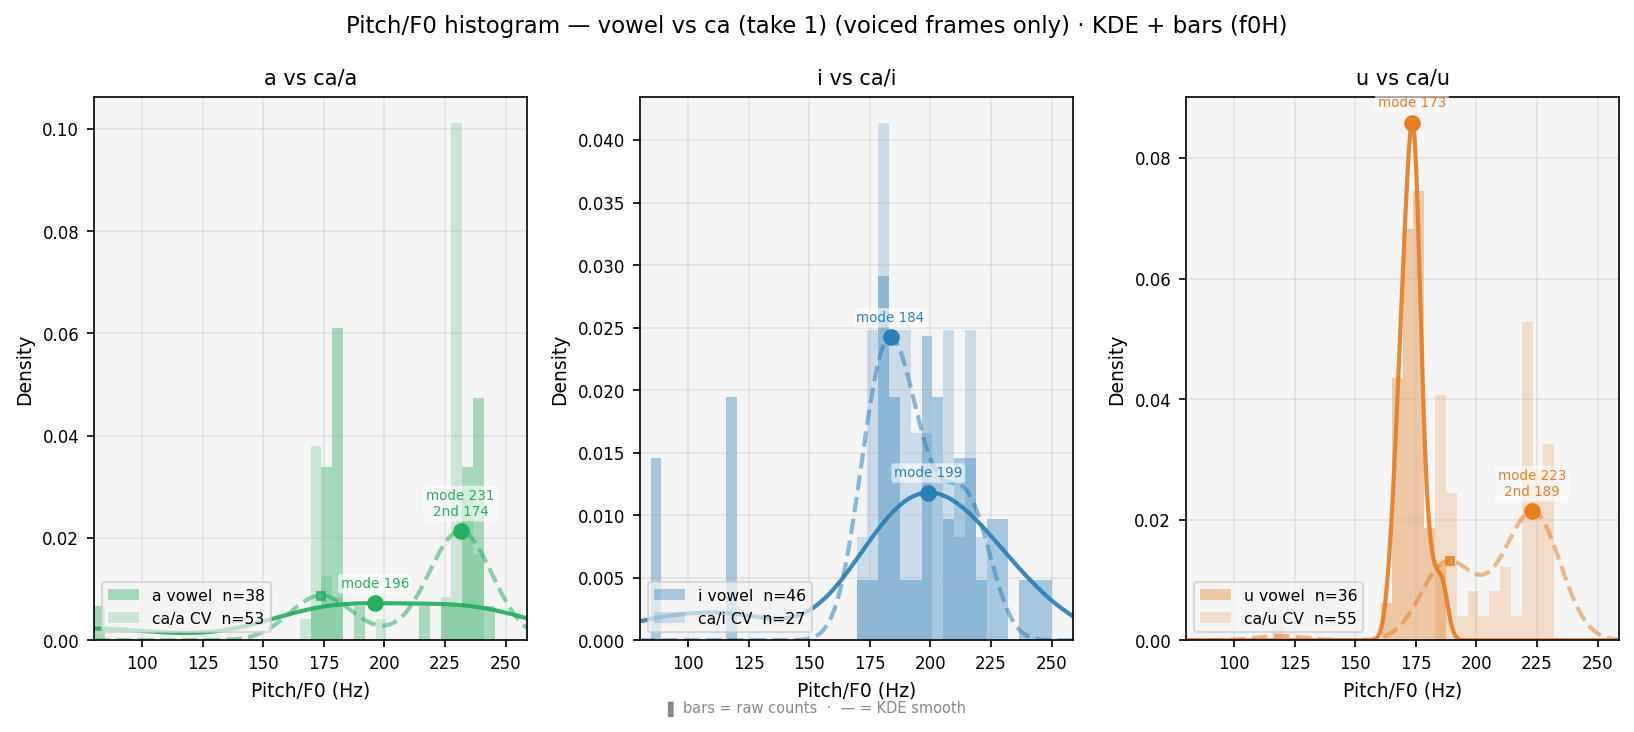
Smoothed histogram (each curve = bars drawn as a continuous line to avoid clutter from overlapping bars). Solid = vowel · Dashed = CV · voiced frames only. ● = primary peak (mode, most frequent pitch). ■ = secondary peak (onset elevation, smaller square). Thin verticals = means. Burst frames absent: voiceless stops produce no vocal-cord vibration — Praat returns NaN, so those frames never enter this plot.
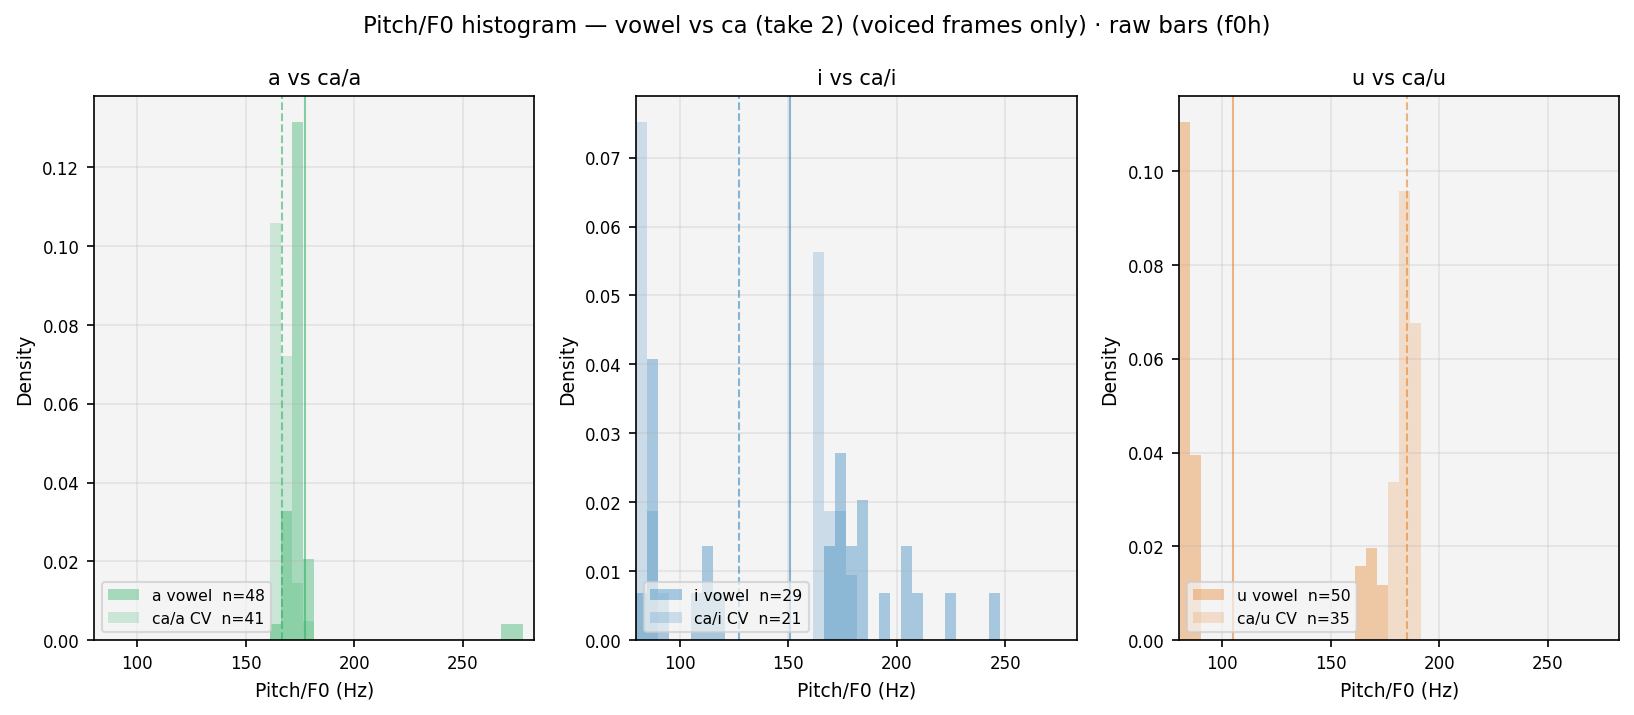
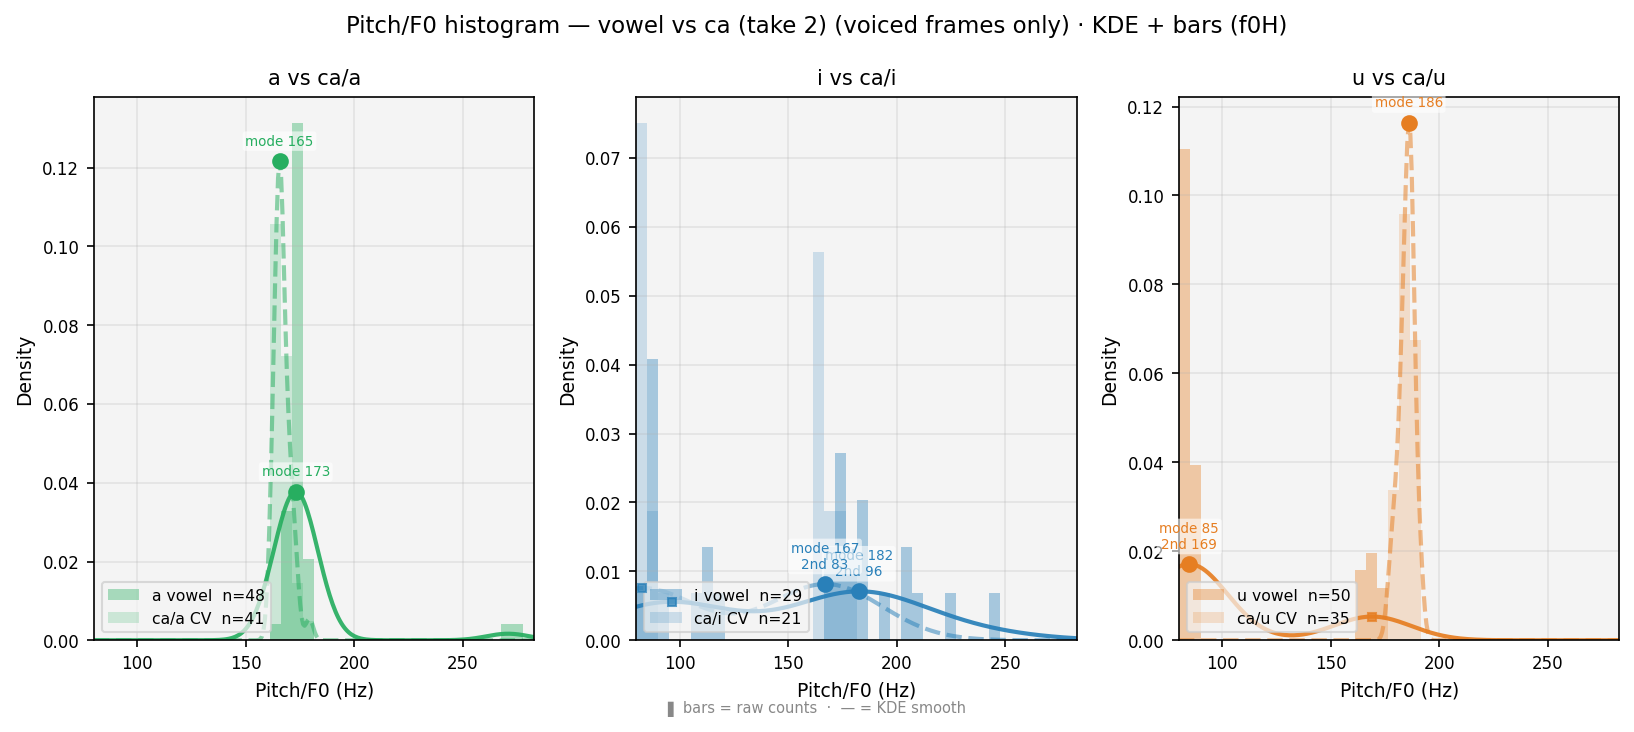
Smoothed histogram (each curve = bars drawn as a continuous line to avoid clutter from overlapping bars). Solid = vowel · Dashed = CV · voiced frames only. ● = primary peak (mode, most frequent pitch). ■ = secondary peak (onset elevation, smaller square). Thin verticals = means. Burst frames absent: voiceless stops produce no vocal-cord vibration — Praat returns NaN, so those frames never enter this plot.
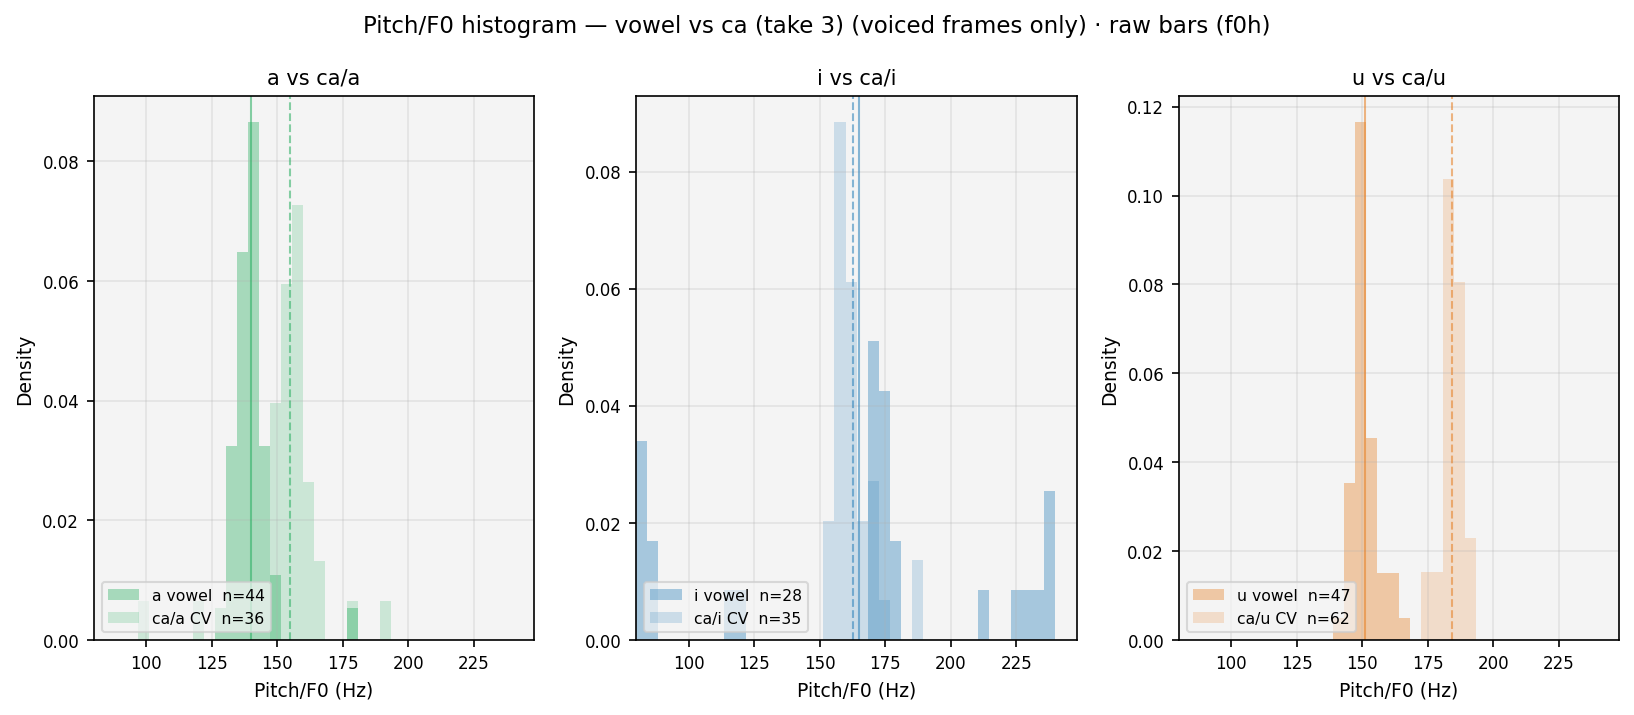
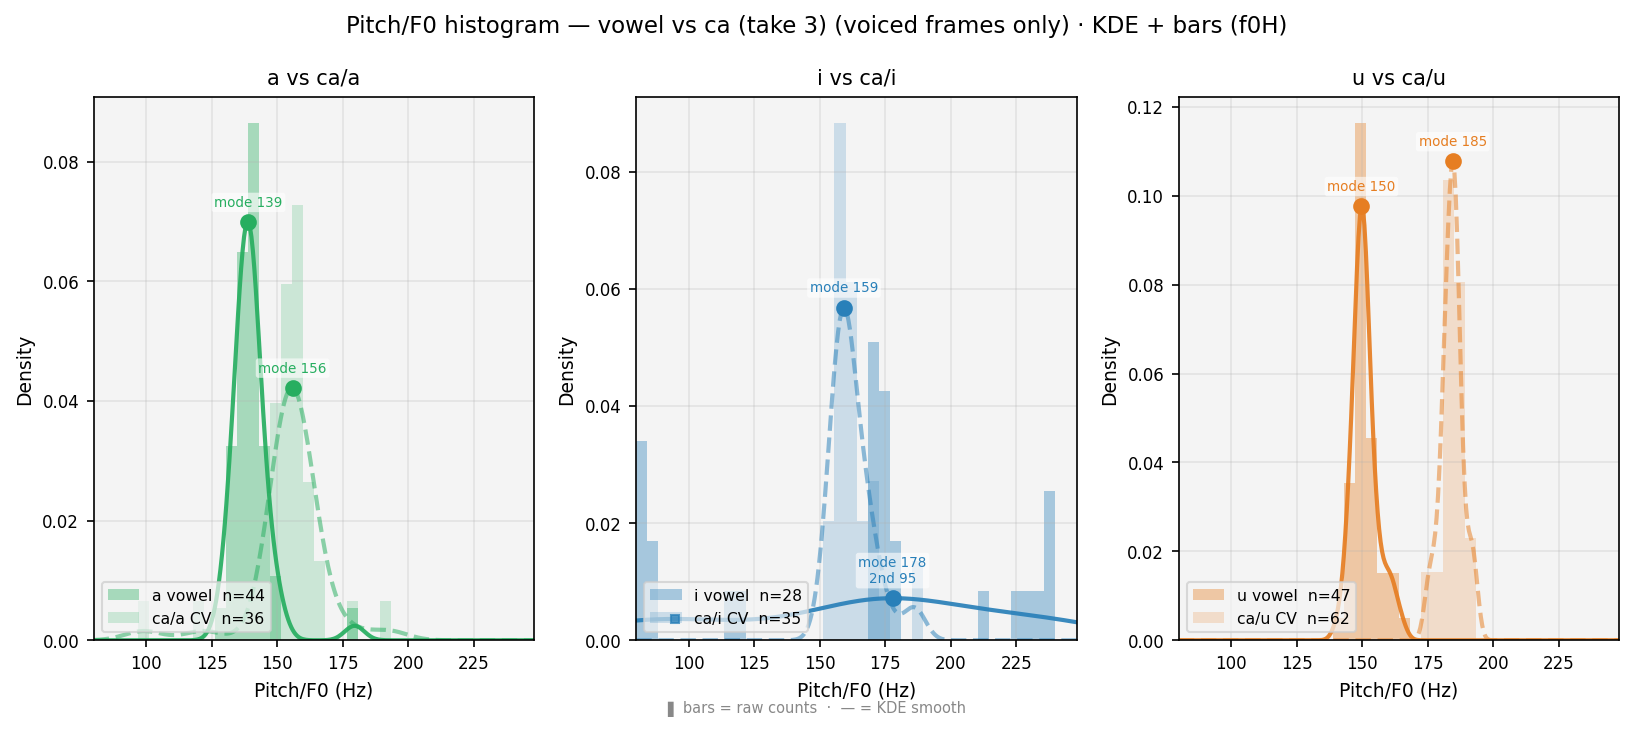
Smoothed histogram (each curve = bars drawn as a continuous line to avoid clutter from overlapping bars). Solid = vowel · Dashed = CV · voiced frames only. ● = primary peak (mode, most frequent pitch). ■ = secondary peak (onset elevation, smaller square). Thin verticals = means. Burst frames absent: voiceless stops produce no vocal-cord vibration — Praat returns NaN, so those frames never enter this plot.
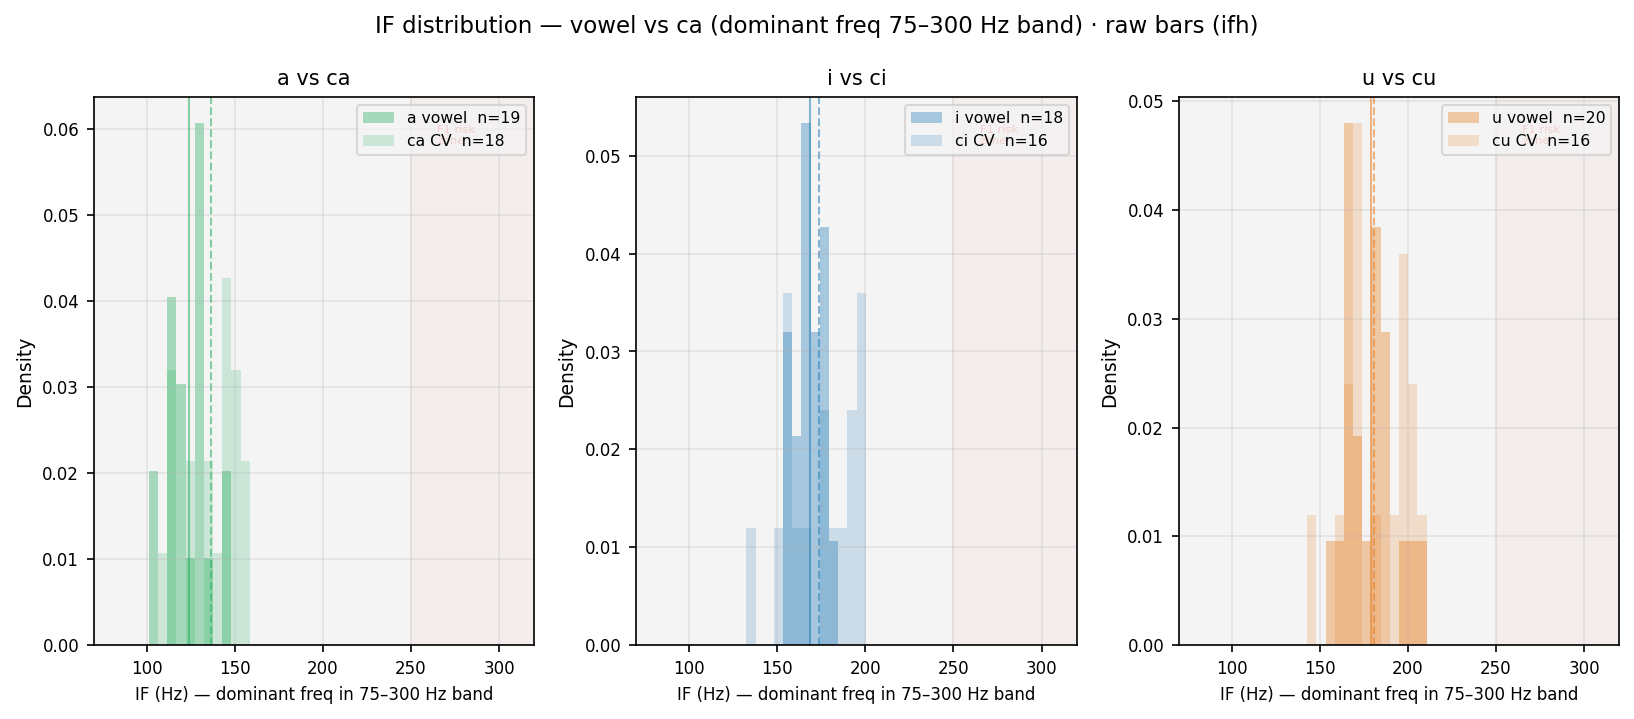
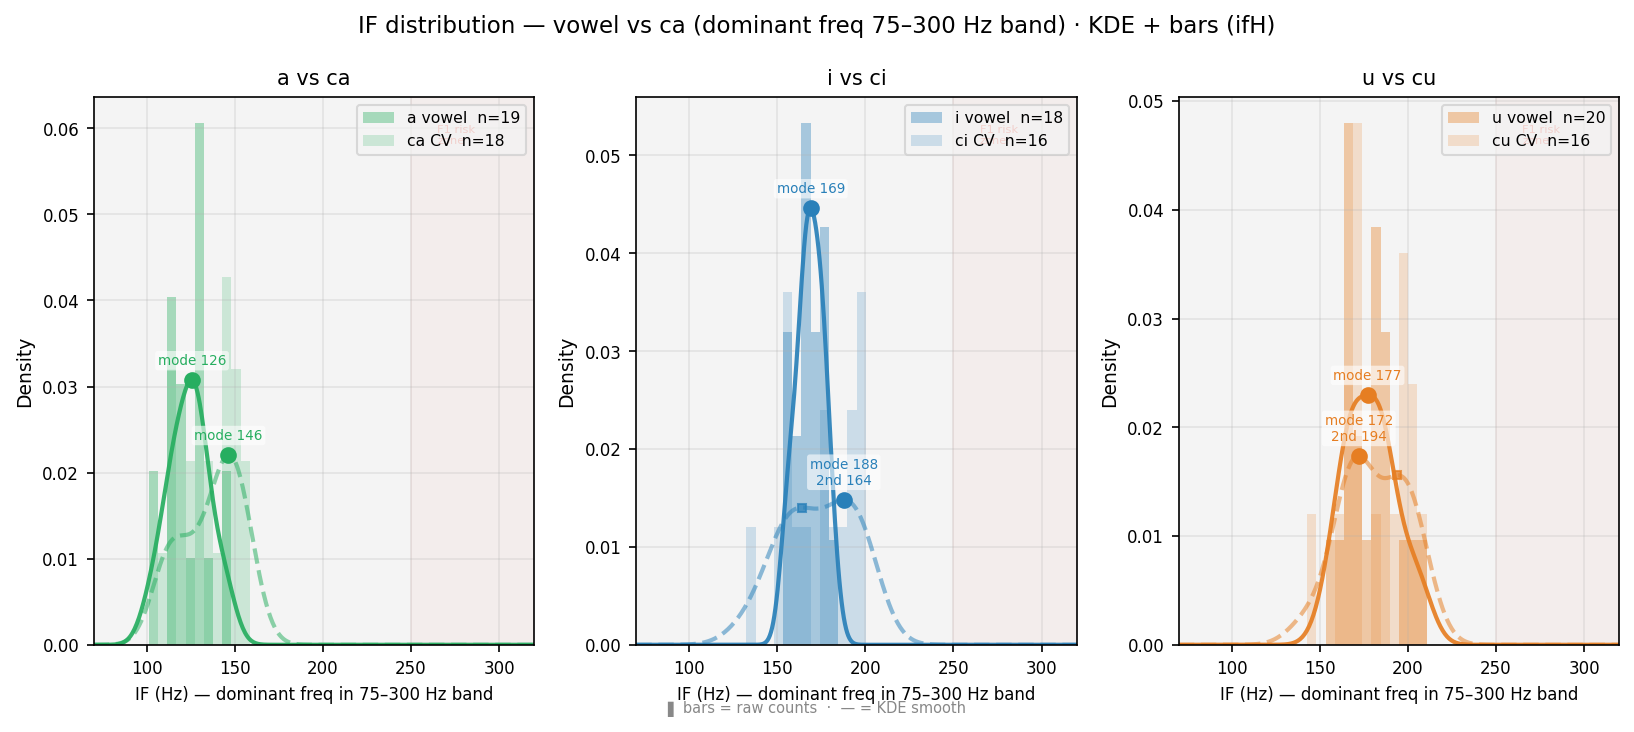
Distribution of instantaneous frequency (Hilbert transform, bandpass 75–300 Hz) at Praat frame rate. For /a/ (F1~800 Hz, outside band): IF tracks F0 — histogram aligns with Praat pitch histogram. For /i/ /u/ (F1~280–300 Hz, inside band): IF may track F1 — red-shaded zone marks this risk. Comparison of vowel vs CV curves shows coarticulation effect on dominant bandpass frequency. ● primary peak · ■ secondary peak.
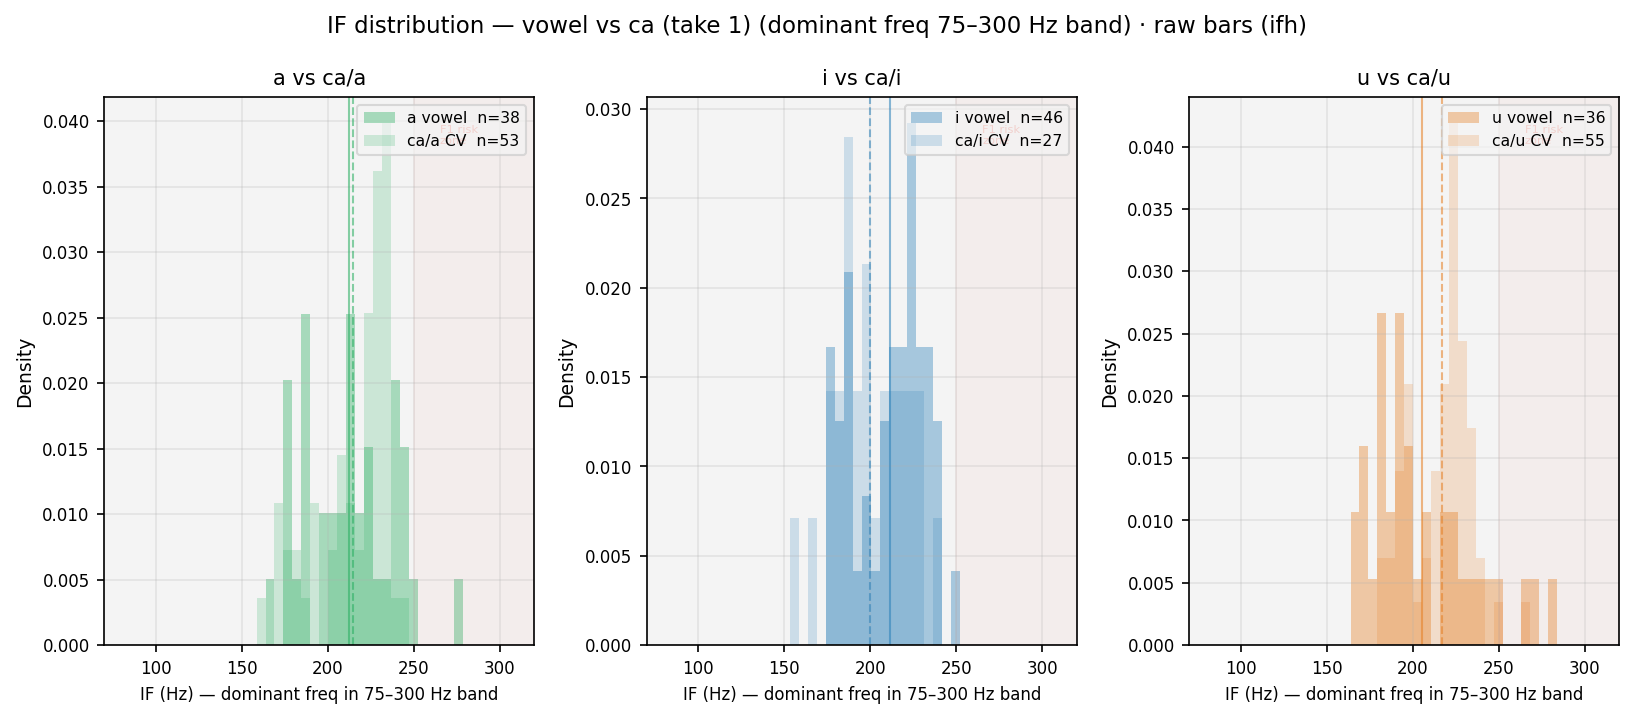
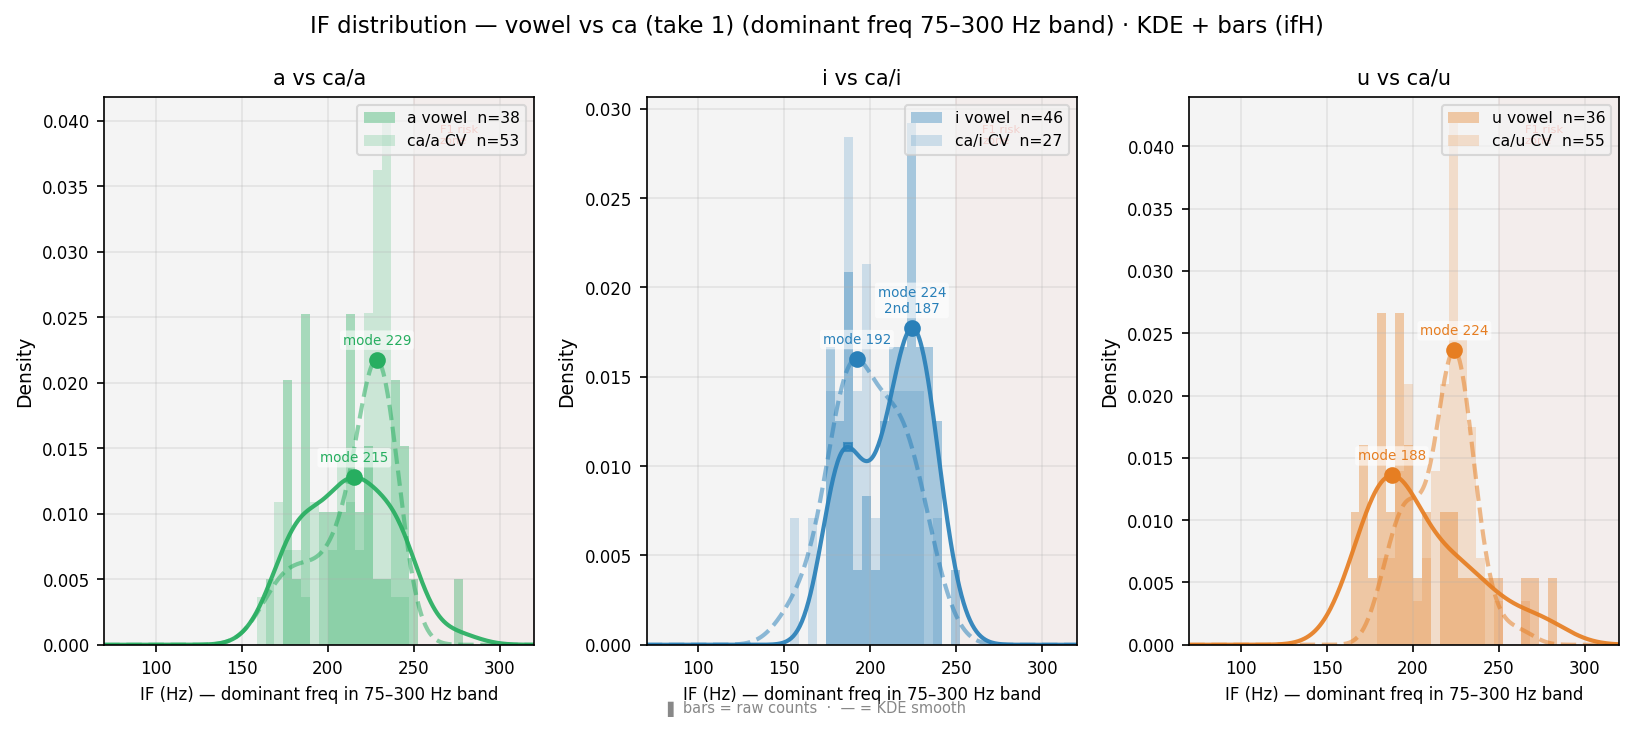
Distribution of instantaneous frequency (Hilbert transform, bandpass 75–300 Hz) at Praat frame rate. For /a/ (F1~800 Hz, outside band): IF tracks F0 — histogram aligns with Praat pitch histogram. For /i/ /u/ (F1~280–300 Hz, inside band): IF may track F1 — red-shaded zone marks this risk. Comparison of vowel vs CV curves shows coarticulation effect on dominant bandpass frequency. ● primary peak · ■ secondary peak.
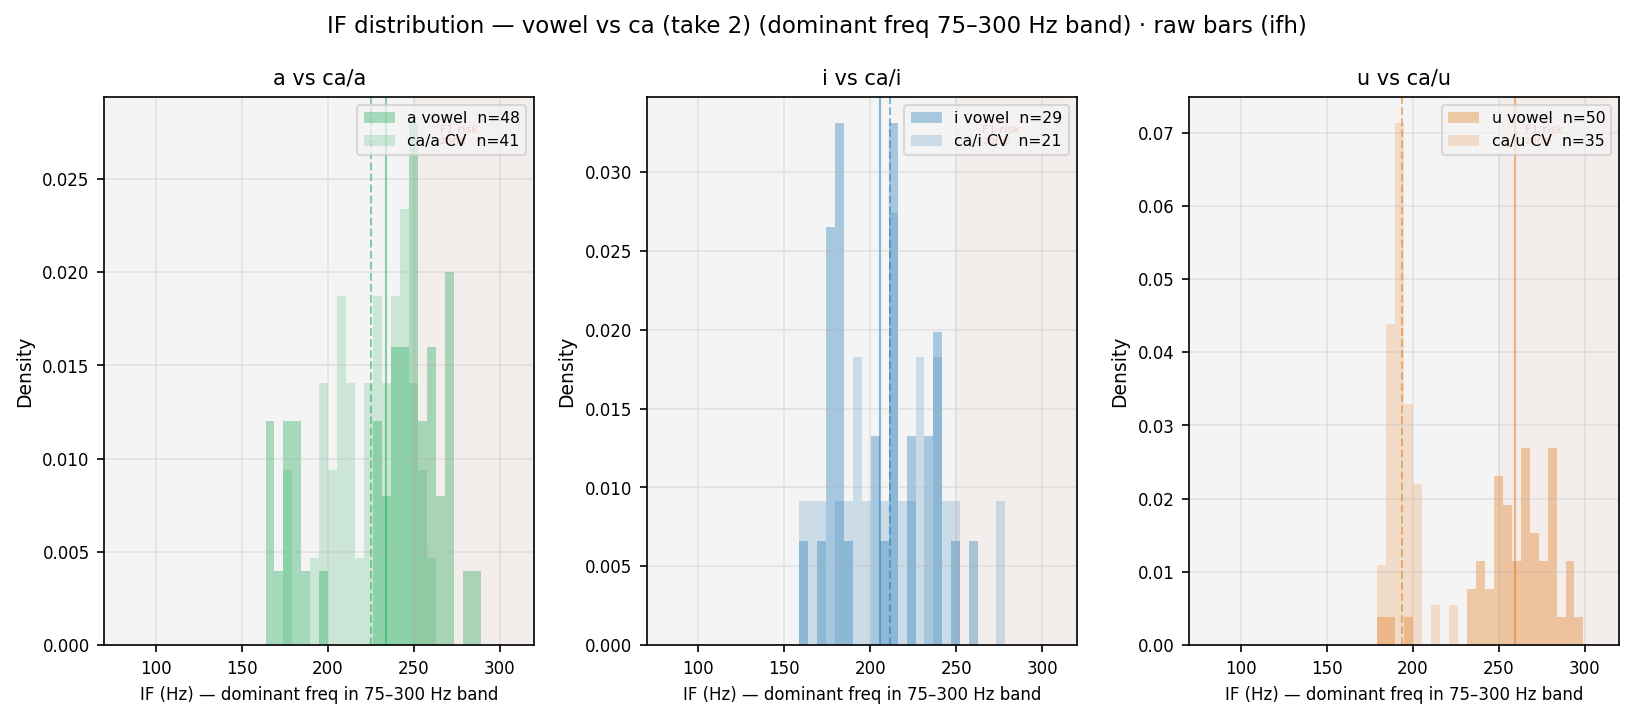
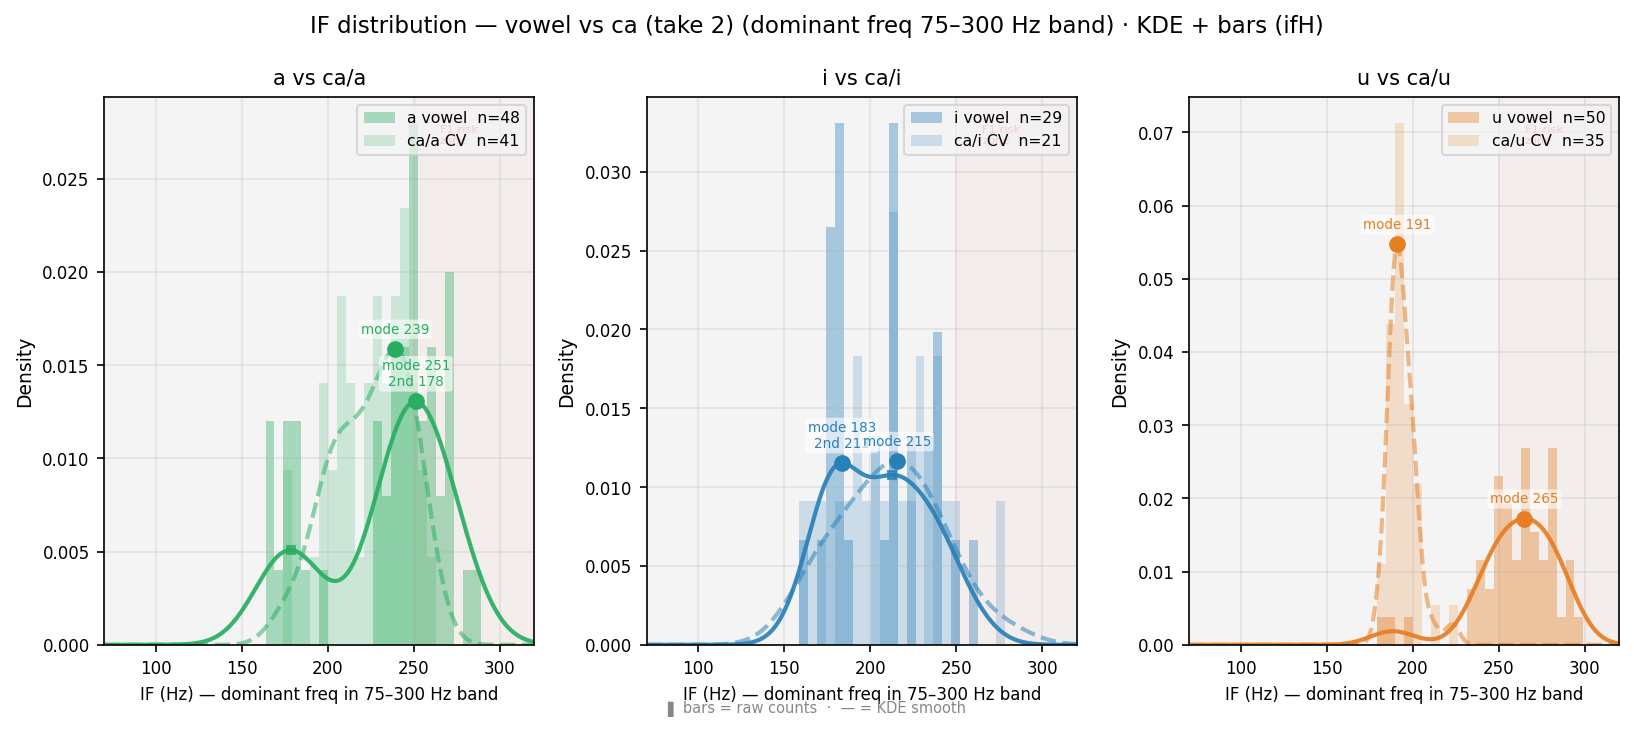
Distribution of instantaneous frequency (Hilbert transform, bandpass 75–300 Hz) at Praat frame rate. For /a/ (F1~800 Hz, outside band): IF tracks F0 — histogram aligns with Praat pitch histogram. For /i/ /u/ (F1~280–300 Hz, inside band): IF may track F1 — red-shaded zone marks this risk. Comparison of vowel vs CV curves shows coarticulation effect on dominant bandpass frequency. ● primary peak · ■ secondary peak.
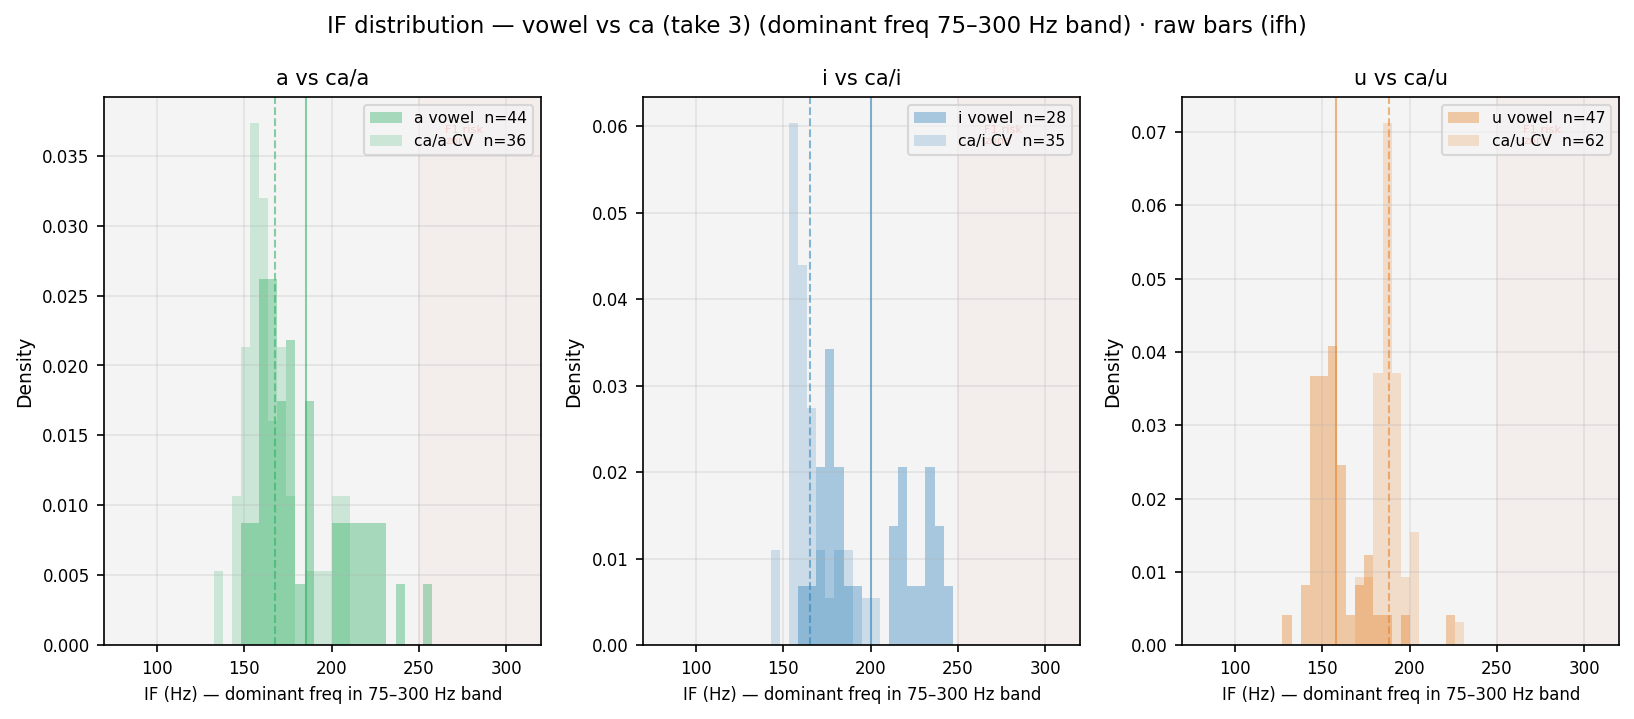
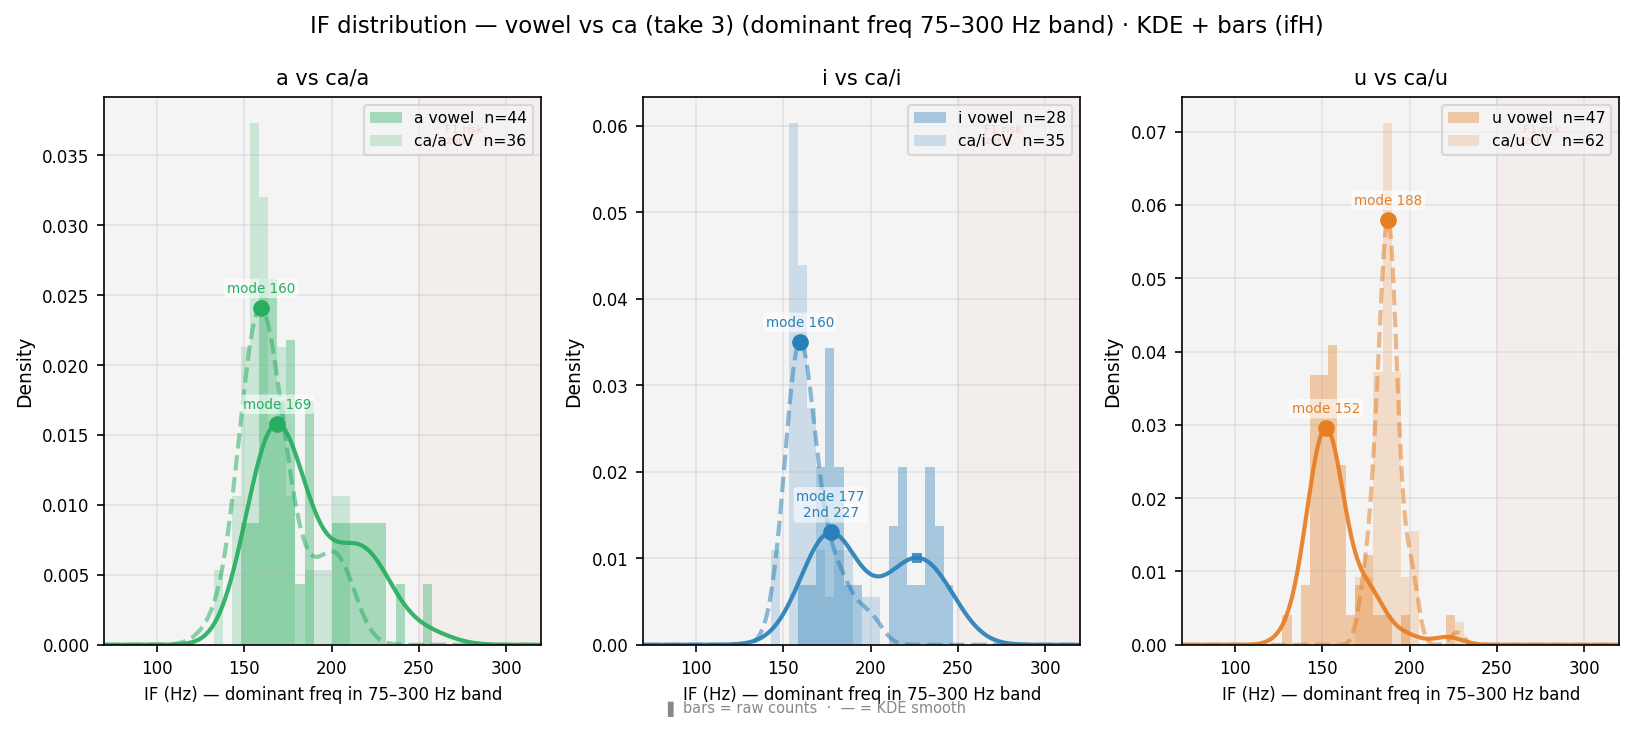
Distribution of instantaneous frequency (Hilbert transform, bandpass 75–300 Hz) at Praat frame rate. For /a/ (F1~800 Hz, outside band): IF tracks F0 — histogram aligns with Praat pitch histogram. For /i/ /u/ (F1~280–300 Hz, inside band): IF may track F1 — red-shaded zone marks this risk. Comparison of vowel vs CV curves shows coarticulation effect on dominant bandpass frequency. ● primary peak · ■ secondary peak.
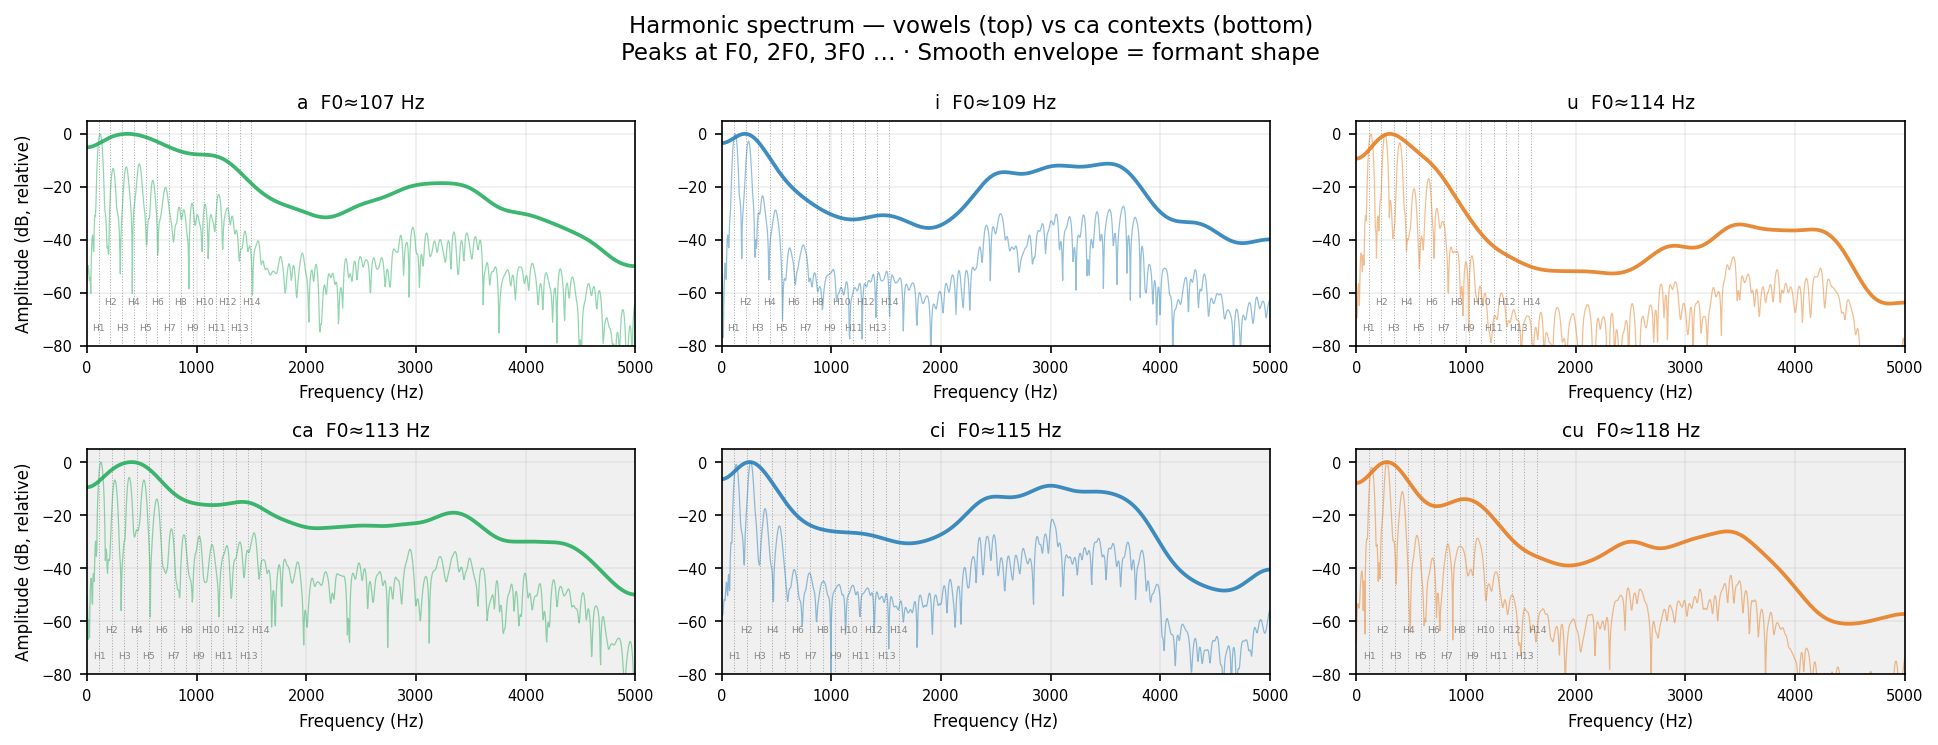
Plain reading: A vowel is a mixture of tones all sounding together. The lowest tone is the fundamental (H1 ≈ F0, ~100 Hz for this voice). The voice also produces tones at exactly 2×, 3×, 4× that frequency — these are harmonics (H2, H3, …). The shape of the mouth amplifies some harmonics more than others; those amplified regions appear as bumps in the smooth envelope — those are the formants (F1 F2 F3). Changing the vowel (अ → इ → उ) reshapes the mouth and shifts the envelope bumps while keeping the comb spacing (F0) the same. Technical: FFT of 50 ms steady-state (20–70 ms after voicing onset). Thin line = raw spectrum · bold line = Gaussian-smoothed spectral envelope (~150 Hz width). Dotted verticals = expected harmonics at n×F0. Y-axis normalised to 0 dB at peak.
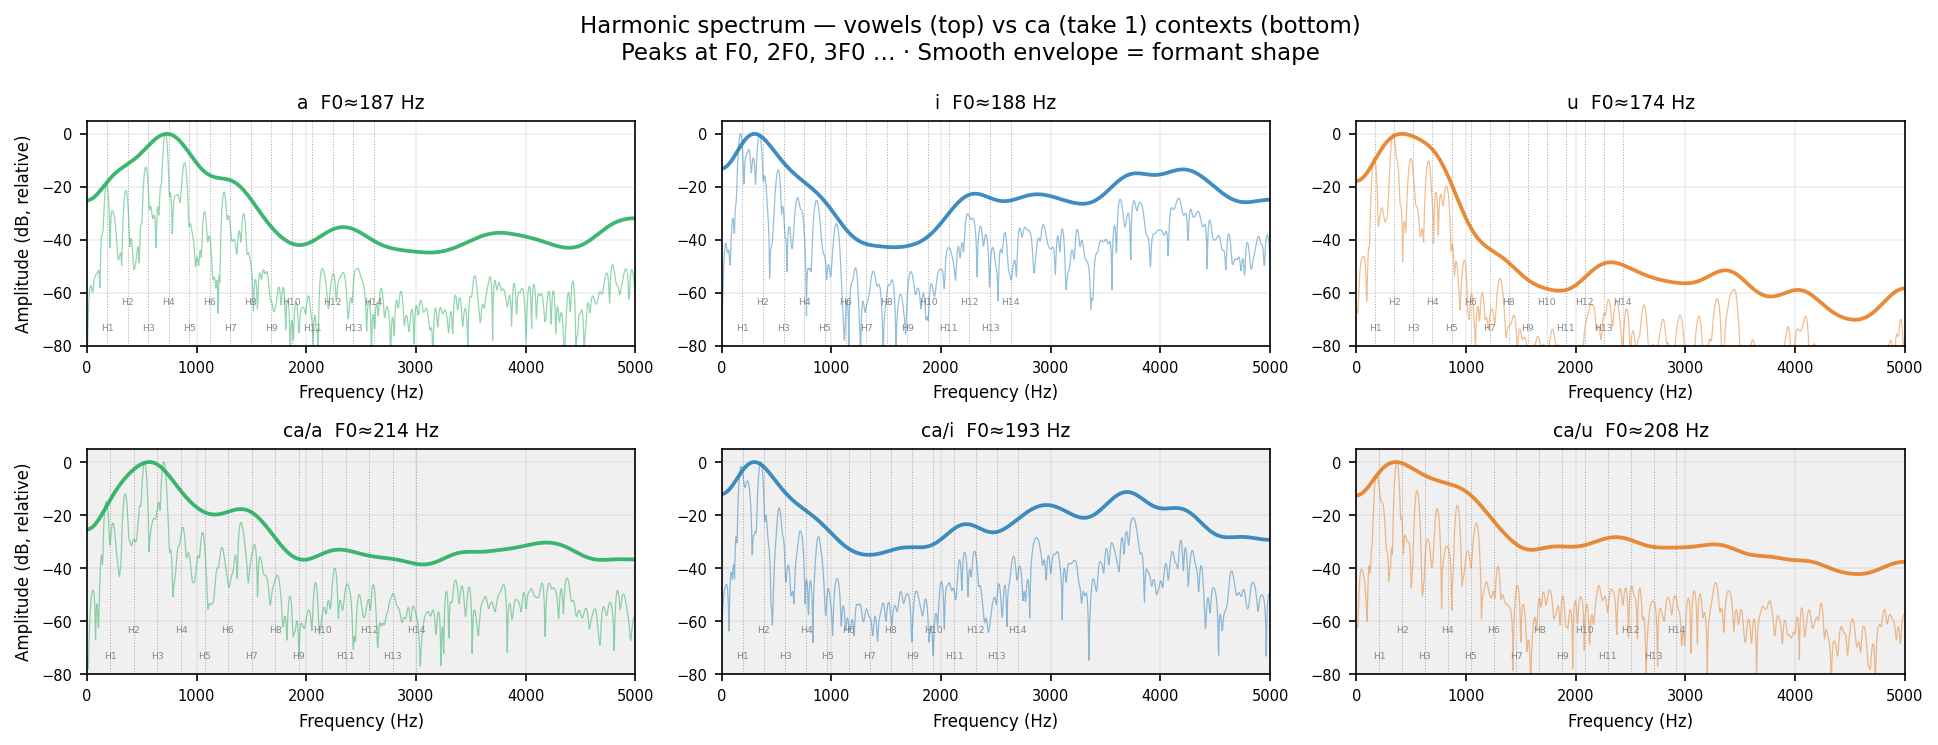
Human take 1
Plain reading: A vowel is a mixture of tones all sounding together. The lowest tone is the fundamental (H1 ≈ F0, ~100 Hz for this voice). The voice also produces tones at exactly 2×, 3×, 4× that frequency — these are harmonics (H2, H3, …). The shape of the mouth amplifies some harmonics more than others; those amplified regions appear as bumps in the smooth envelope — those are the formants (F1 F2 F3). Changing the vowel (अ → इ → उ) reshapes the mouth and shifts the envelope bumps while keeping the comb spacing (F0) the same. Technical: FFT of 50 ms steady-state (20–70 ms after voicing onset). Thin line = raw spectrum · bold line = Gaussian-smoothed spectral envelope (~150 Hz width). Dotted verticals = expected harmonics at n×F0. Y-axis normalised to 0 dB at peak.
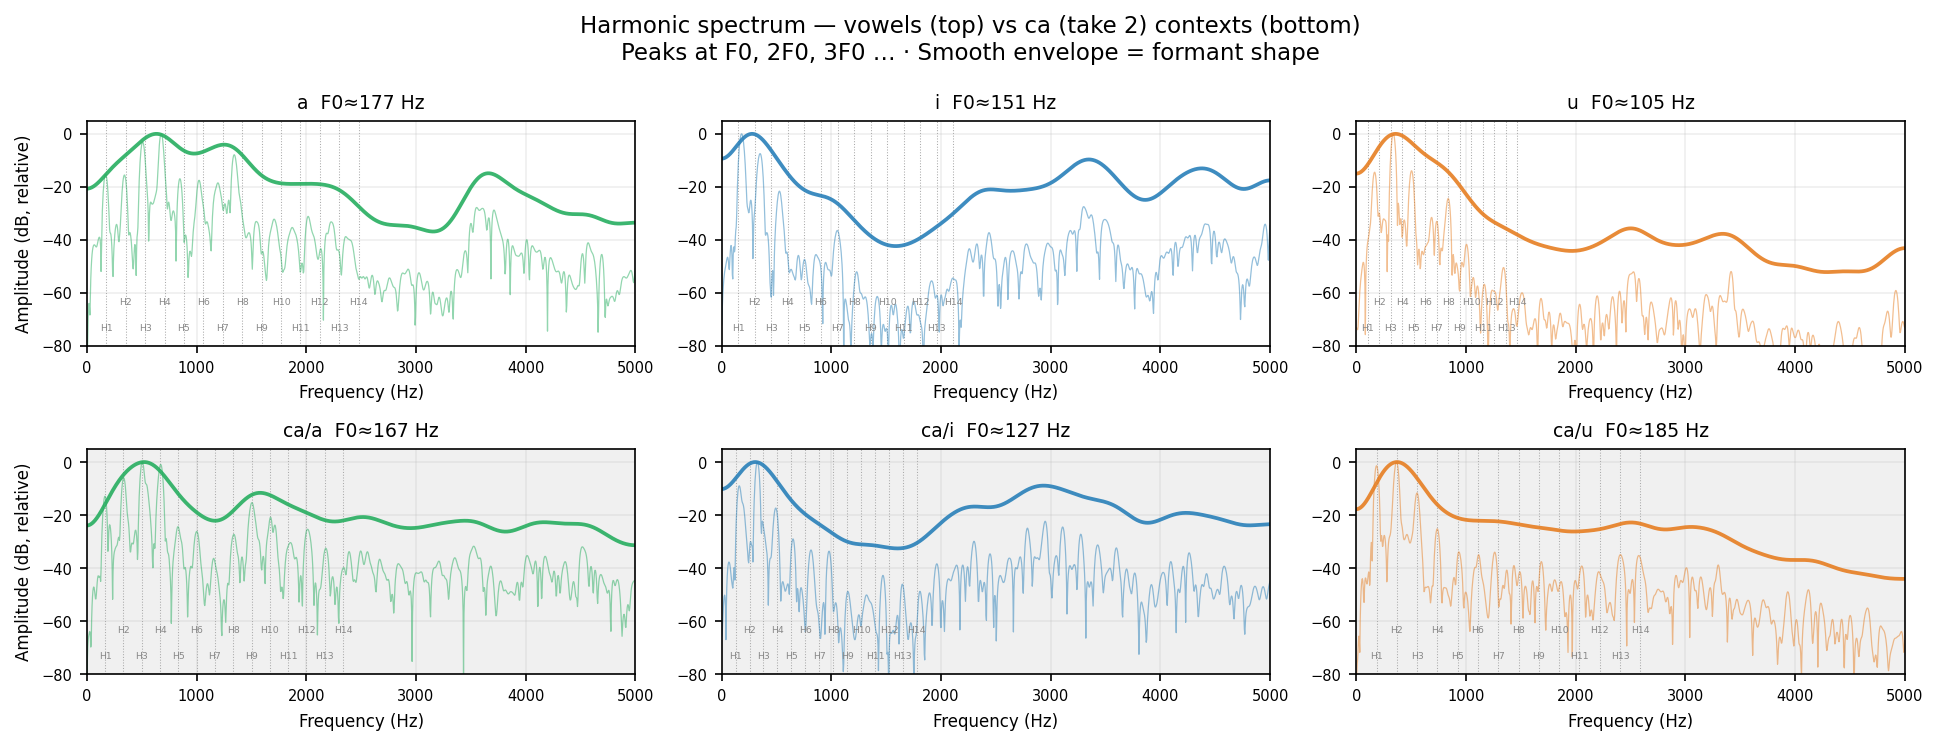
Human take 2
Plain reading: A vowel is a mixture of tones all sounding together. The lowest tone is the fundamental (H1 ≈ F0, ~100 Hz for this voice). The voice also produces tones at exactly 2×, 3×, 4× that frequency — these are harmonics (H2, H3, …). The shape of the mouth amplifies some harmonics more than others; those amplified regions appear as bumps in the smooth envelope — those are the formants (F1 F2 F3). Changing the vowel (अ → इ → उ) reshapes the mouth and shifts the envelope bumps while keeping the comb spacing (F0) the same. Technical: FFT of 50 ms steady-state (20–70 ms after voicing onset). Thin line = raw spectrum · bold line = Gaussian-smoothed spectral envelope (~150 Hz width). Dotted verticals = expected harmonics at n×F0. Y-axis normalised to 0 dB at peak.
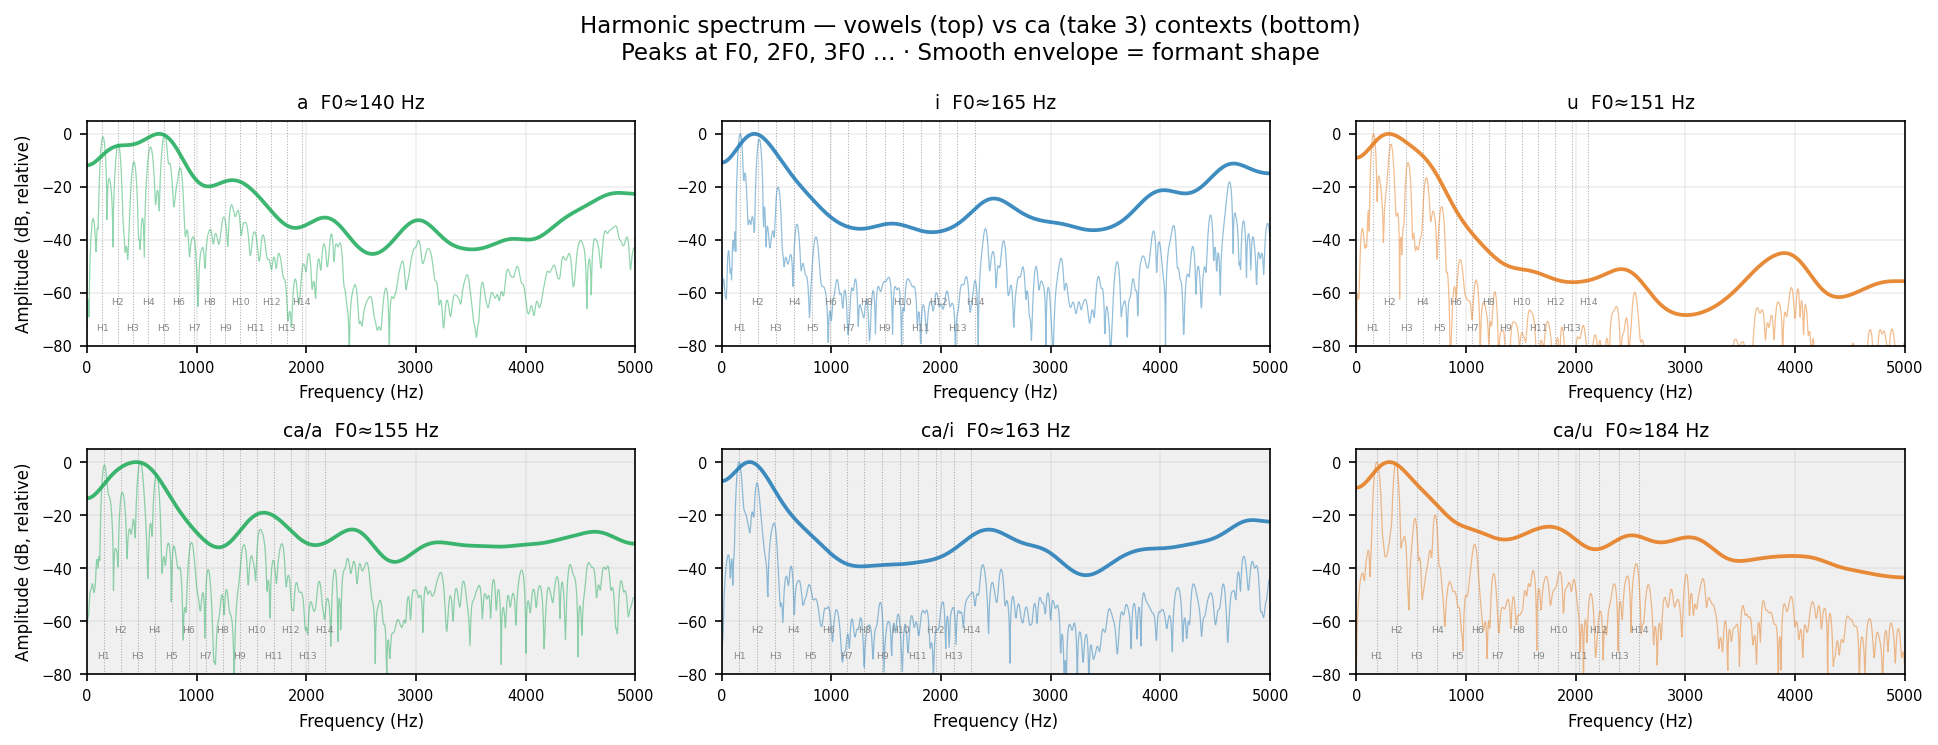
Human take 3
Plain reading: A vowel is a mixture of tones all sounding together. The lowest tone is the fundamental (H1 ≈ F0, ~100 Hz for this voice). The voice also produces tones at exactly 2×, 3×, 4× that frequency — these are harmonics (H2, H3, …). The shape of the mouth amplifies some harmonics more than others; those amplified regions appear as bumps in the smooth envelope — those are the formants (F1 F2 F3). Changing the vowel (अ → इ → उ) reshapes the mouth and shifts the envelope bumps while keeping the comb spacing (F0) the same. Technical: FFT of 50 ms steady-state (20–70 ms after voicing onset). Thin line = raw spectrum · bold line = Gaussian-smoothed spectral envelope (~150 Hz width). Dotted verticals = expected harmonics at n×F0. Y-axis normalised to 0 dB at peak.
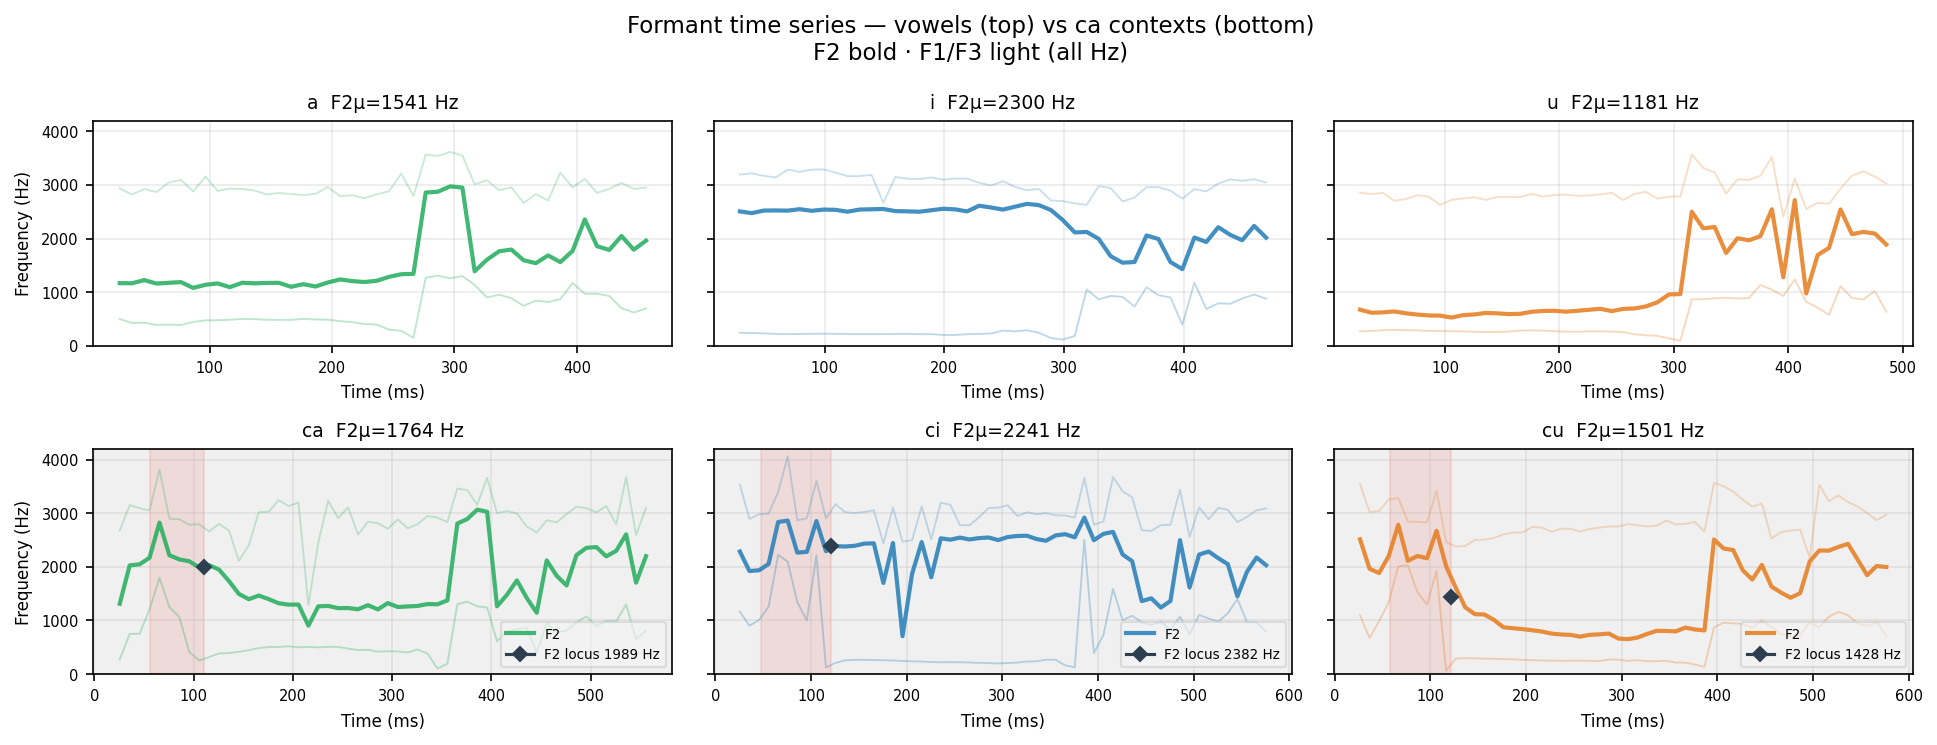
F2 bold · F1/F3 light (alpha). ◆ = F2 locus (F2 at voicing onset = place of articulation marker). Red shade = burst window.
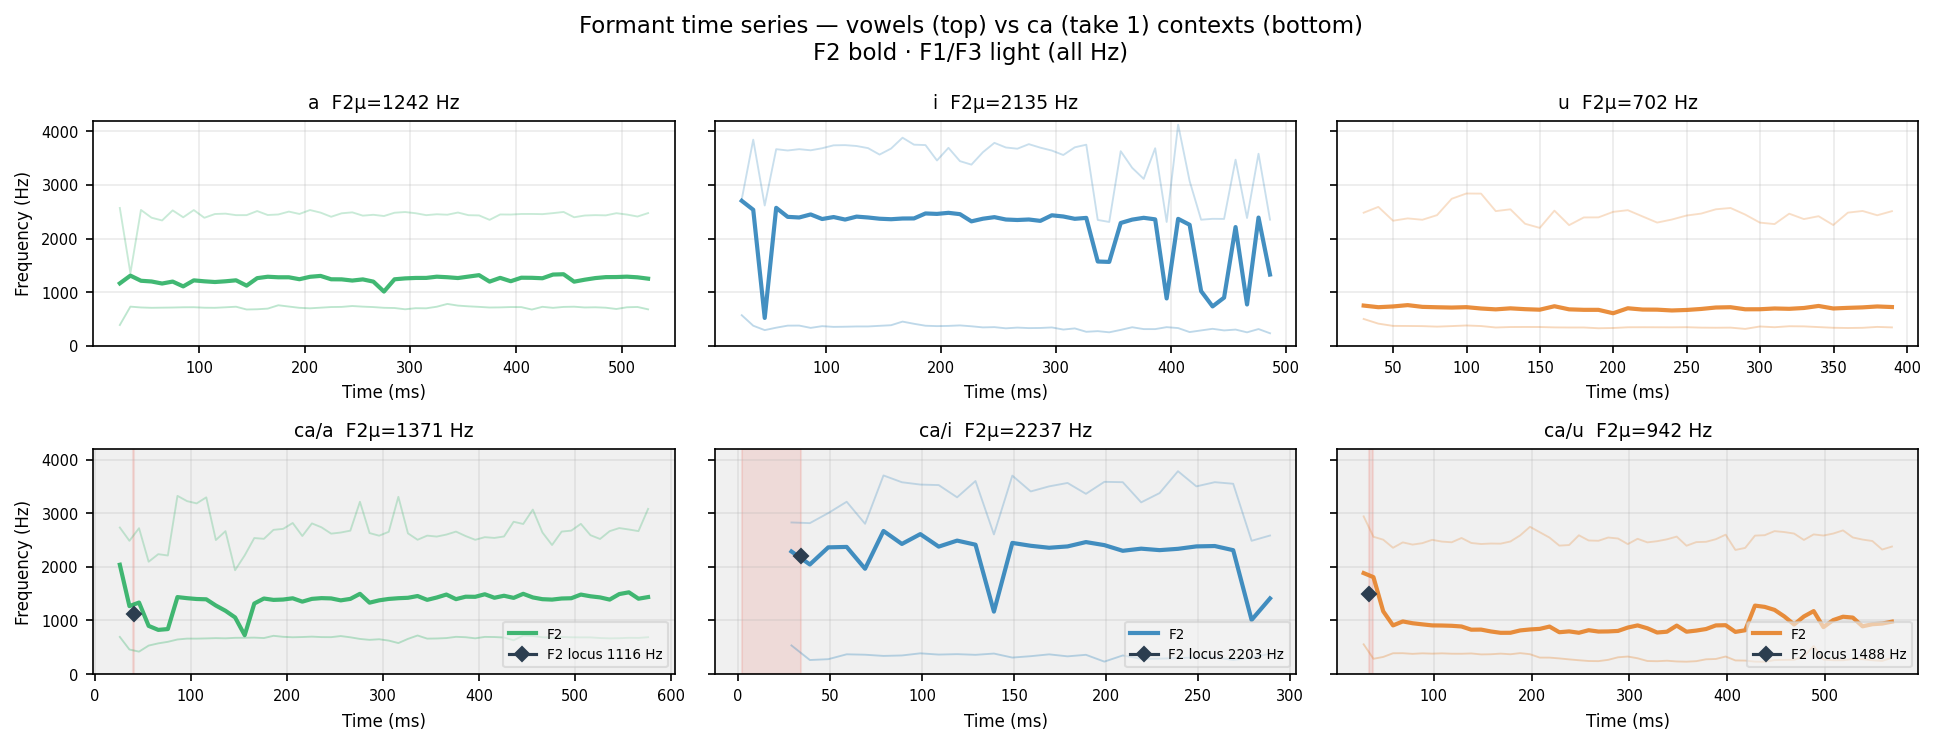
Human take 1
F2 bold · F1/F3 light (alpha). ◆ = F2 locus (F2 at voicing onset = place of articulation marker). Red shade = burst window.
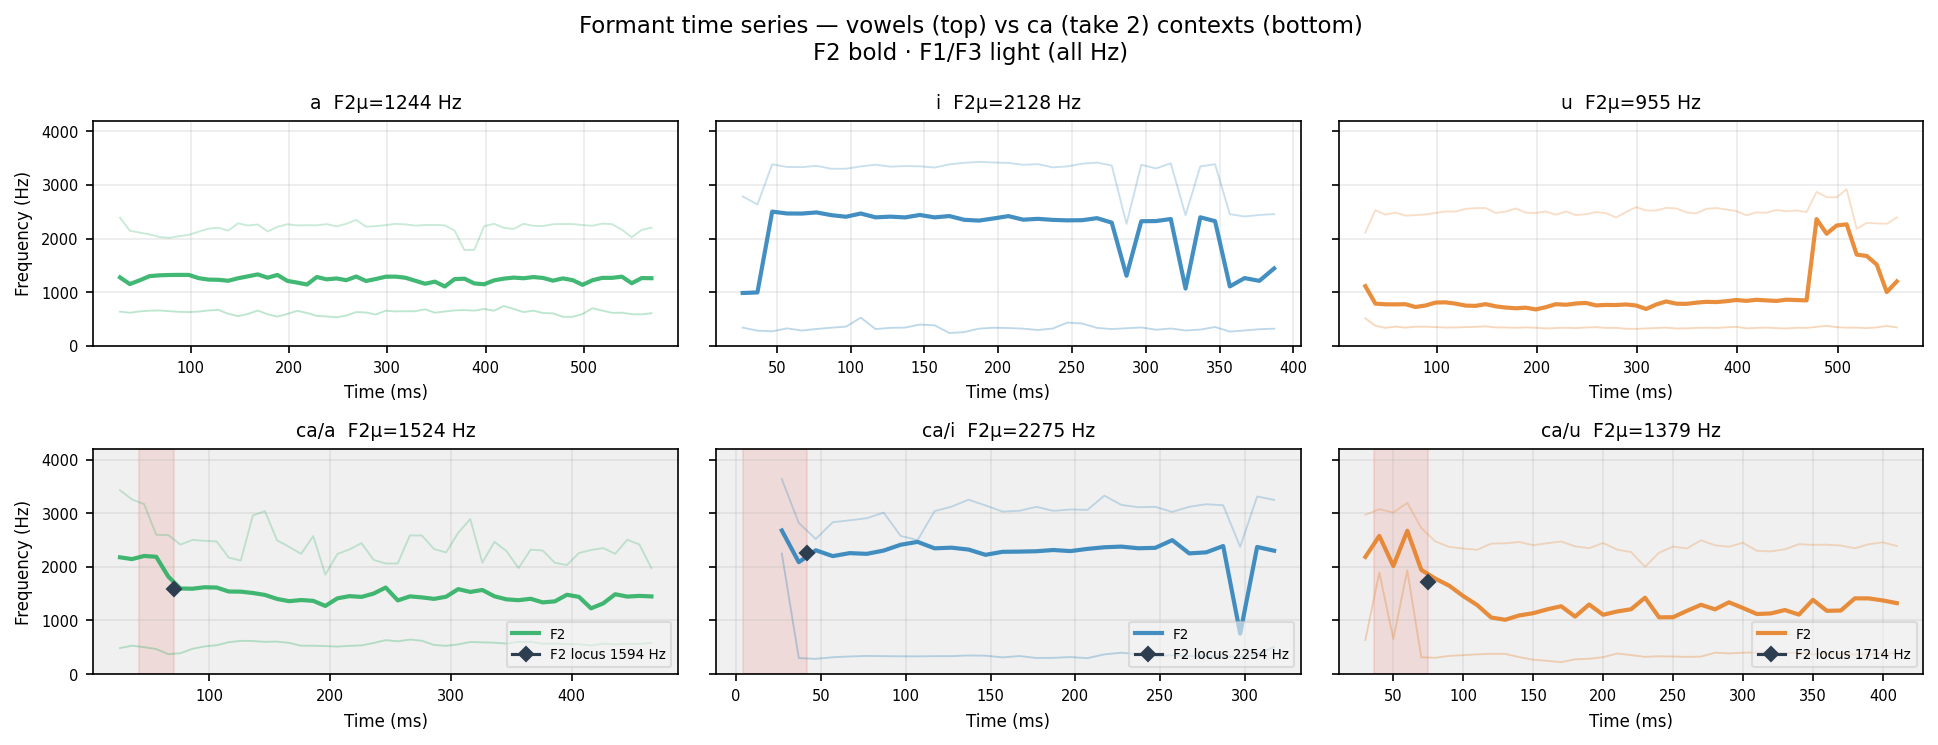
Human take 2
F2 bold · F1/F3 light (alpha). ◆ = F2 locus (F2 at voicing onset = place of articulation marker). Red shade = burst window.
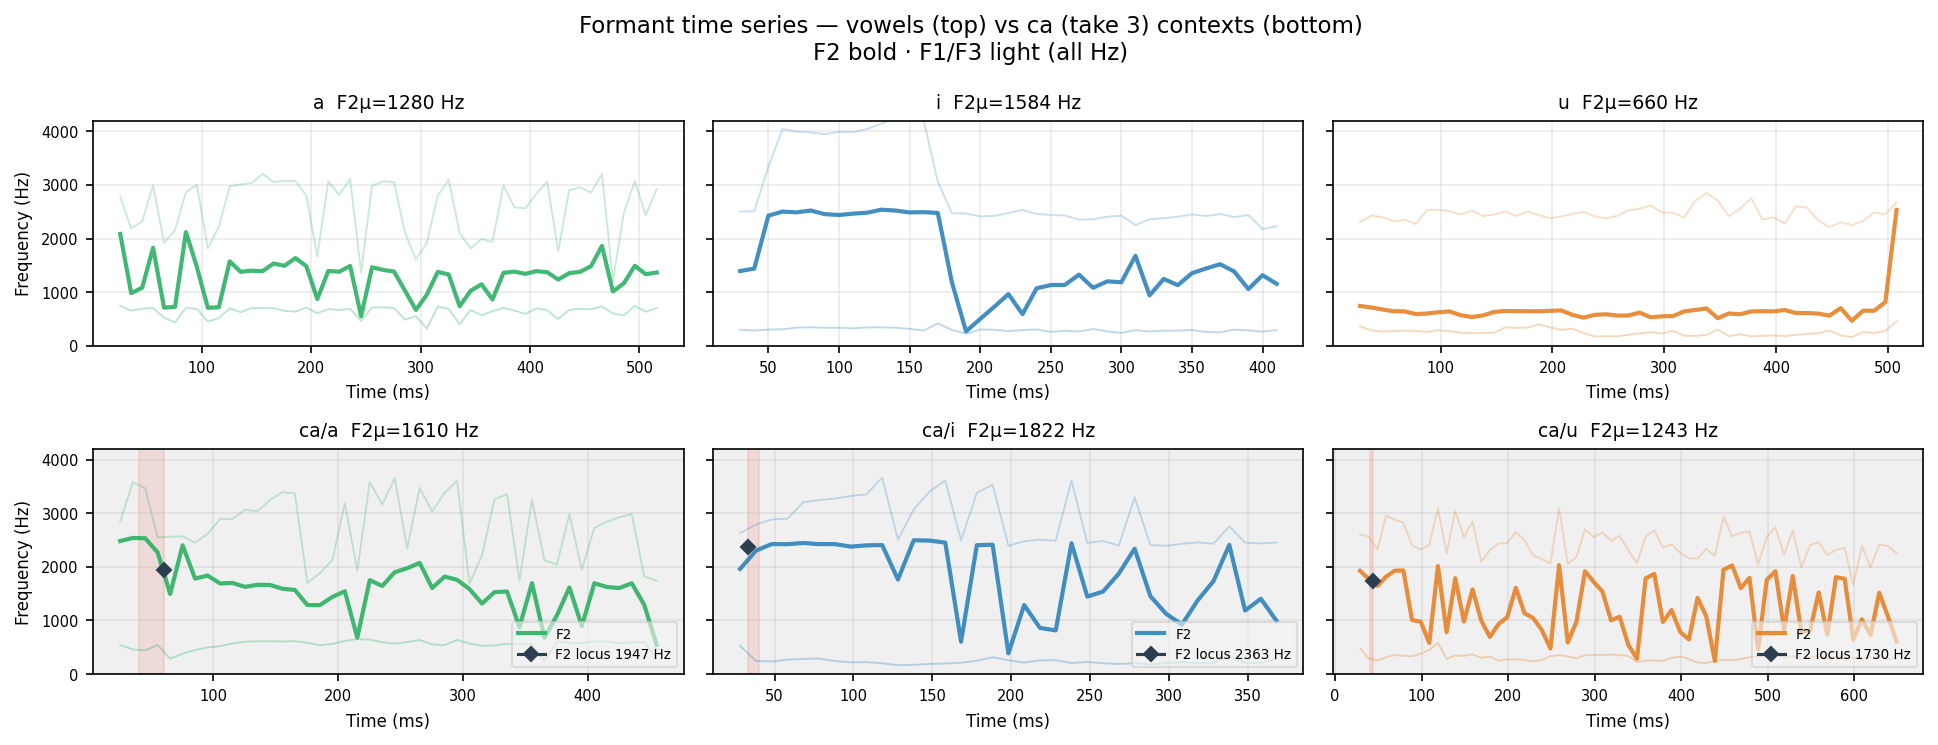
Human take 3
F2 bold · F1/F3 light (alpha). ◆ = F2 locus (F2 at voicing onset = place of articulation marker). Red shade = burst window.
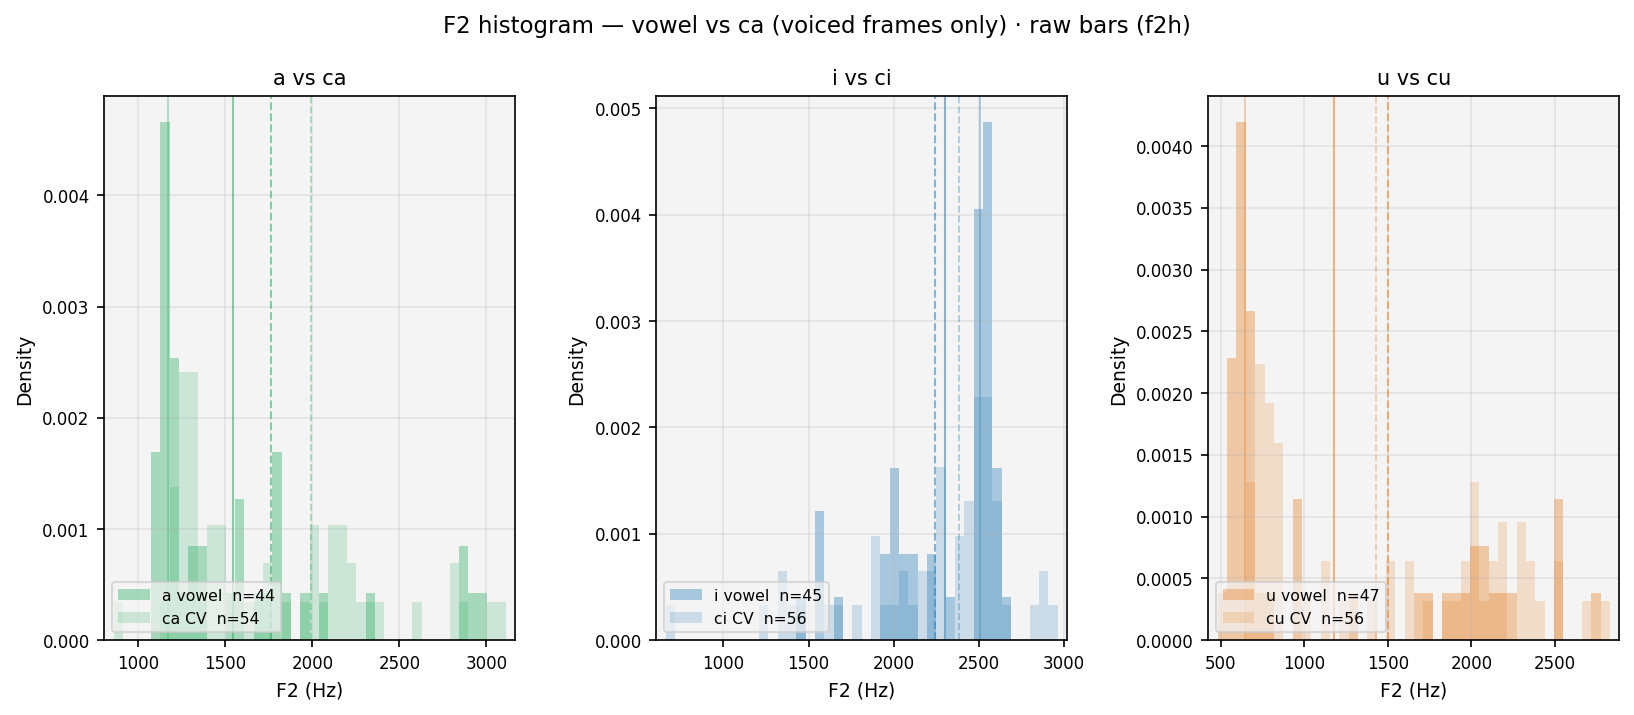
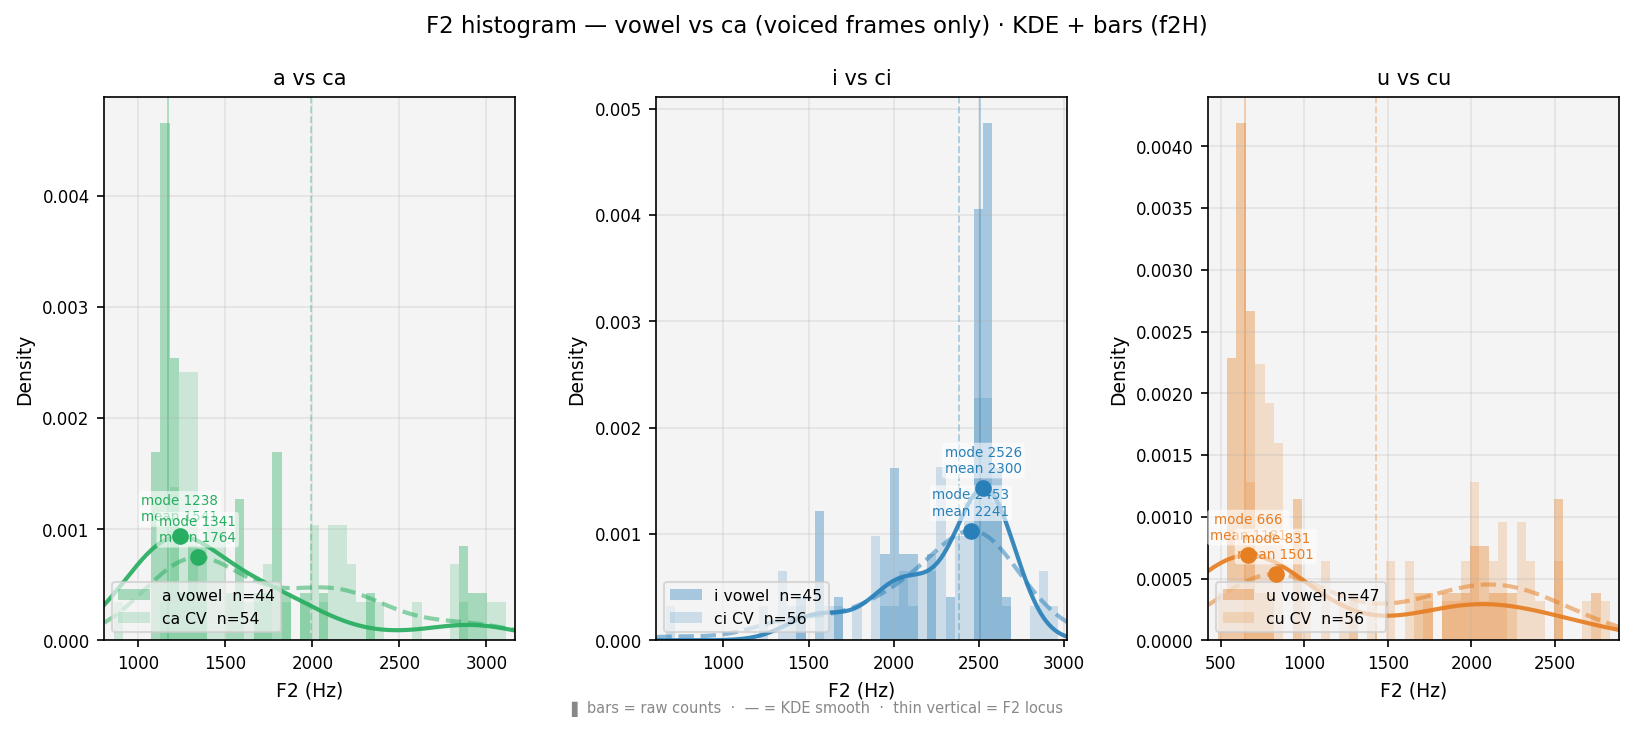
F2 smoothed histogram — vowel (solid) vs CV (dashed). ● = primary peak (mode, most frequent F2). ■ = secondary peak (smaller square). Thin verticals = F2 locus (F2 at voicing onset). Shift between curves = coarticulation. Locus stability across a/i/u contexts characterises the consonant.
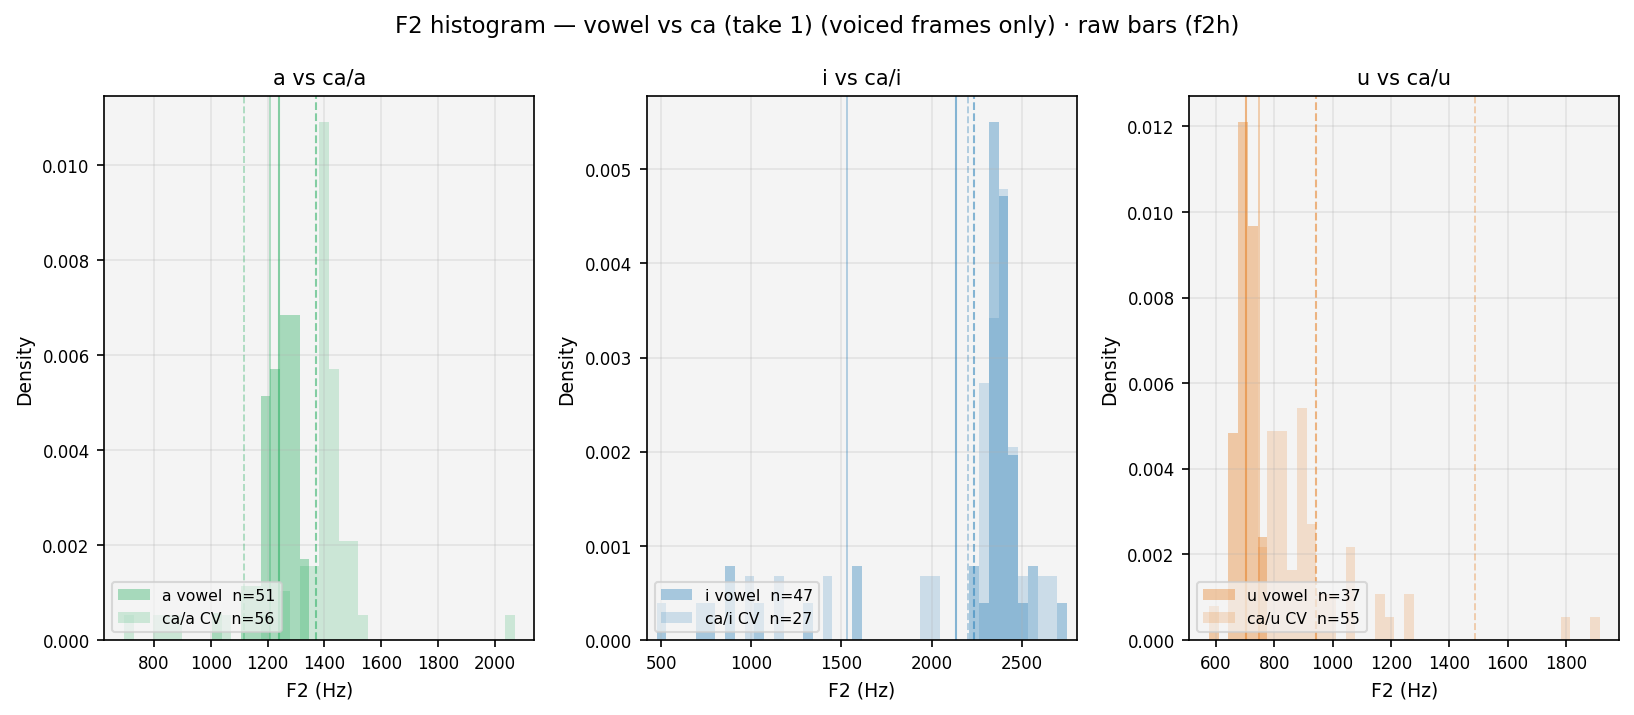
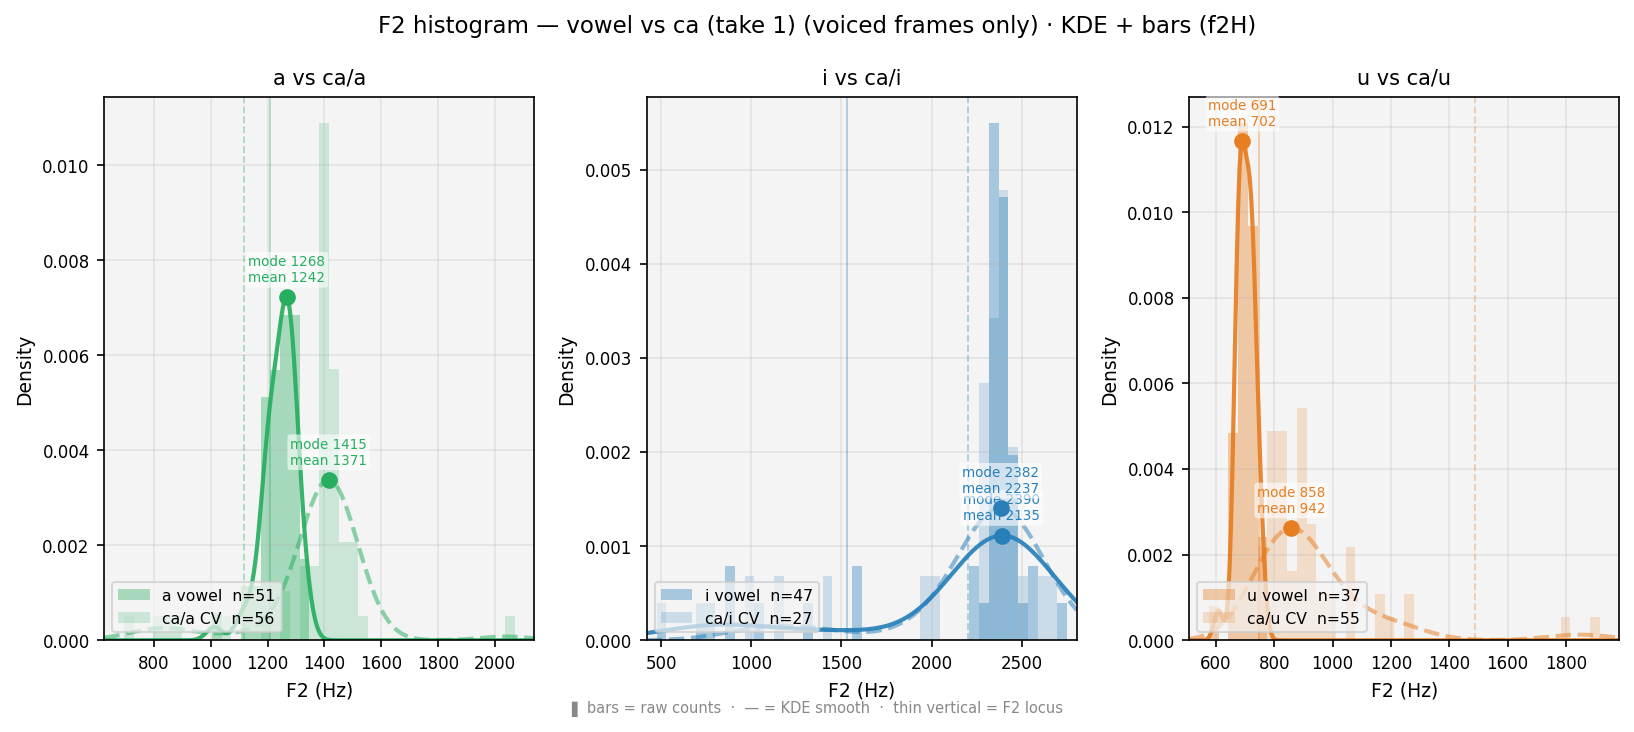
F2 smoothed histogram — vowel (solid) vs CV (dashed). ● = primary peak (mode, most frequent F2). ■ = secondary peak (smaller square). Thin verticals = F2 locus (F2 at voicing onset). Shift between curves = coarticulation. Locus stability across a/i/u contexts characterises the consonant.
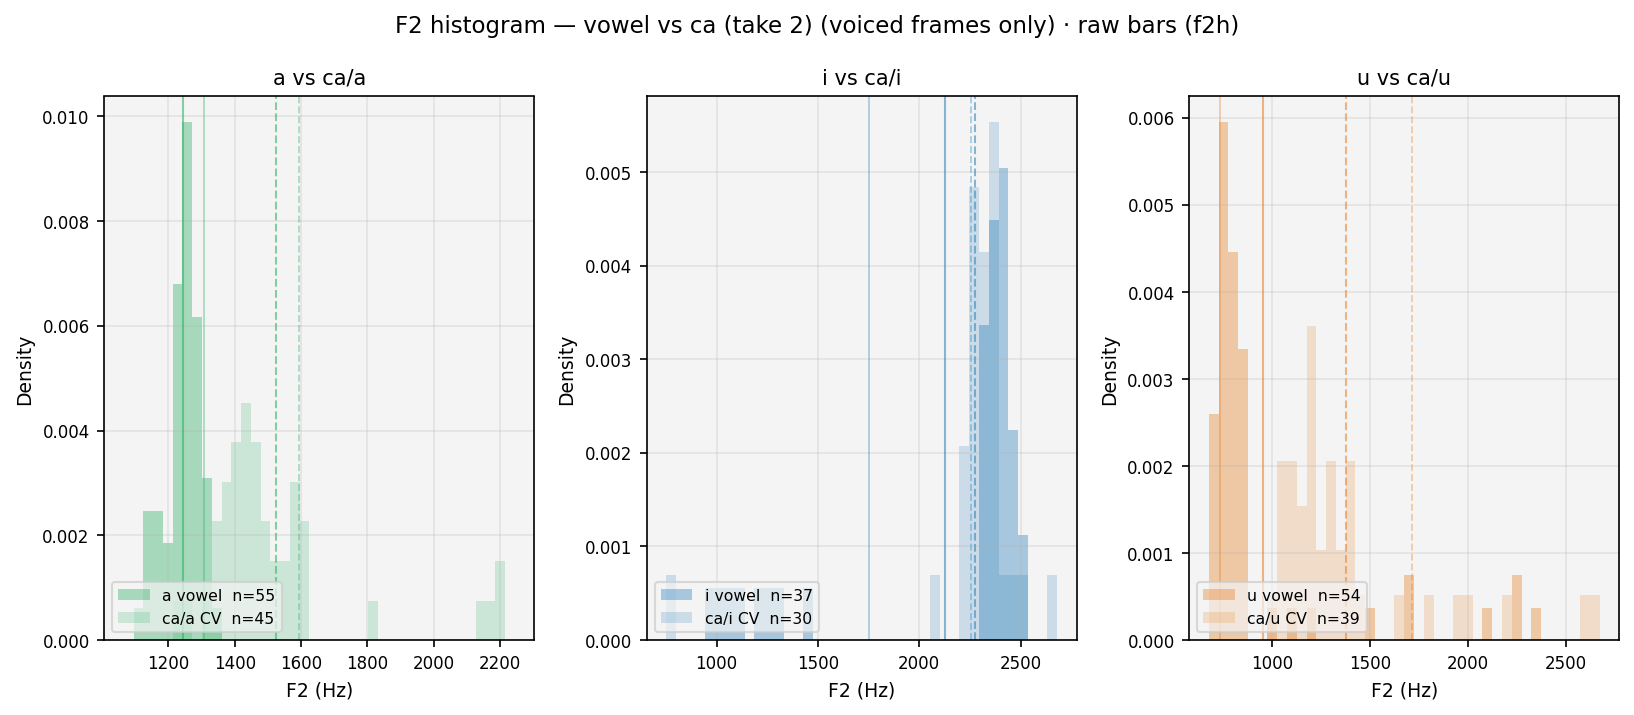
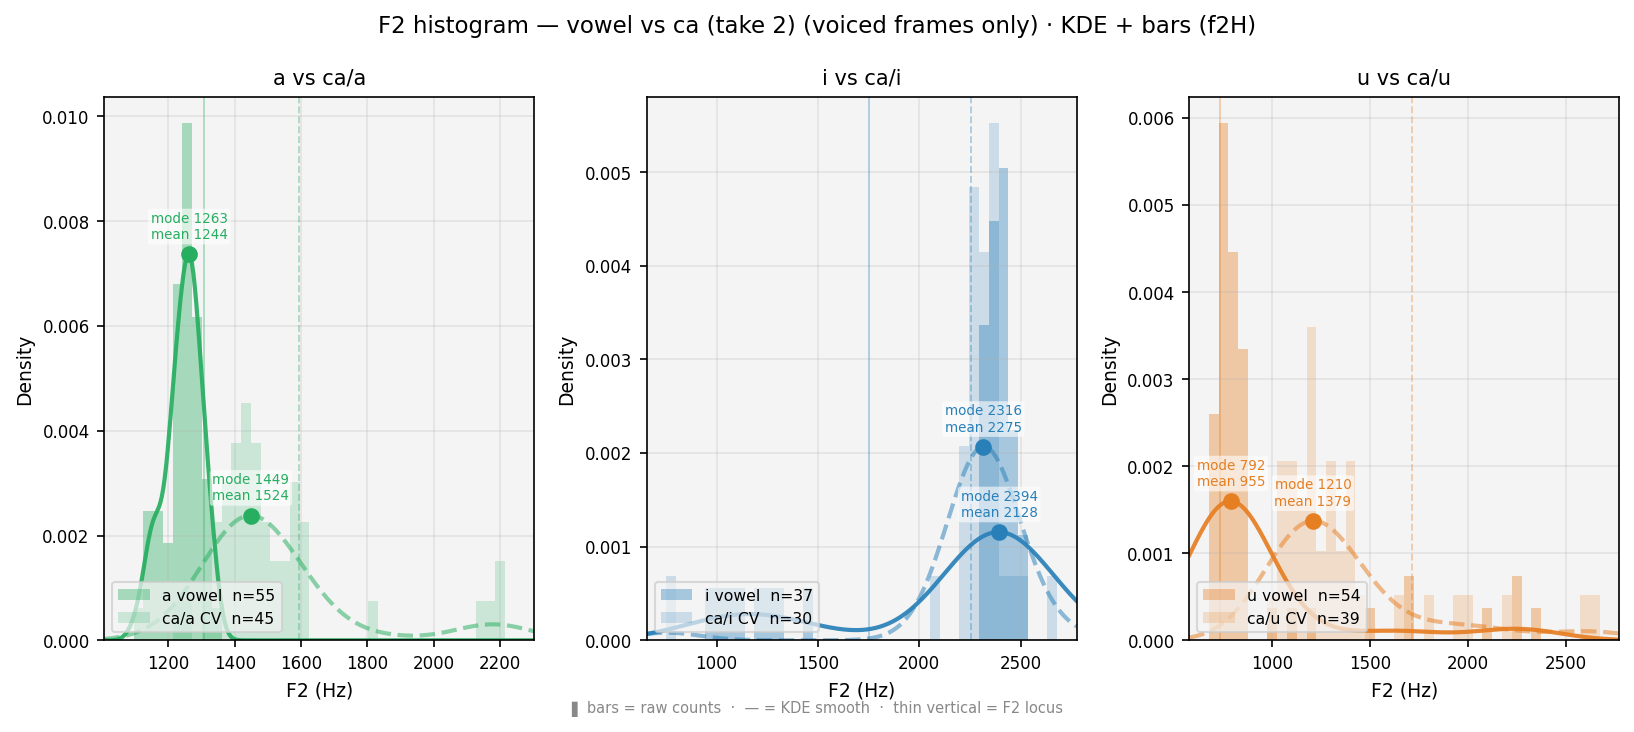
F2 smoothed histogram — vowel (solid) vs CV (dashed). ● = primary peak (mode, most frequent F2). ■ = secondary peak (smaller square). Thin verticals = F2 locus (F2 at voicing onset). Shift between curves = coarticulation. Locus stability across a/i/u contexts characterises the consonant.
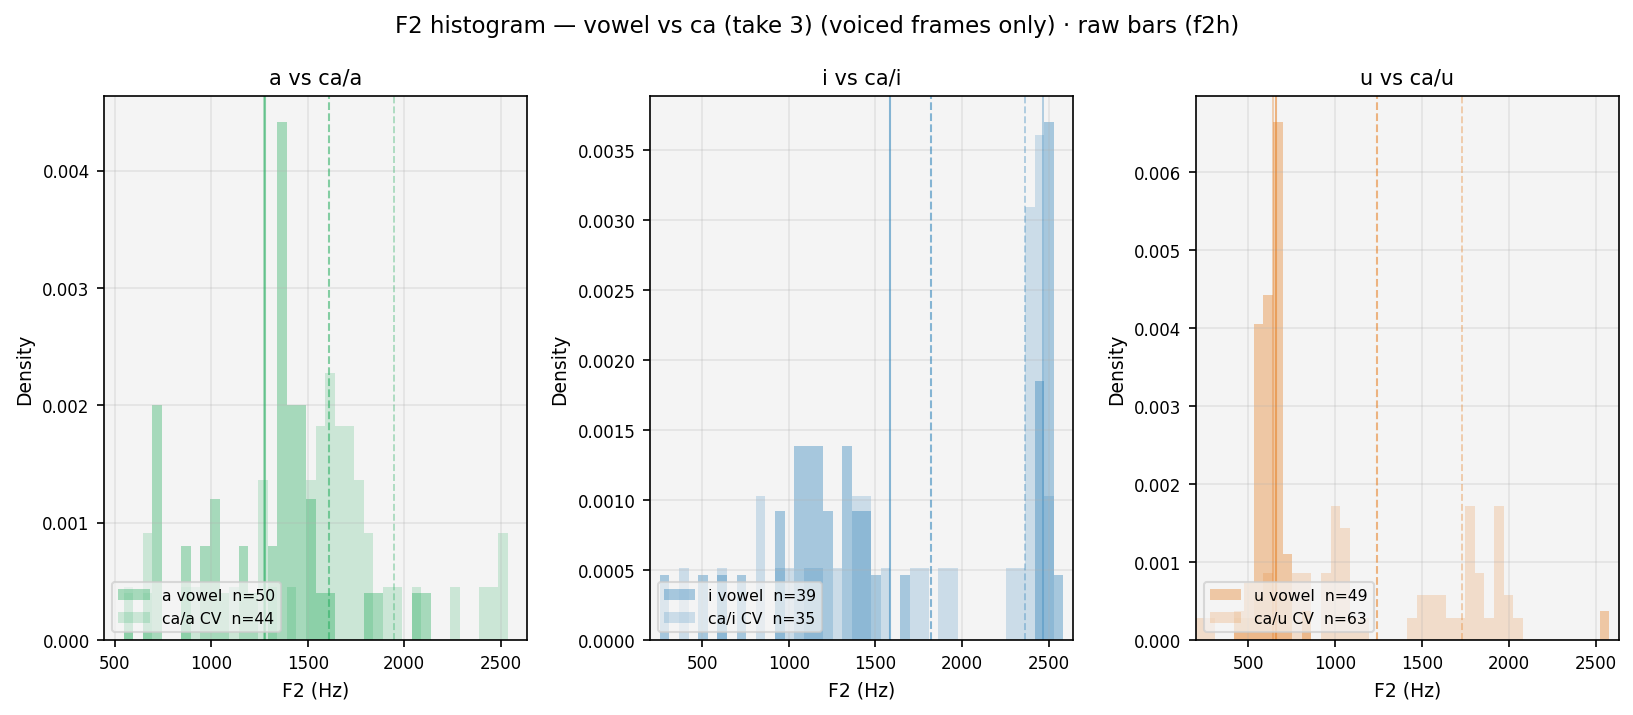
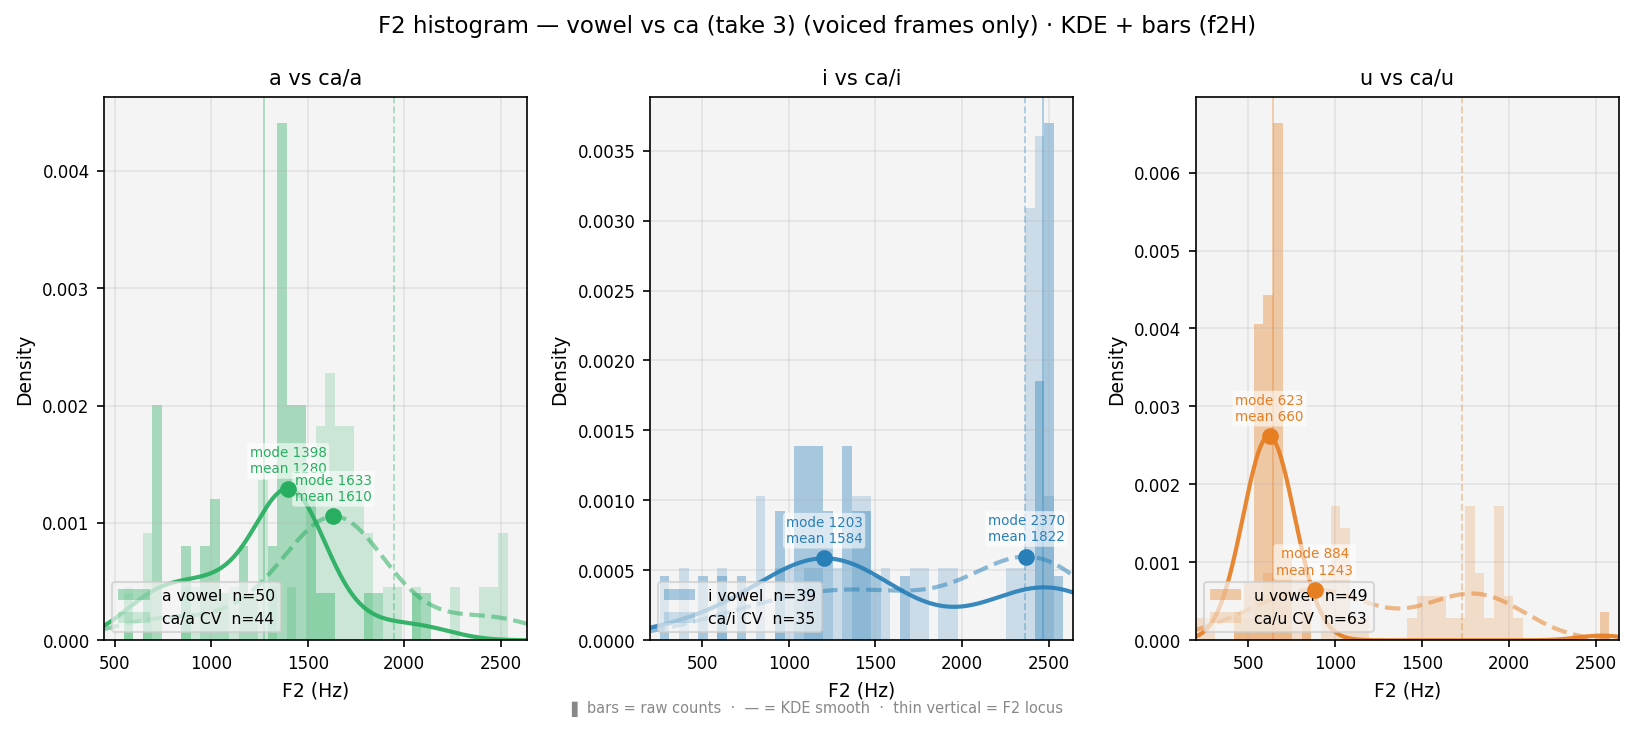
F2 smoothed histogram — vowel (solid) vs CV (dashed). ● = primary peak (mode, most frequent F2). ■ = secondary peak (smaller square). Thin verticals = F2 locus (F2 at voicing onset). Shift between curves = coarticulation. Locus stability across a/i/u contexts characterises the consonant.
| Metric — cȧ (Palatal) | a context | i context | u context | mean ± σ (क् estimate) |
|---|---|---|---|---|
| Pitch gap / burst (ms) | 55 | 73 | 64 | 64 ±7 |
| Pitch/F0 primary peak (Hz) | 126 | 131 | 137 | 131 ±5 |
| Pitch/F0 secondary peak (Hz) | — | 99 | 96 | 98 ±2 |
| ΔF0 secondary−primary (Hz) | — | -32 | -41 | -36 ±4 |
| F2 locus at voicing onset (Hz) | 1989 | 2382 | 1428 | 1933 ±392 |
| F2 steady-state / vowel (Hz) | 2084 | 2088 | 1863 | 2012 ±105 |
| Reference vowels — no consonant onset: | ||||
| a (pure vowel) | Pitch/F0 mean 107 Hz · F2 locus 1169 Hz · F2 steady 1946 Hz | — | ||
| i (pure vowel) | Pitch/F0 mean 109 Hz · F2 locus 2506 Hz · F2 steady 2058 Hz | — | ||
| u (pure vowel) | Pitch/F0 mean 114 Hz · F2 locus 647 Hz · F2 steady 1814 Hz | — | ||
| Metric — cȧ (Palatal) | a context | i context | u context | mean ± σ (क् estimate) |
|---|---|---|---|---|
| Pitch gap / burst (ms) | 1 | 32 | 0 | 11 ±15 |
| Pitch/F0 primary peak (Hz) | 231 | 184 | 223 | 213 ±21 |
| Pitch/F0 secondary peak (Hz) | 174 | — | 189 | 181 ±8 |
| ΔF0 secondary−primary (Hz) | -58 | — | -34 | -46 ±12 |
| F2 locus at voicing onset (Hz) | 1116 | 2203 | 1488 | 1602 ±451 |
| F2 steady-state / vowel (Hz) | 1438 | 2169 | 958 | 1522 ±498 |
| Reference vowels — no consonant onset: | ||||
| a (pure vowel) | Pitch/F0 mean 187 Hz · F2 locus 1207 Hz · F2 steady 1270 Hz | — | ||
| i (pure vowel) | Pitch/F0 mean 188 Hz · F2 locus 1529 Hz · F2 steady 1895 Hz | — | ||
| u (pure vowel) | Pitch/F0 mean 174 Hz · F2 locus 748 Hz · F2 steady 703 Hz | — | ||
| Metric — cȧ (Palatal) | a context | i context | u context | mean ± σ (क् estimate) |
|---|---|---|---|---|
| Pitch gap / burst (ms) | 29 | 38 | 39 | 35 ±4 |
| Pitch/F0 primary peak (Hz) | 166 | 167 | 186 | 173 ±9 |
| Pitch/F0 secondary peak (Hz) | — | 83 | — | 83 |
| ΔF0 secondary−primary (Hz) | — | -84 | — | -84 |
| F2 locus at voicing onset (Hz) | 1594 | 2254 | 1714 | 1854 ±287 |
| F2 steady-state / vowel (Hz) | 1429 | 2223 | 1254 | 1635 ±421 |
| Reference vowels — no consonant onset: | ||||
| a (pure vowel) | Pitch/F0 mean 177 Hz · F2 locus 1308 Hz · F2 steady 1225 Hz | — | ||
| i (pure vowel) | Pitch/F0 mean 151 Hz · F2 locus 1750 Hz · F2 steady 1954 Hz | — | ||
| u (pure vowel) | Pitch/F0 mean 105 Hz · F2 locus 739 Hz · F2 steady 1205 Hz | — | ||
| Metric — cȧ (Palatal) | a context | i context | u context | mean ± σ (क् estimate) |
|---|---|---|---|---|
| Pitch gap / burst (ms) | 20 | 0 | 4 | 8 ±9 |
| Pitch/F0 primary peak (Hz) | 156 | 159 | 185 | 167 ±13 |
| Pitch/F0 secondary peak (Hz) | — | — | — | — |
| ΔF0 secondary−primary (Hz) | — | — | — | — |
| F2 locus at voicing onset (Hz) | 1947 | 2363 | 1730 | 2013 ±263 |
| F2 steady-state / vowel (Hz) | 1392 | 1494 | 1221 | 1369 ±113 |
| Reference vowels — no consonant onset: | ||||
| a (pure vowel) | Pitch/F0 mean 140 Hz · F2 locus 1271 Hz · F2 steady 1273 Hz | — | ||
| i (pure vowel) | Pitch/F0 mean 165 Hz · F2 locus 2466 Hz · F2 steady 1254 Hz | — | ||
| u (pure vowel) | Pitch/F0 mean 151 Hz · F2 locus 644 Hz · F2 steady 711 Hz | — | ||
ट ṭa · Retroflex · Murdhanya ⠿ drag sections to reorder · 👁 toggle visibility
| TTS — Wavenet-B | |||
|---|---|---|---|
| Vowel | a | i | u |
| CV | tta | tti | ttu |
| Human — take 1 | |||
|---|---|---|---|
| Vowel | a | i | u |
| CV | tta/a | tta/i | tta/u |
| Human — take 2 | |||
|---|---|---|---|
| Vowel | a | i | u |
| CV | tta/a | tta/i | tta/u |
| Human — take 3 | |||
|---|---|---|---|
| Vowel | a | i | u |
| CV | tta/a | tta/i | tta/u |
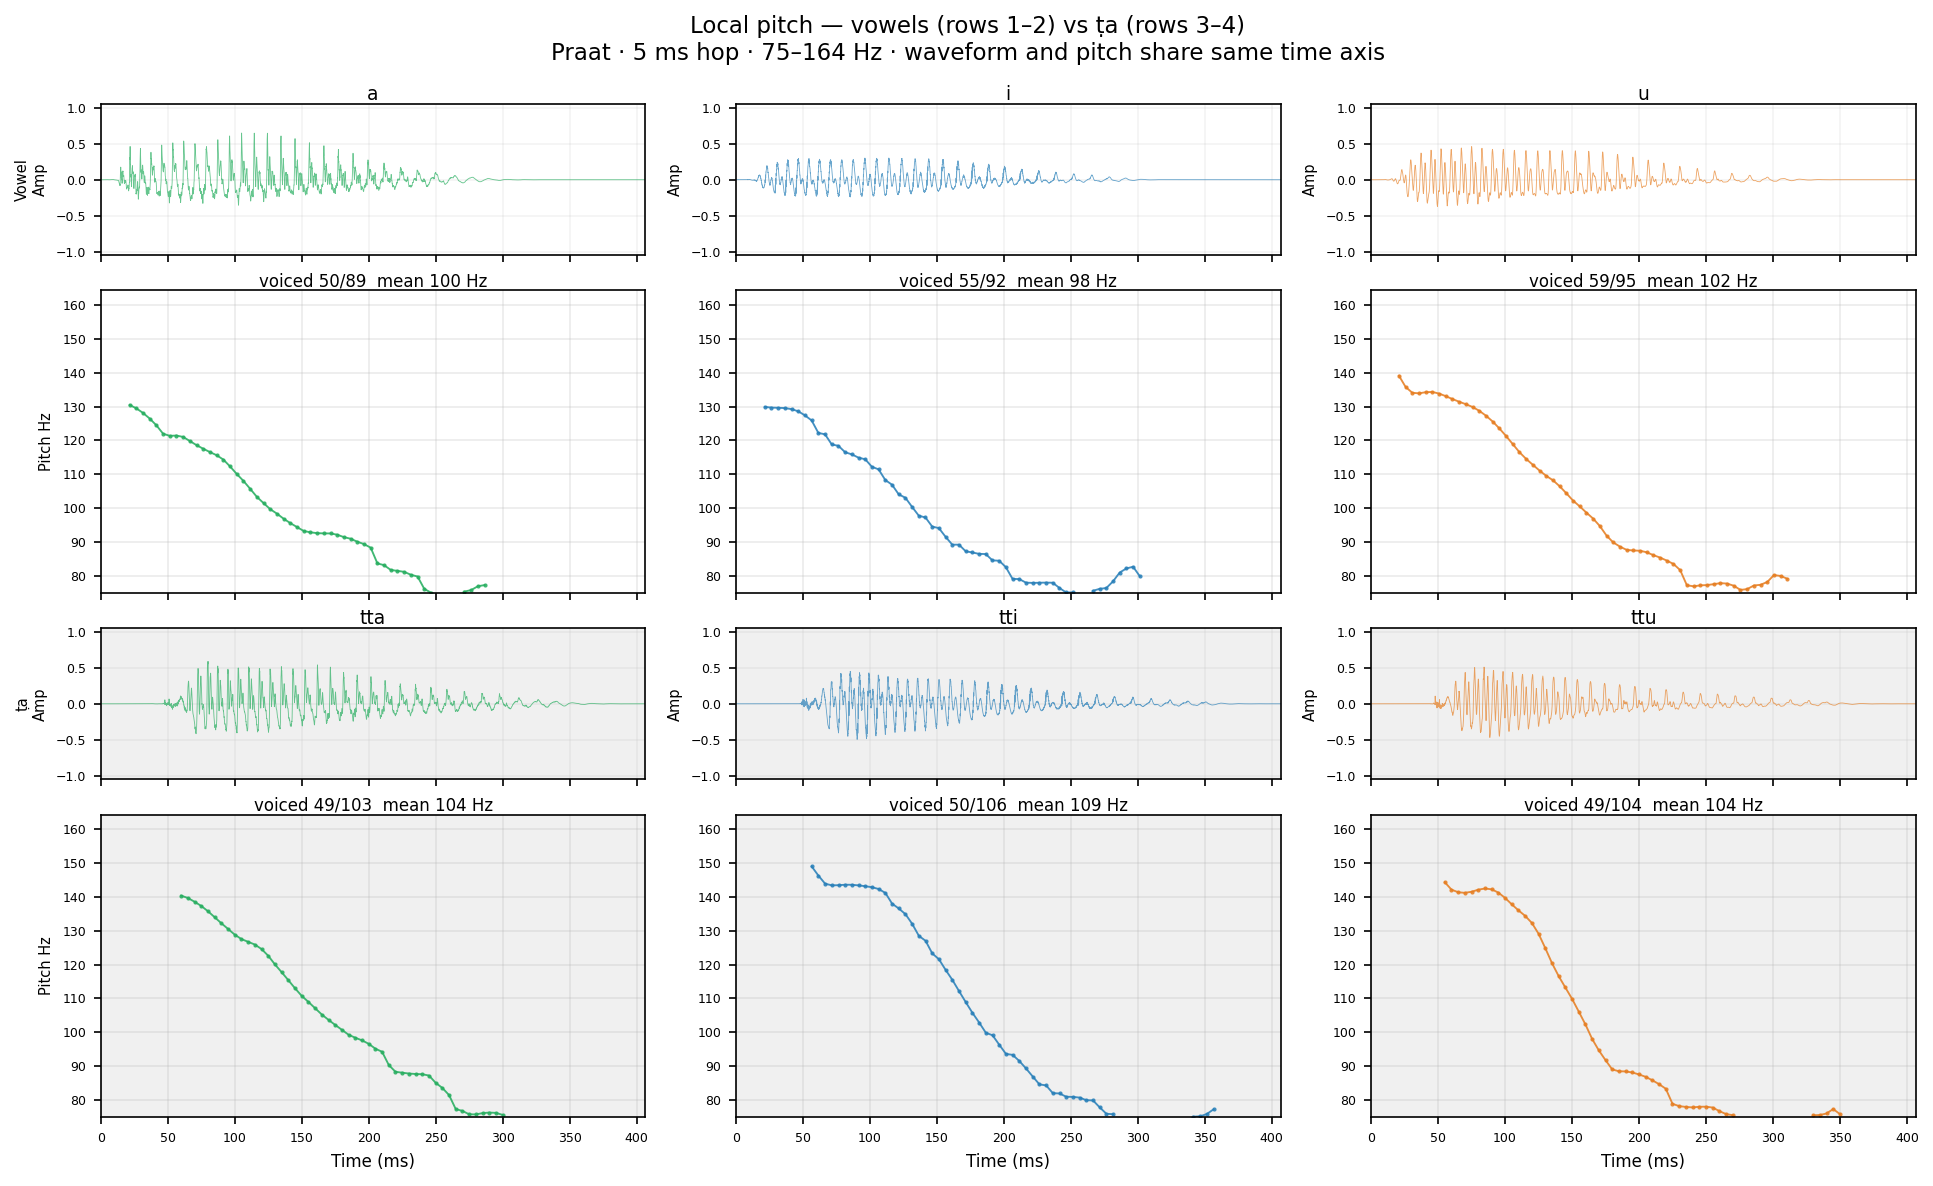
Local pitch (Prof's view): Praat autocorrelation at 5 ms hop, 75–500 Hz range, no voiced/unvoiced separation — gaps only at true silence. Matches Praat's "local pitch plot." Finer time step shows rapid micro-variation in pitch; vowels show relatively flat regions; burst/transitions show gaps or jumps. Compare with the Pitch/IF panel below (10 ms hop, voiced-only, with IF overlay).
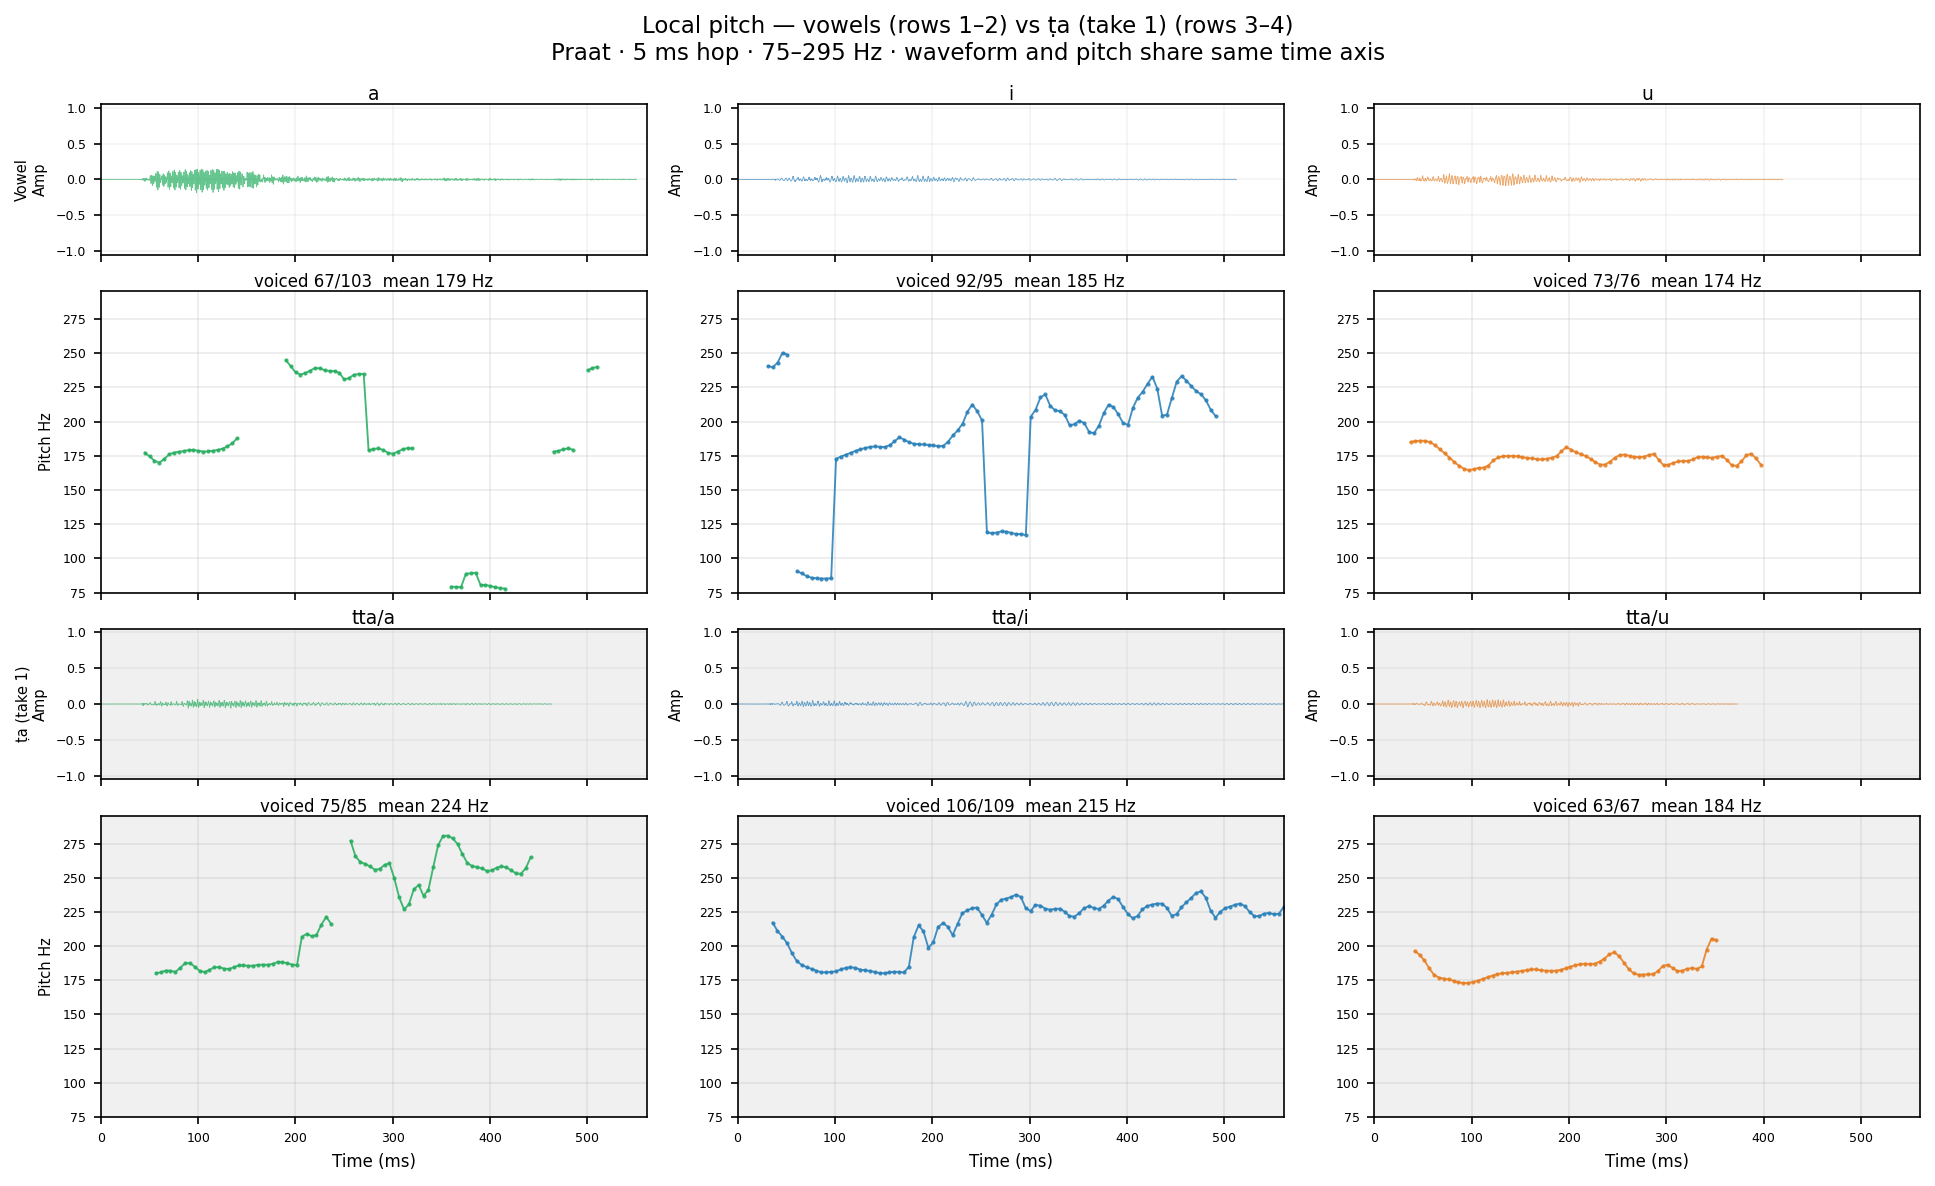
Human take 1 Same Praat settings as TTS. Compare burst gap duration and F0 onset.
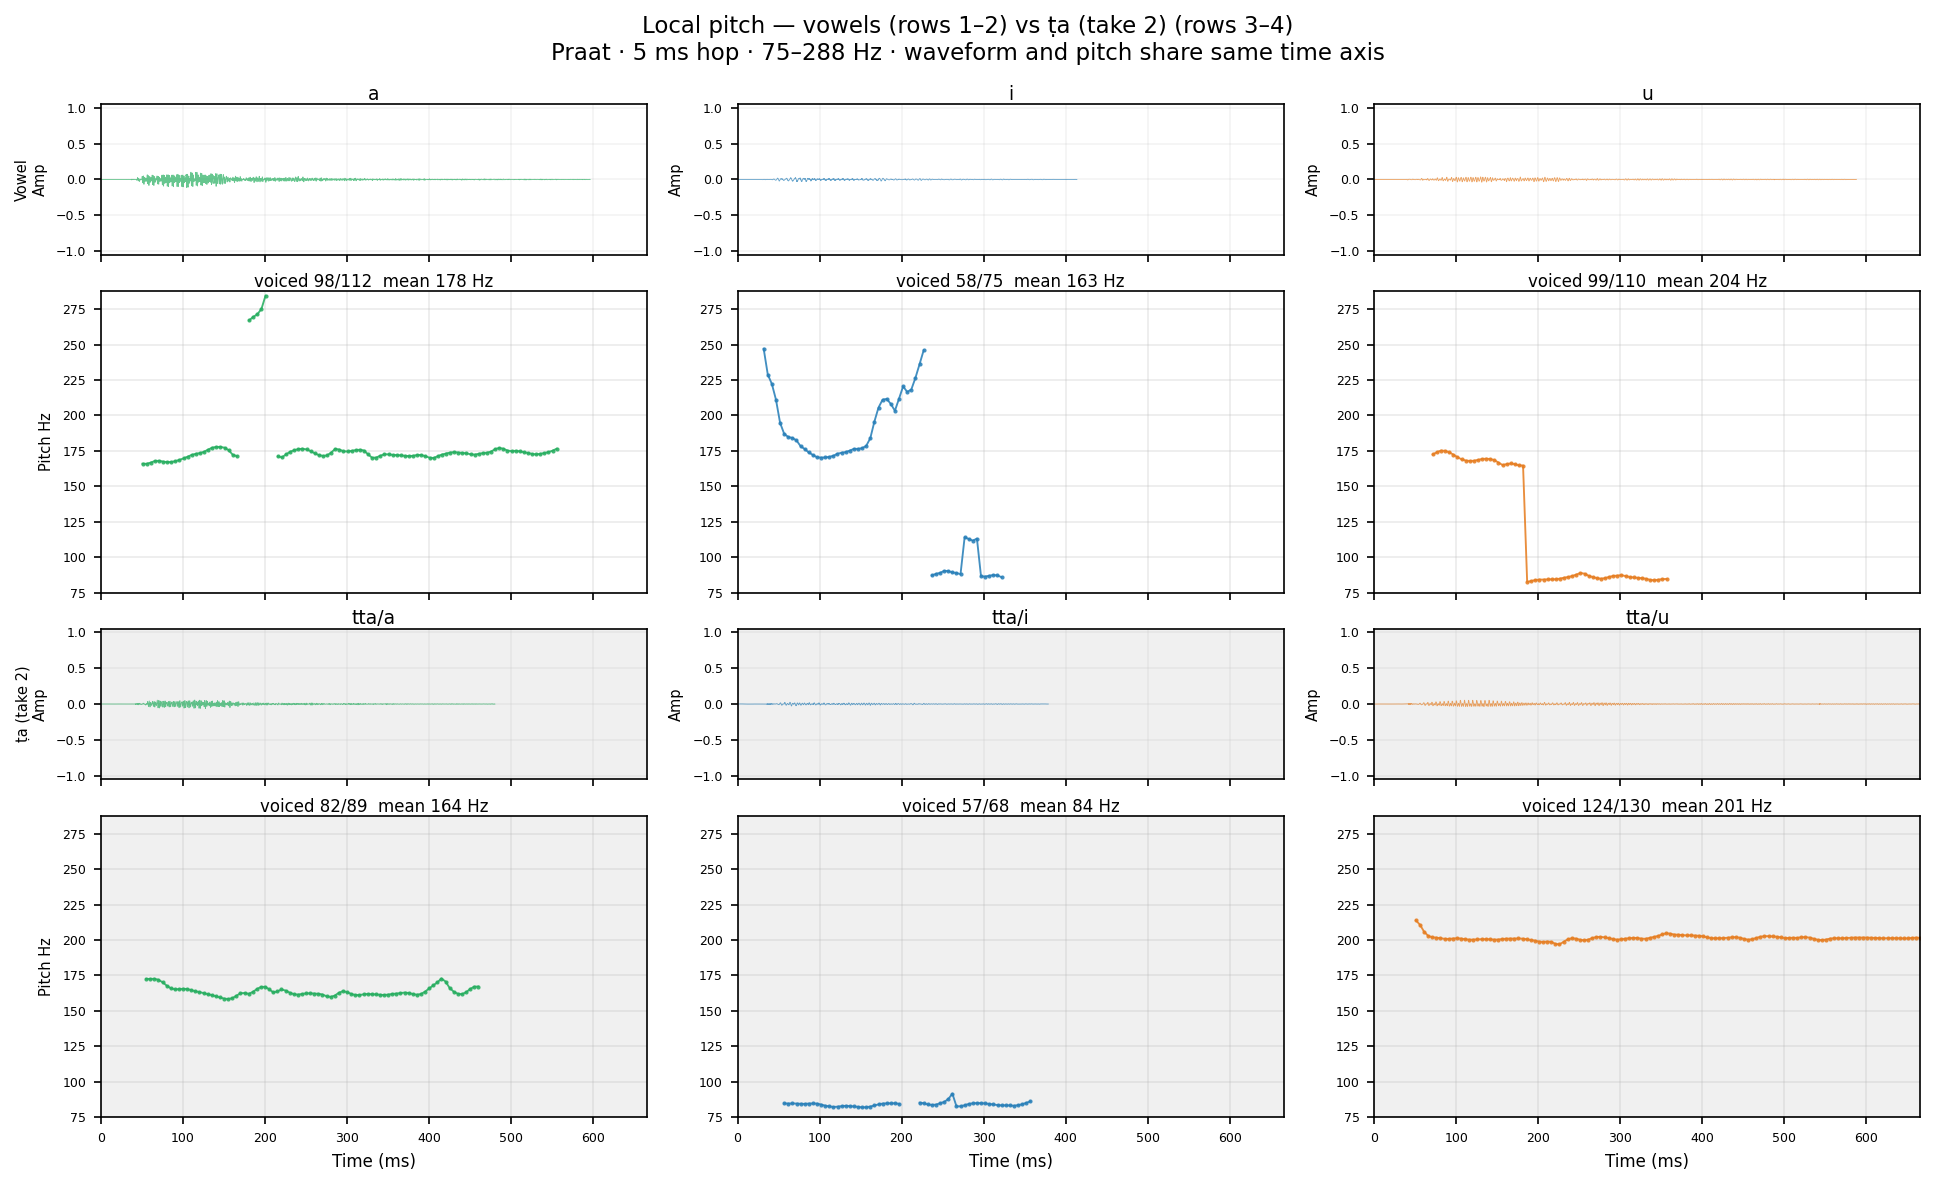
Human take 2 Same Praat settings as TTS. Compare burst gap duration and F0 onset.
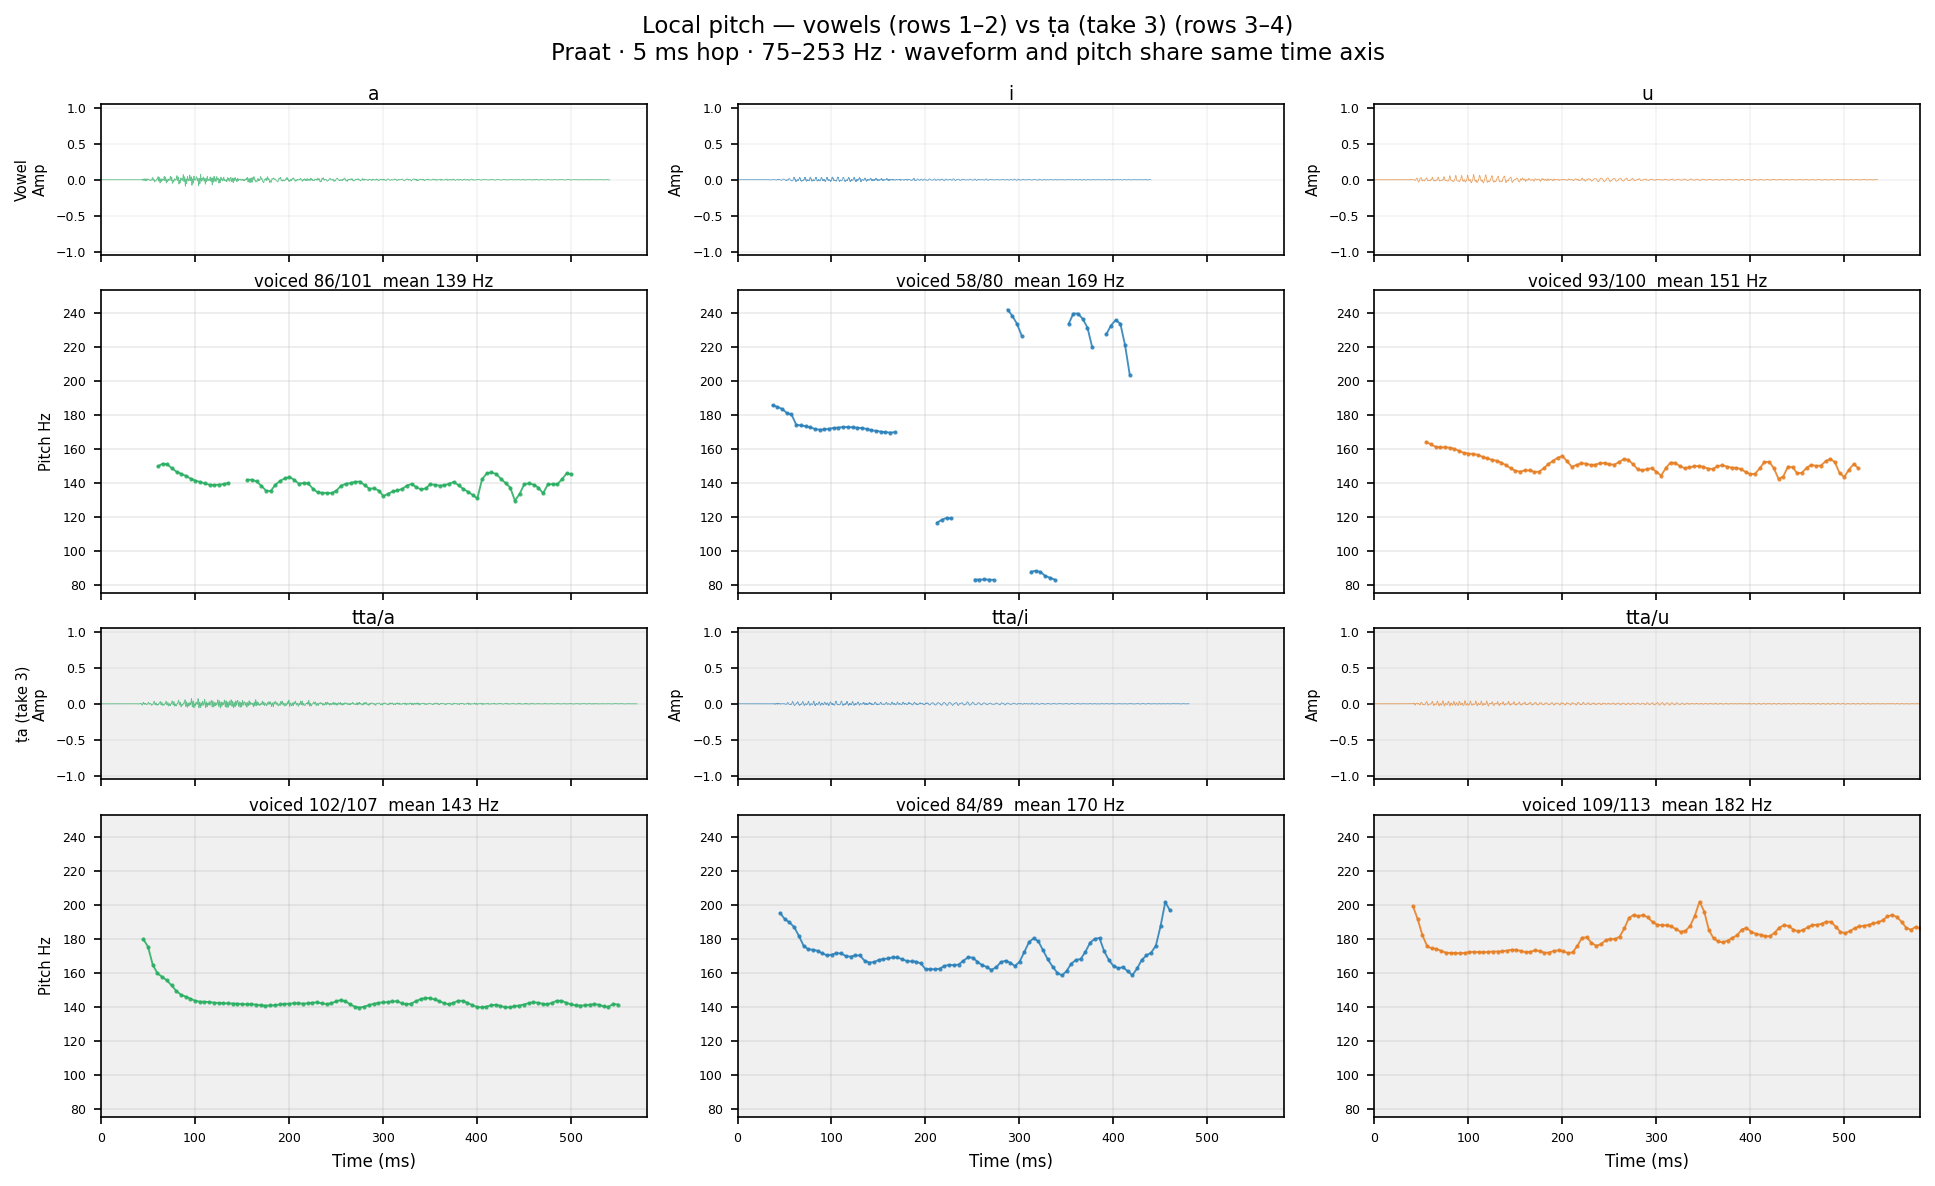
Human take 3 Same Praat settings as TTS. Compare burst gap duration and F0 onset.
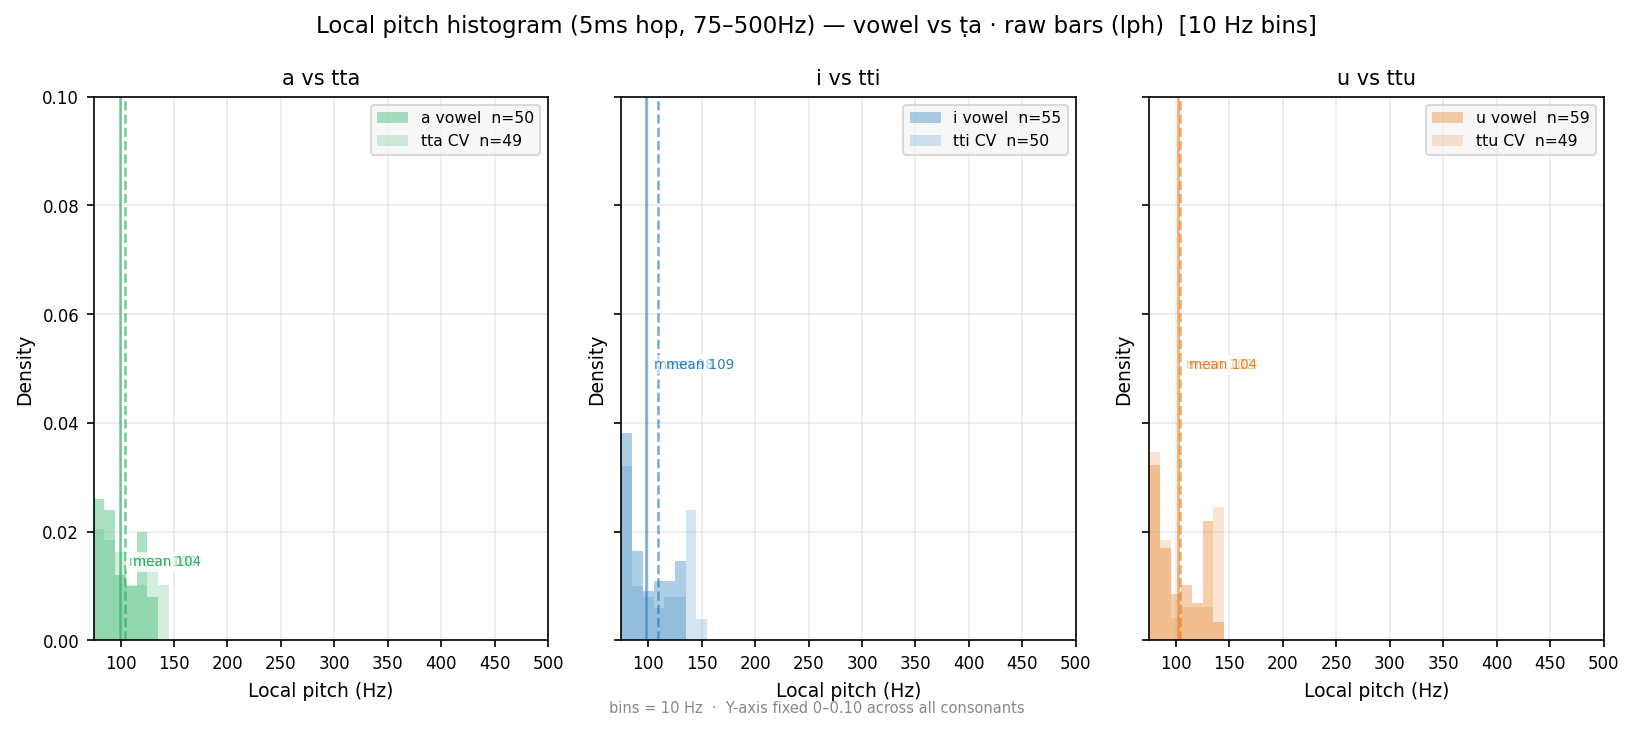
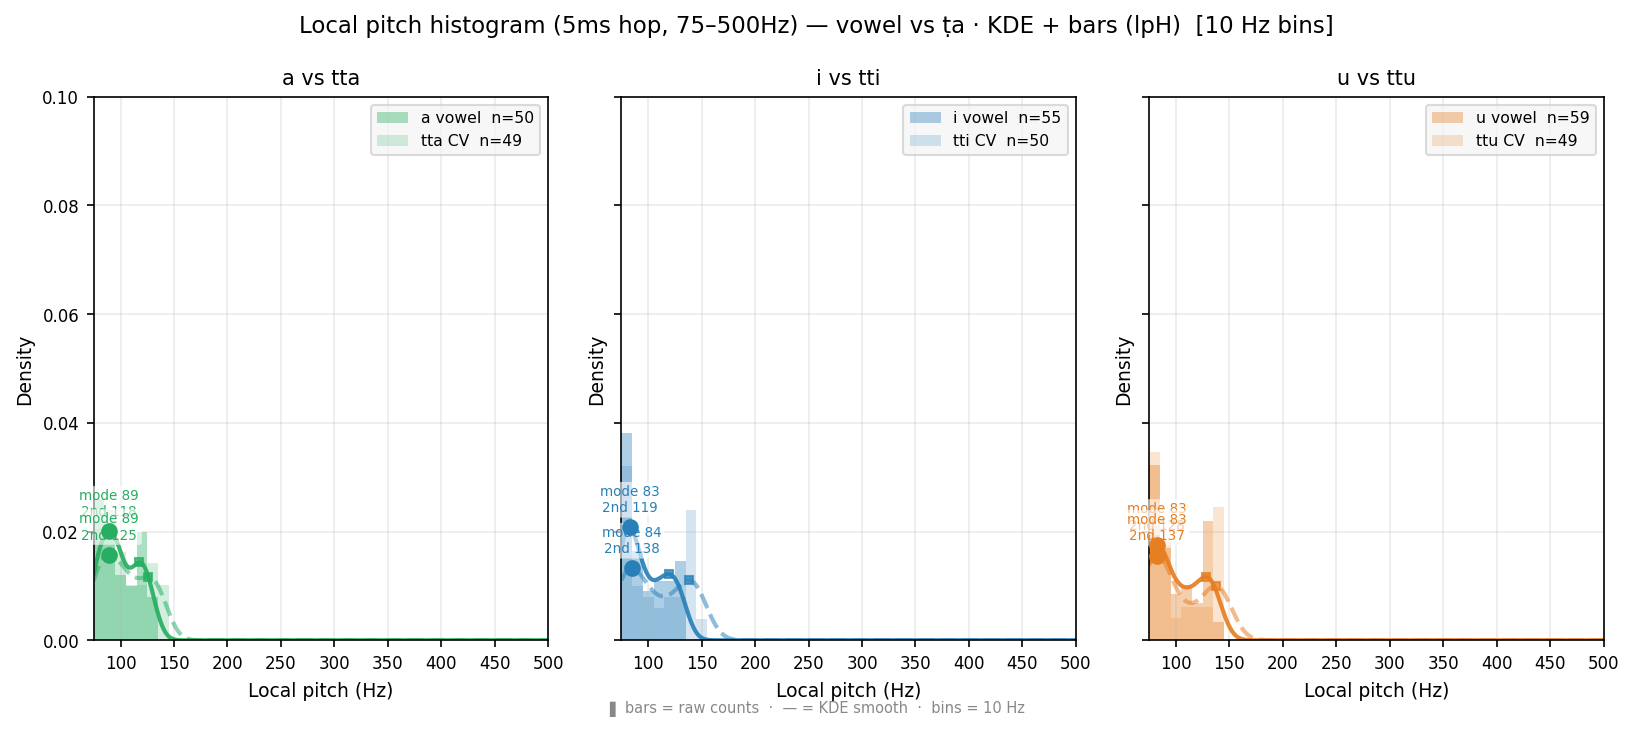
Local pitch (5ms hop, 75–500Hz) histogram — wider range than Pitch/F0 distribution (10ms, 75–300Hz). lpH = alpha bars + KDE smooth: readable peaks, secondary bump visible. lph = raw bars: unsmoothed, honest bin counts. Primary ● and secondary ■ peaks marked on KDE curve (lpH only). Wider X-axis (to 500Hz) may reveal F1 leakage for /i/ /u/ above 300Hz. Compare with Pitch/F0 distribution below for time-step and frequency-range effect.
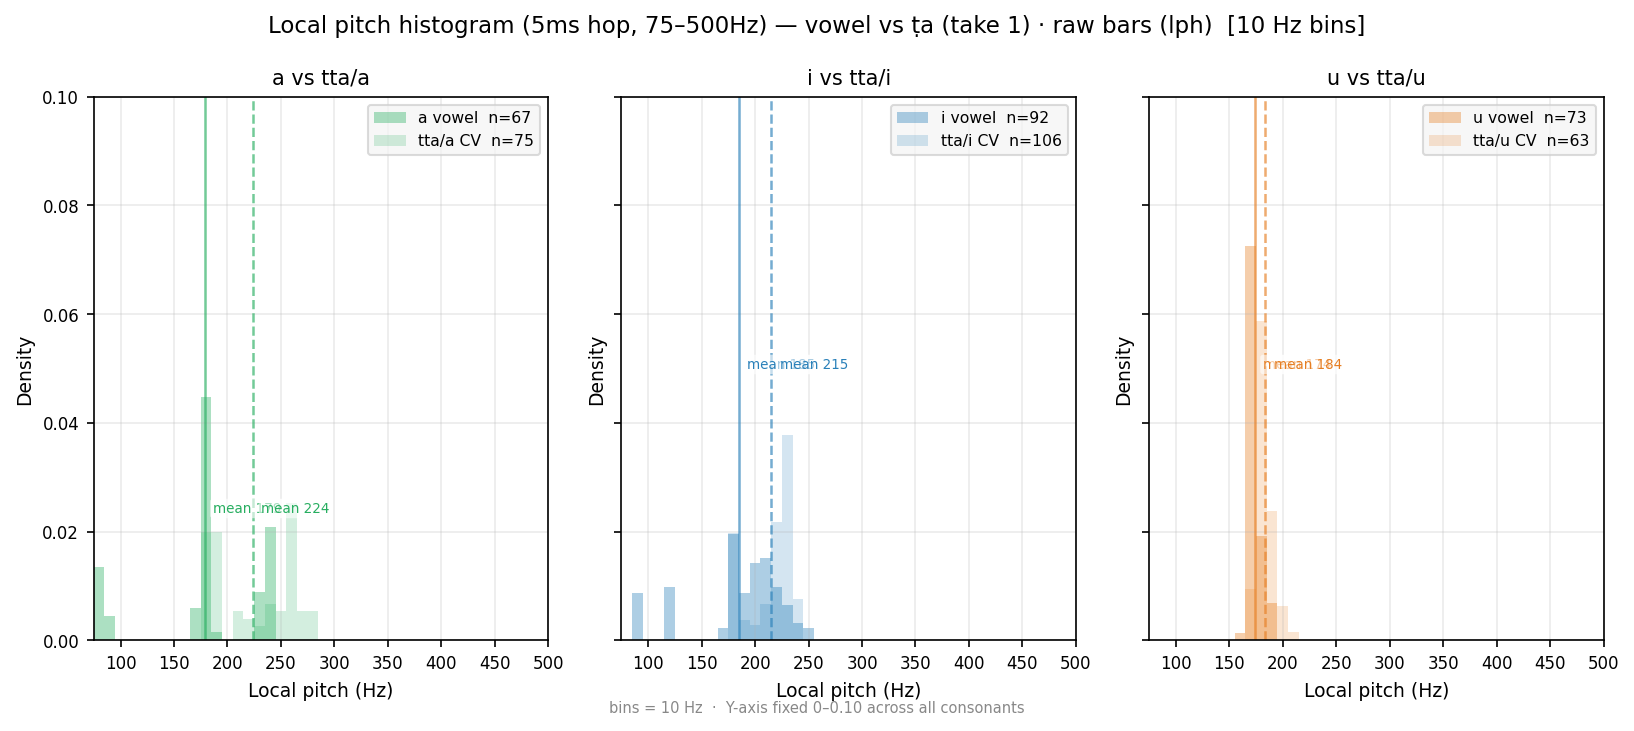
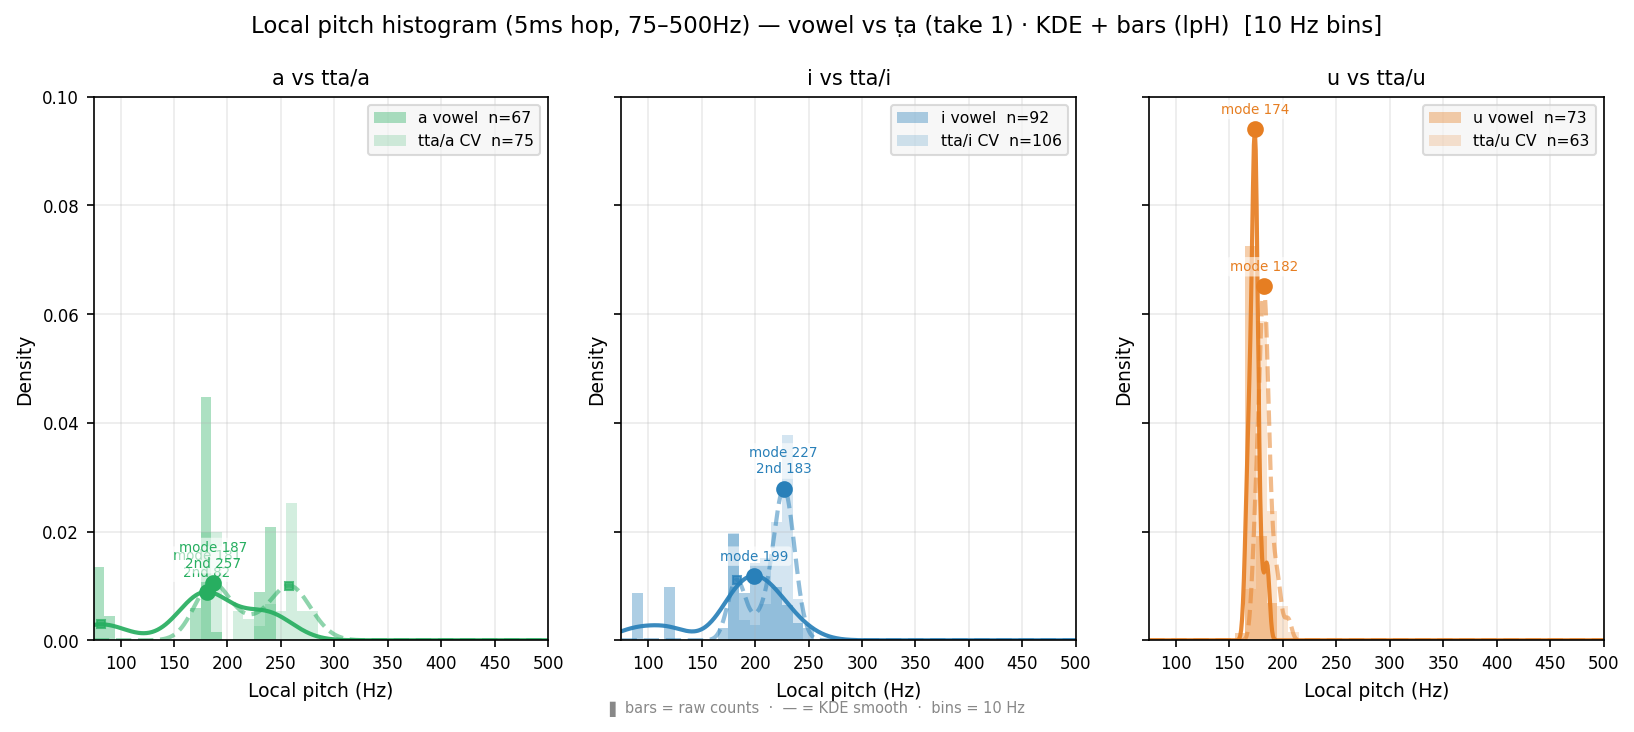
Local pitch (5ms hop, 75–500Hz) histogram — wider range than Pitch/F0 distribution (10ms, 75–300Hz). lpH = alpha bars + KDE smooth: readable peaks, secondary bump visible. lph = raw bars: unsmoothed, honest bin counts. Primary ● and secondary ■ peaks marked on KDE curve (lpH only). Wider X-axis (to 500Hz) may reveal F1 leakage for /i/ /u/ above 300Hz. Compare with Pitch/F0 distribution below for time-step and frequency-range effect.
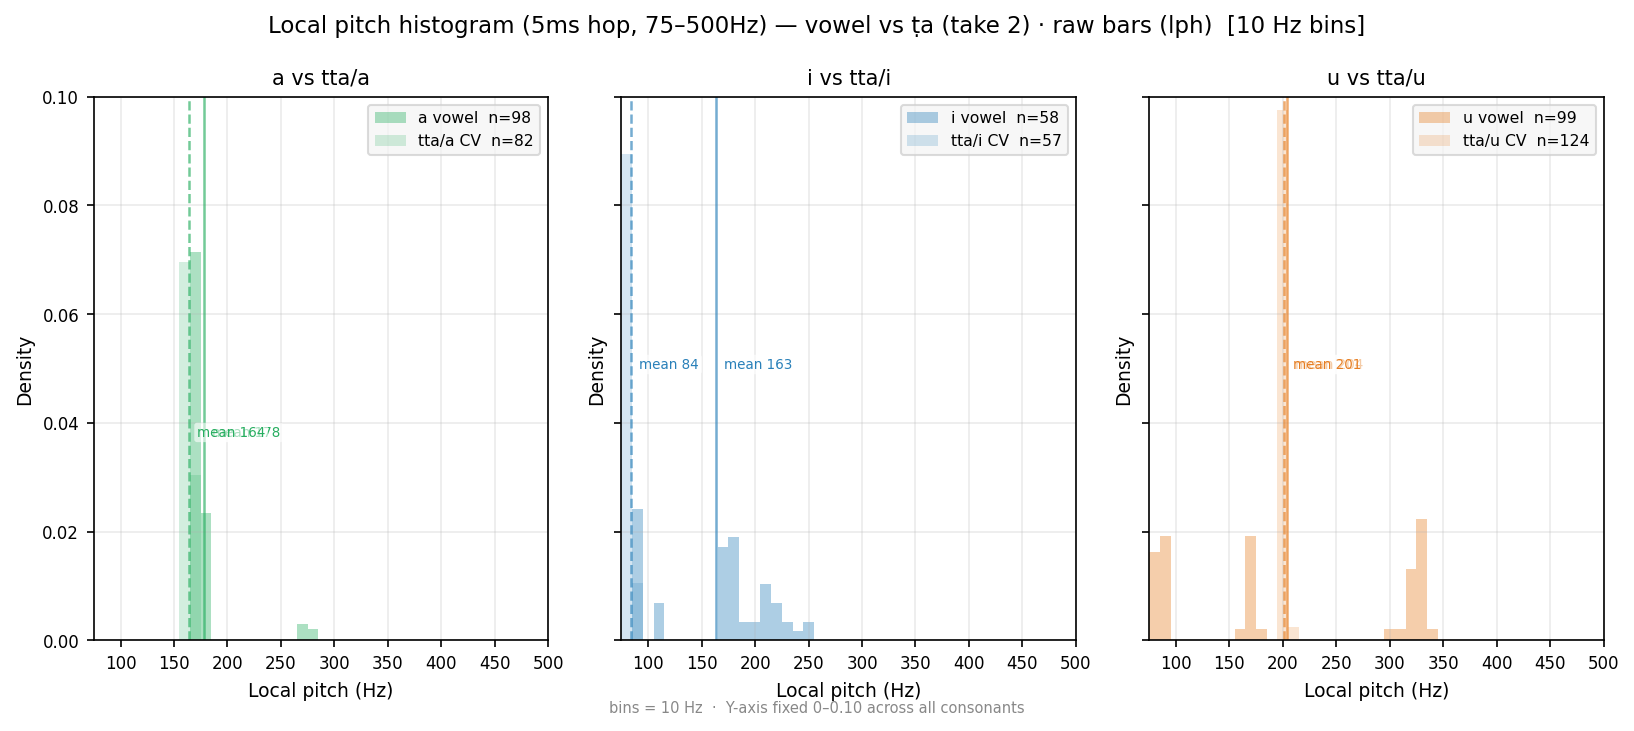
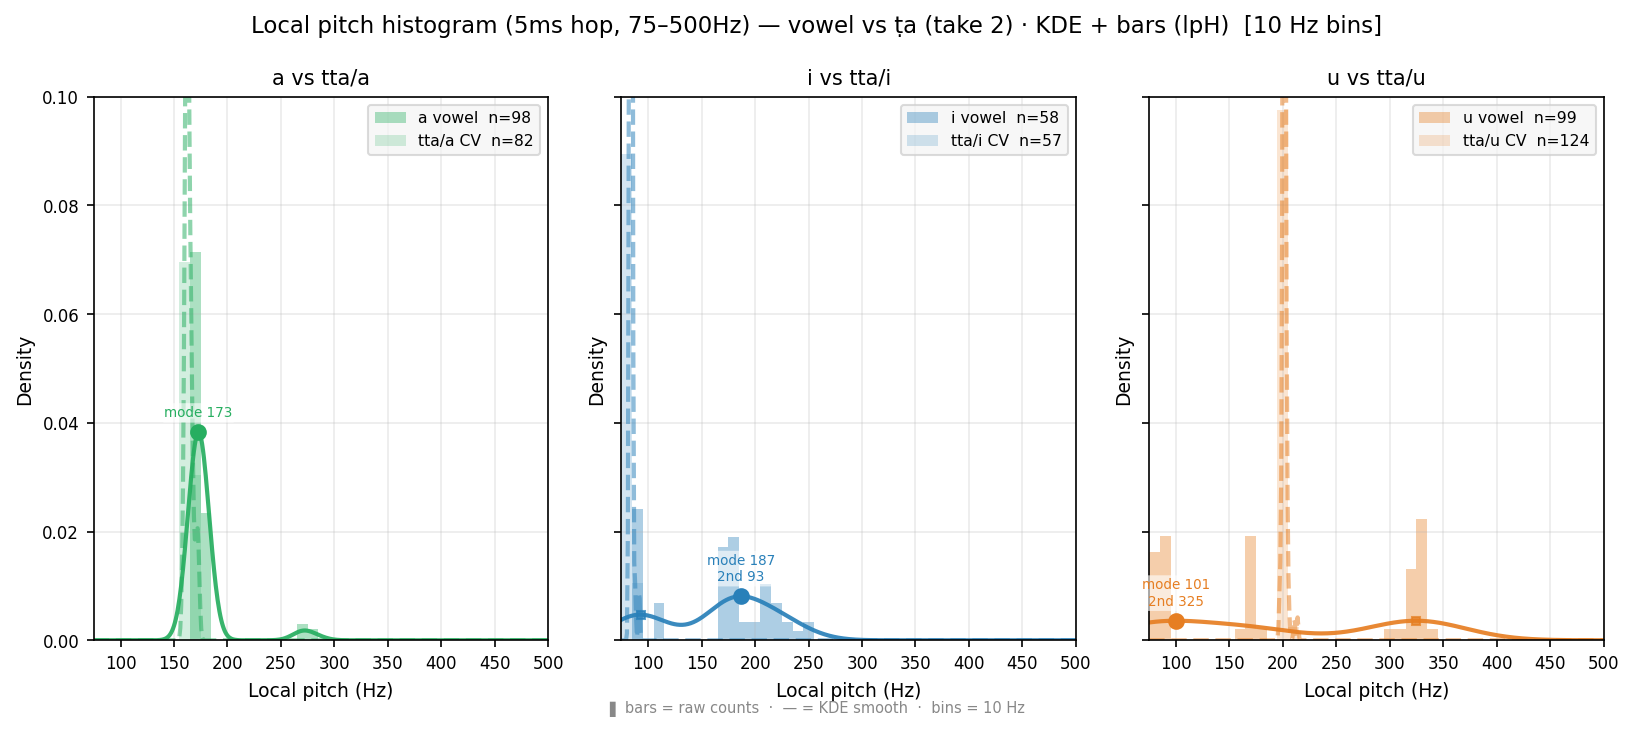
Local pitch (5ms hop, 75–500Hz) histogram — wider range than Pitch/F0 distribution (10ms, 75–300Hz). lpH = alpha bars + KDE smooth: readable peaks, secondary bump visible. lph = raw bars: unsmoothed, honest bin counts. Primary ● and secondary ■ peaks marked on KDE curve (lpH only). Wider X-axis (to 500Hz) may reveal F1 leakage for /i/ /u/ above 300Hz. Compare with Pitch/F0 distribution below for time-step and frequency-range effect.
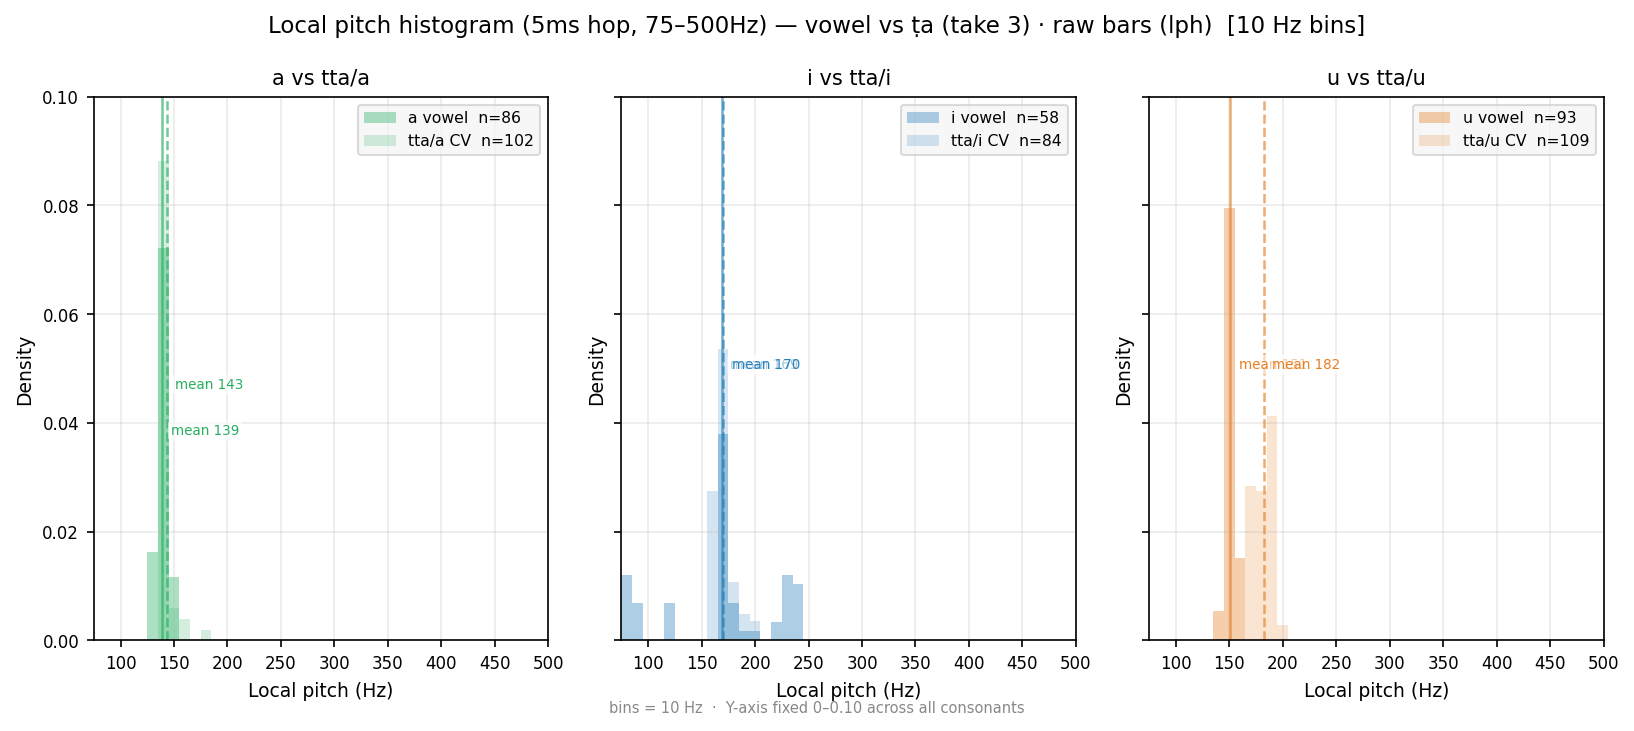
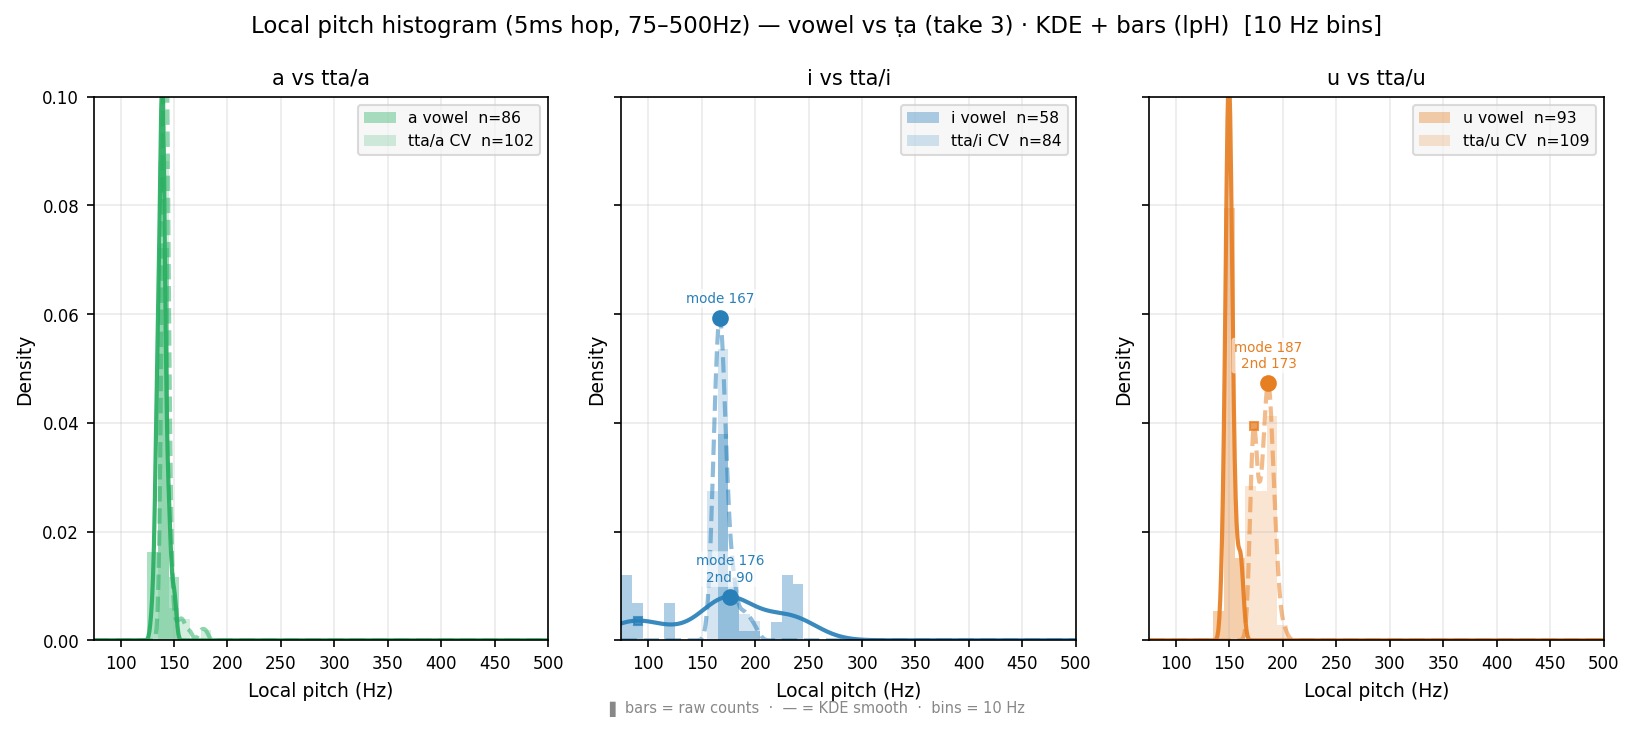
Local pitch (5ms hop, 75–500Hz) histogram — wider range than Pitch/F0 distribution (10ms, 75–300Hz). lpH = alpha bars + KDE smooth: readable peaks, secondary bump visible. lph = raw bars: unsmoothed, honest bin counts. Primary ● and secondary ■ peaks marked on KDE curve (lpH only). Wider X-axis (to 500Hz) may reveal F1 leakage for /i/ /u/ above 300Hz. Compare with Pitch/F0 distribution below for time-step and frequency-range effect.
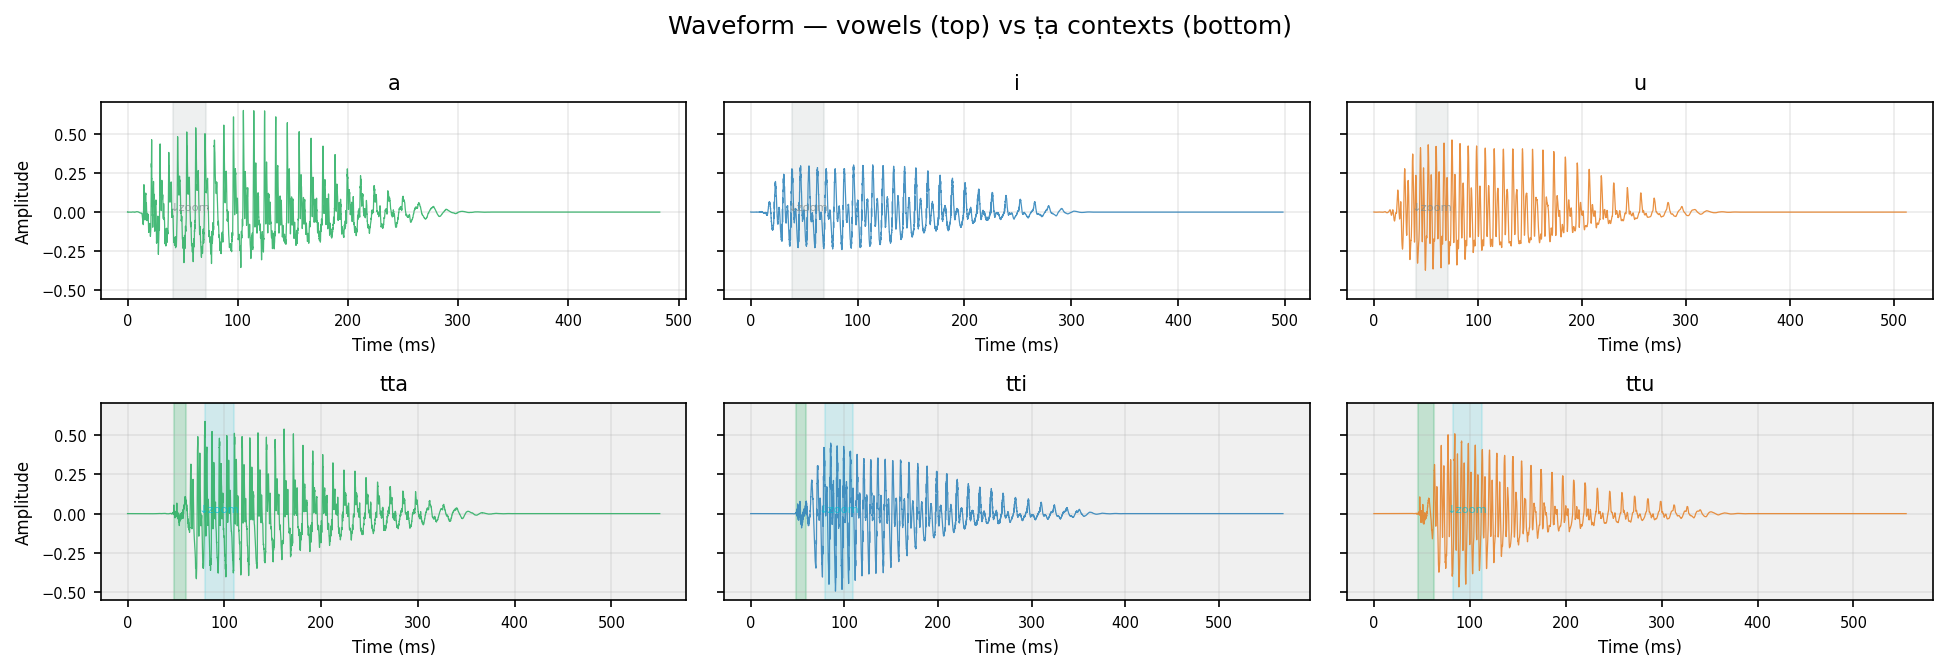
Green shading on CV waveforms = detected burst window (speech onset → first Praat-voiced frame).
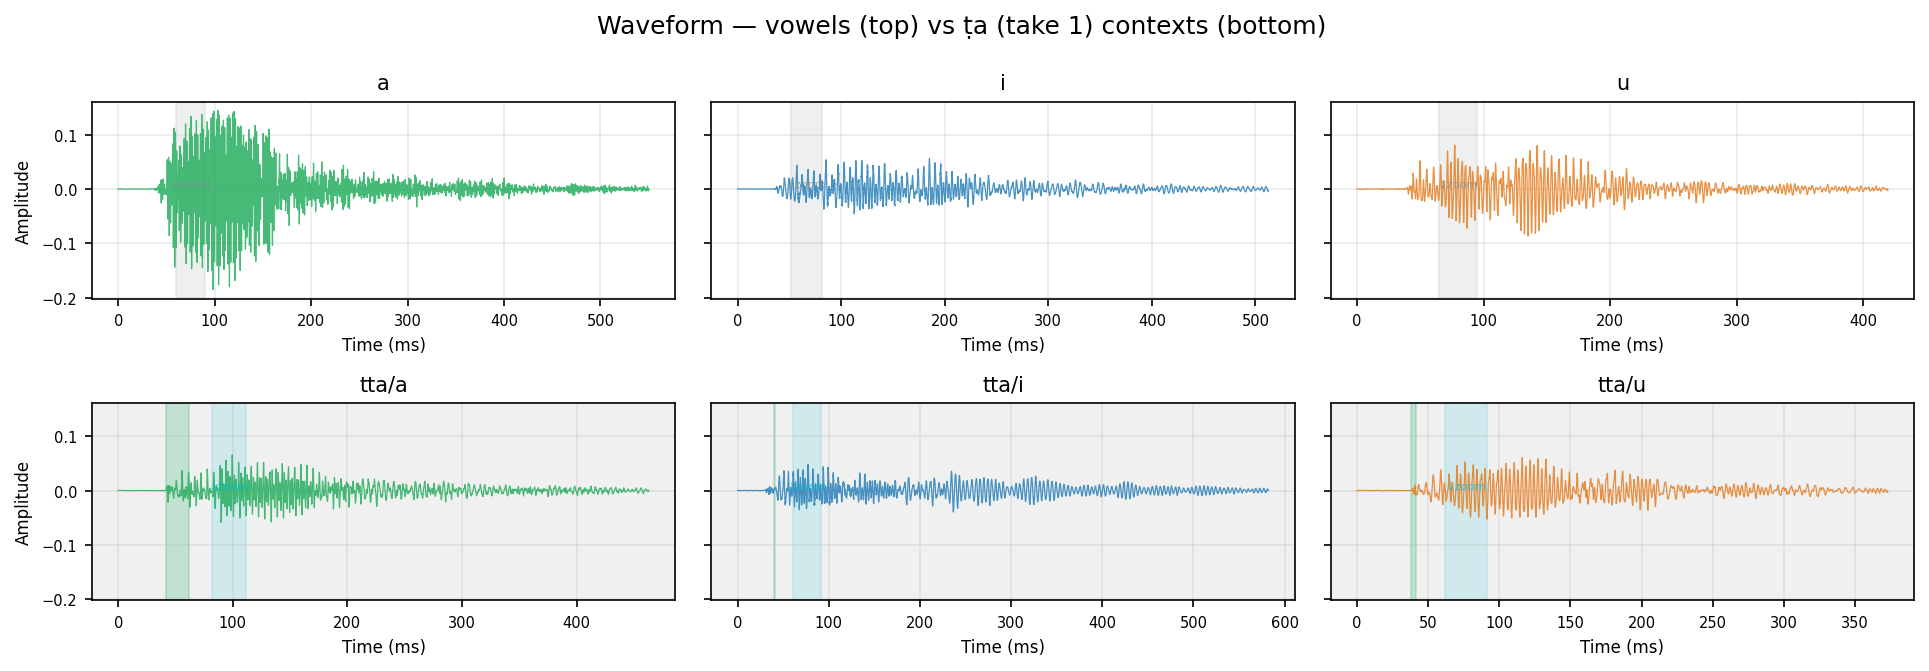
Human take 1
Green shading on CV waveforms = detected burst window (speech onset → first Praat-voiced frame).
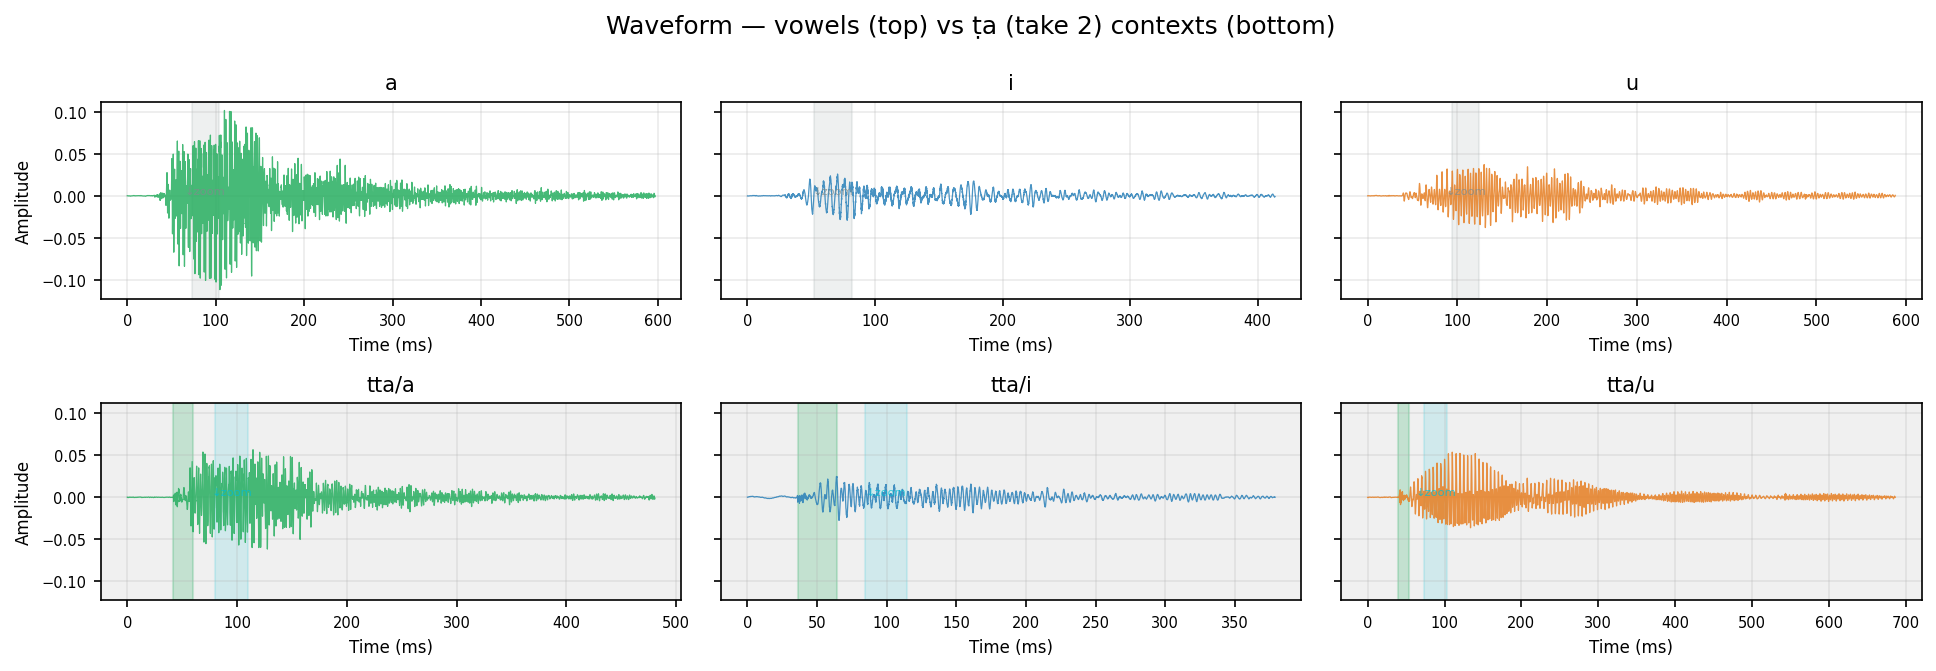
Human take 2
Green shading on CV waveforms = detected burst window (speech onset → first Praat-voiced frame).
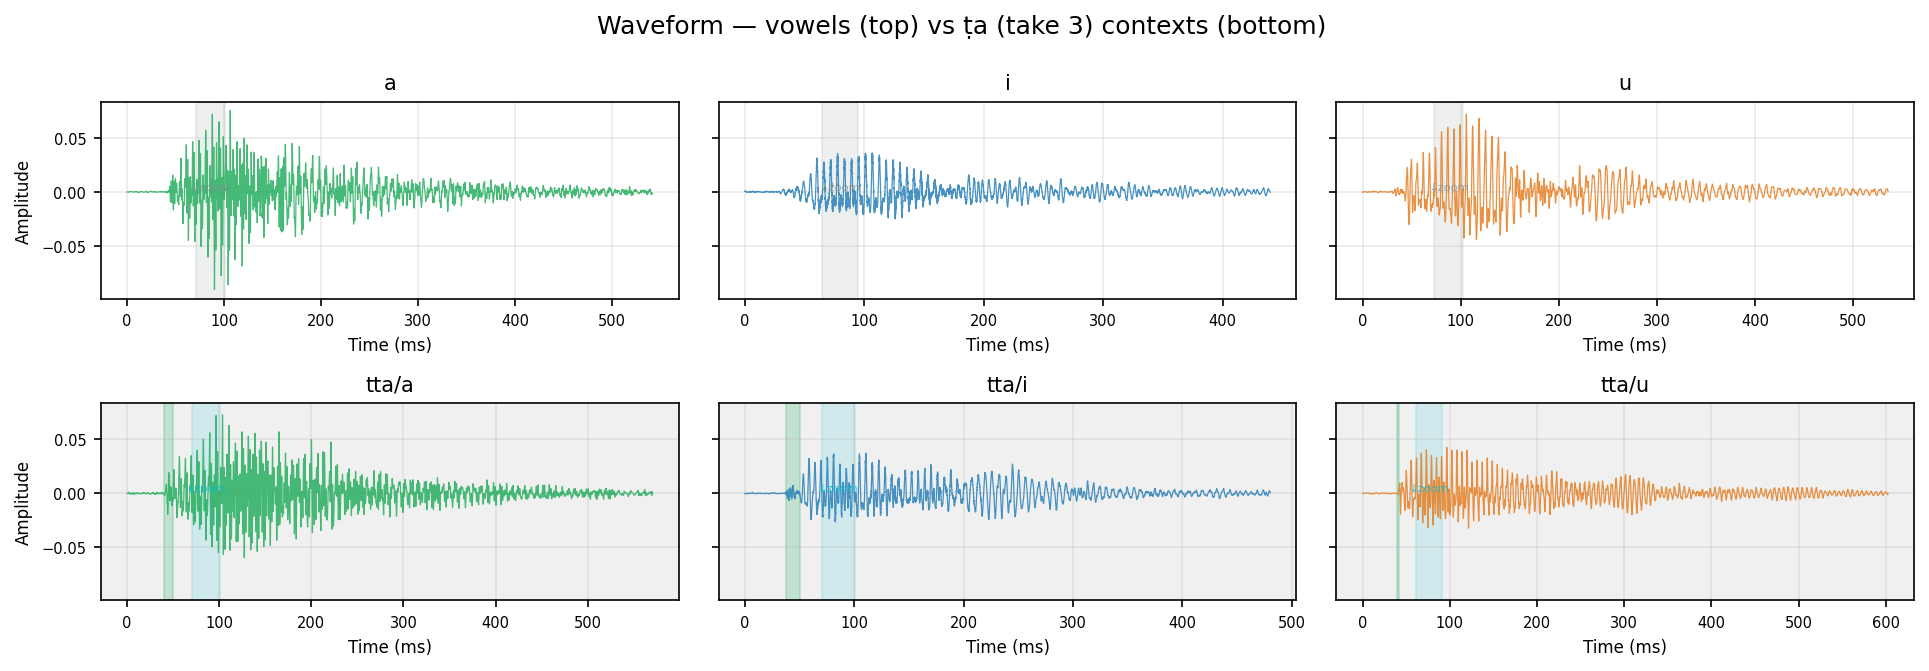
Human take 3
Green shading on CV waveforms = detected burst window (speech onset → first Praat-voiced frame).
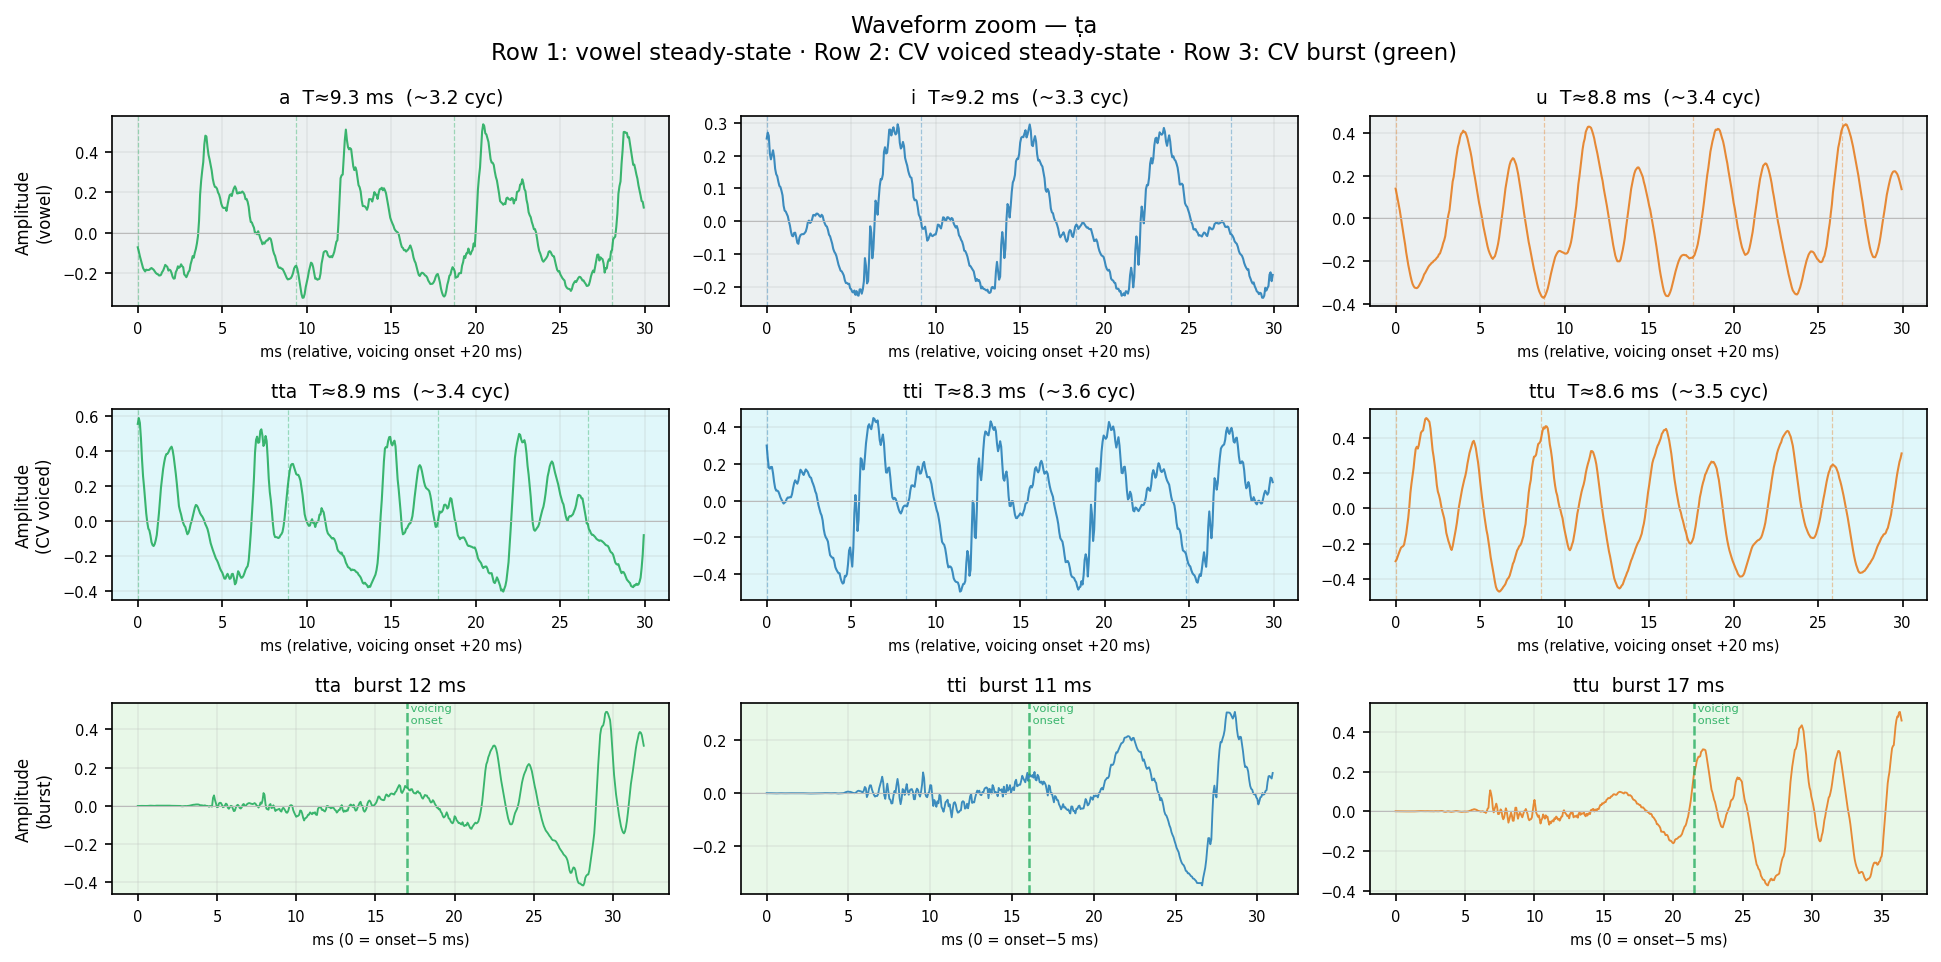
Row 1 (gray): Pure vowel steady-state — 30 ms, 20 ms after voicing onset. Row 2 (cyan): CV voiced steady-state — same window, shows vowel after consonant release. Row 3 (green): CV burst — aperiodic noise from stop release → transition to voicing (green dashed line = first voiced frame). Burst shape and duration differ by place of articulation. Dashed verticals in rows 1–2 = expected glottal period T = 1/F0. Waveform complexity = harmonic richness (pure sine = single harmonic; jagged = rich harmonics).
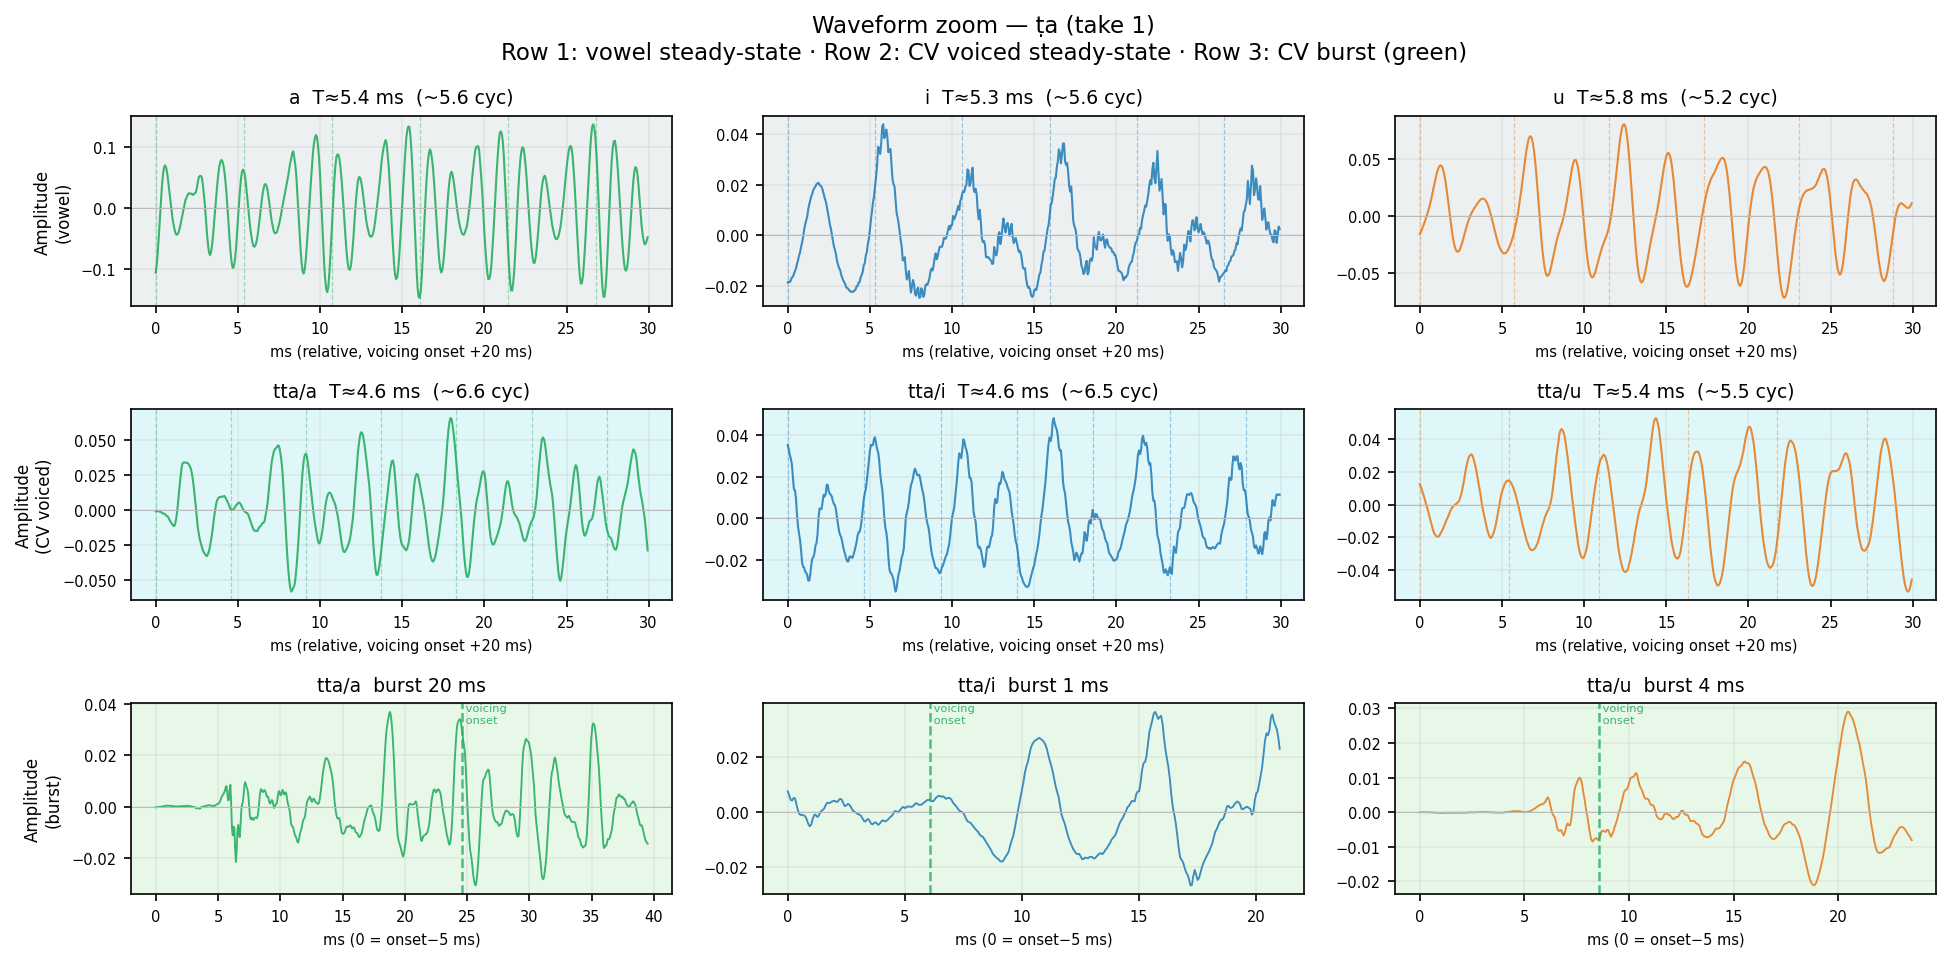
Human take 1
Row 1 (gray): Pure vowel steady-state — 30 ms, 20 ms after voicing onset. Row 2 (cyan): CV voiced steady-state — same window, shows vowel after consonant release. Row 3 (green): CV burst — aperiodic noise from stop release → transition to voicing (green dashed line = first voiced frame). Burst shape and duration differ by place of articulation. Dashed verticals in rows 1–2 = expected glottal period T = 1/F0. Waveform complexity = harmonic richness (pure sine = single harmonic; jagged = rich harmonics).
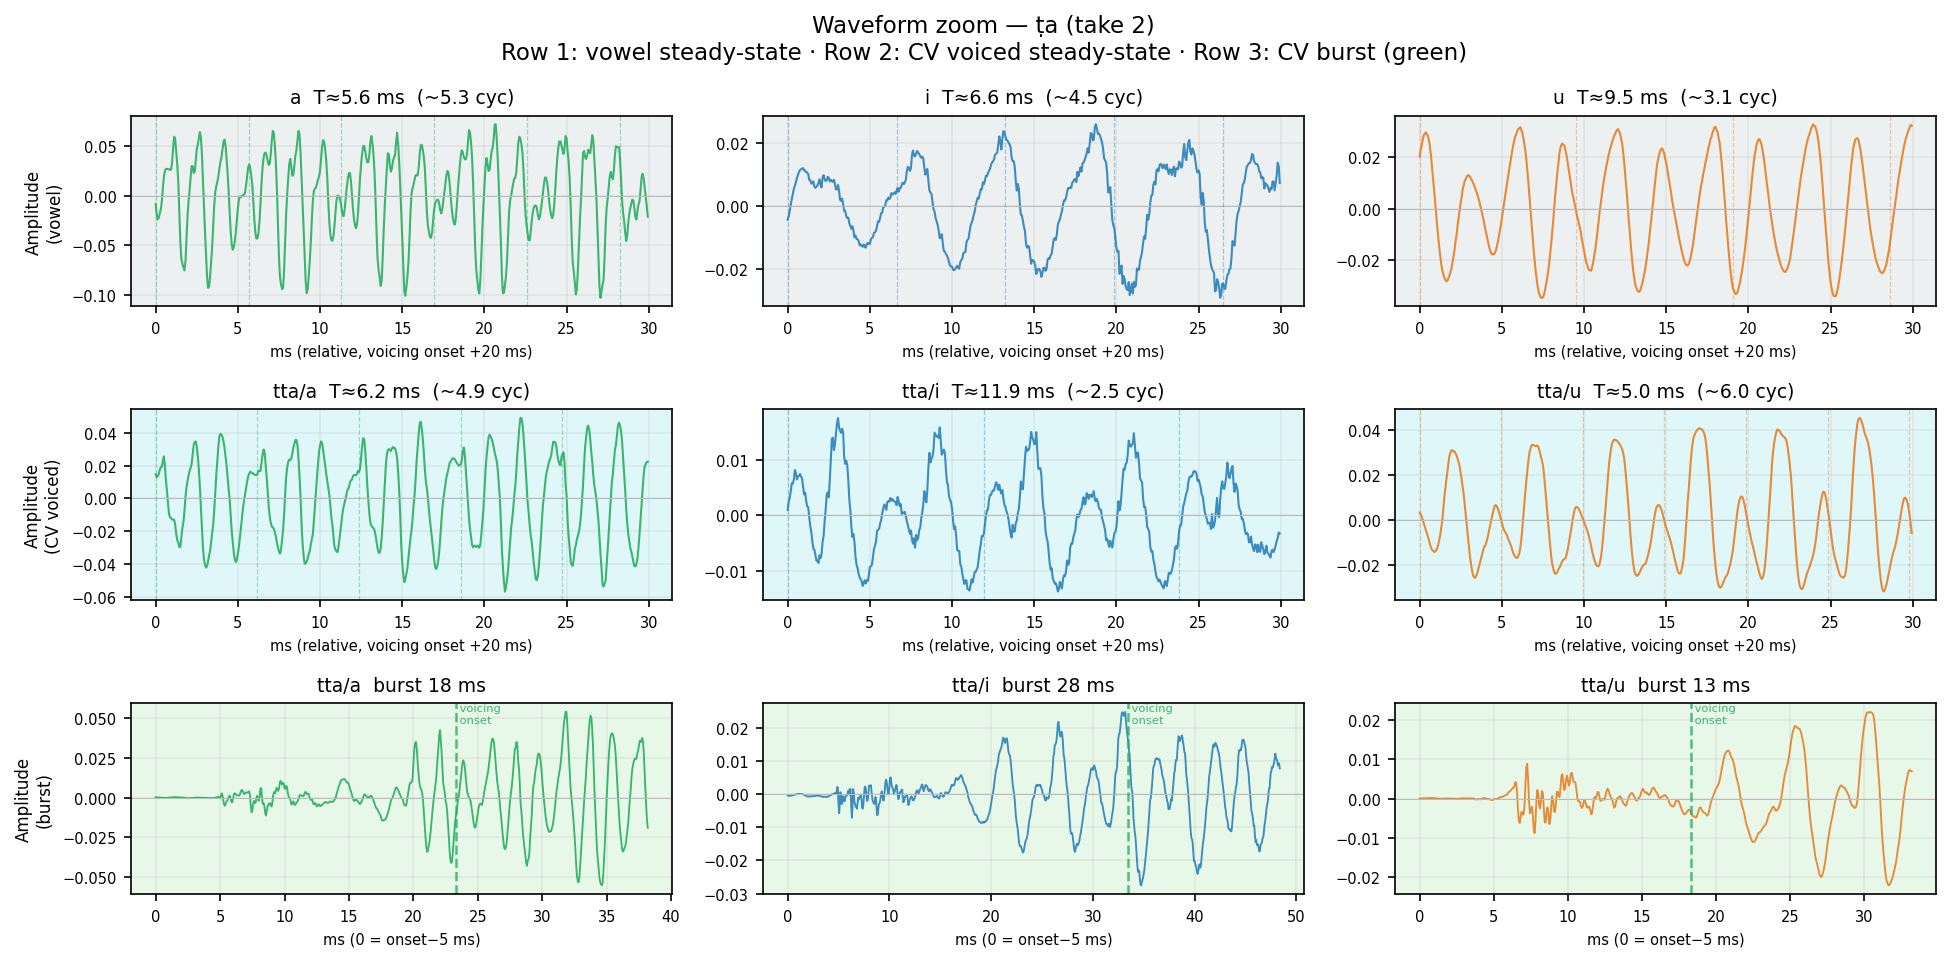
Human take 2
Row 1 (gray): Pure vowel steady-state — 30 ms, 20 ms after voicing onset. Row 2 (cyan): CV voiced steady-state — same window, shows vowel after consonant release. Row 3 (green): CV burst — aperiodic noise from stop release → transition to voicing (green dashed line = first voiced frame). Burst shape and duration differ by place of articulation. Dashed verticals in rows 1–2 = expected glottal period T = 1/F0. Waveform complexity = harmonic richness (pure sine = single harmonic; jagged = rich harmonics).
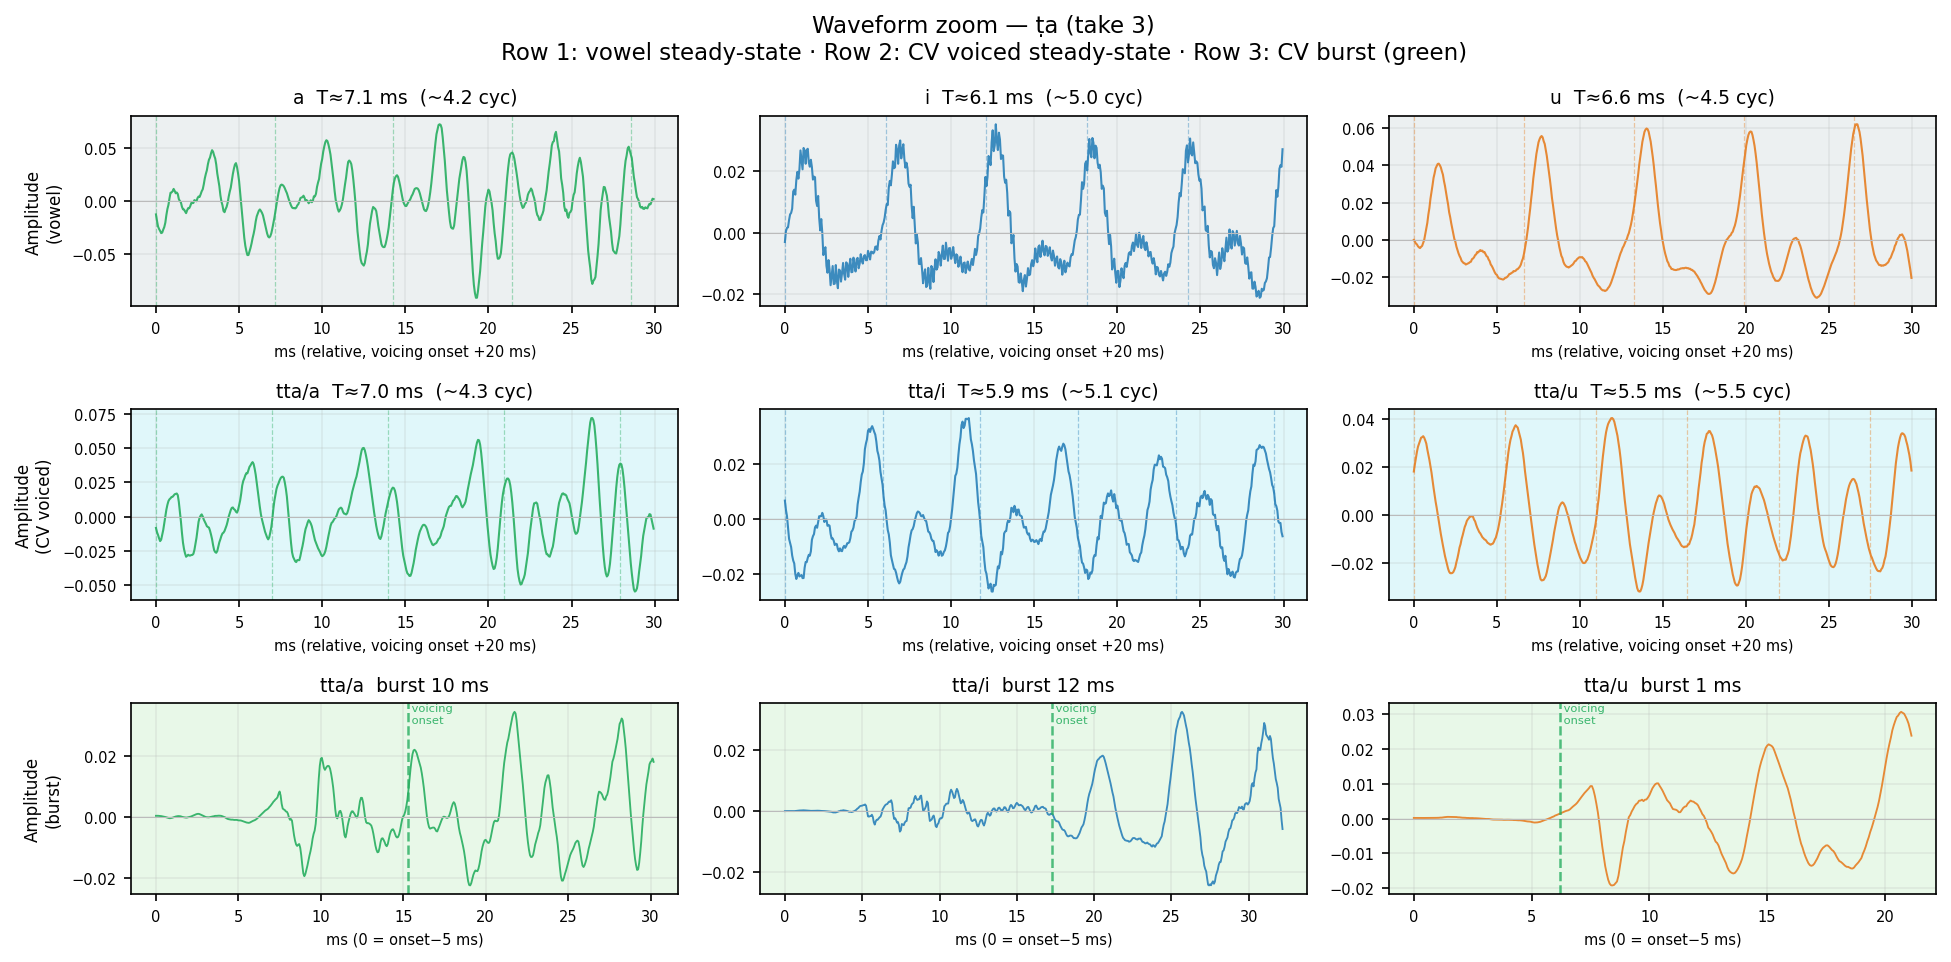
Human take 3
Row 1 (gray): Pure vowel steady-state — 30 ms, 20 ms after voicing onset. Row 2 (cyan): CV voiced steady-state — same window, shows vowel after consonant release. Row 3 (green): CV burst — aperiodic noise from stop release → transition to voicing (green dashed line = first voiced frame). Burst shape and duration differ by place of articulation. Dashed verticals in rows 1–2 = expected glottal period T = 1/F0. Waveform complexity = harmonic richness (pure sine = single harmonic; jagged = rich harmonics).
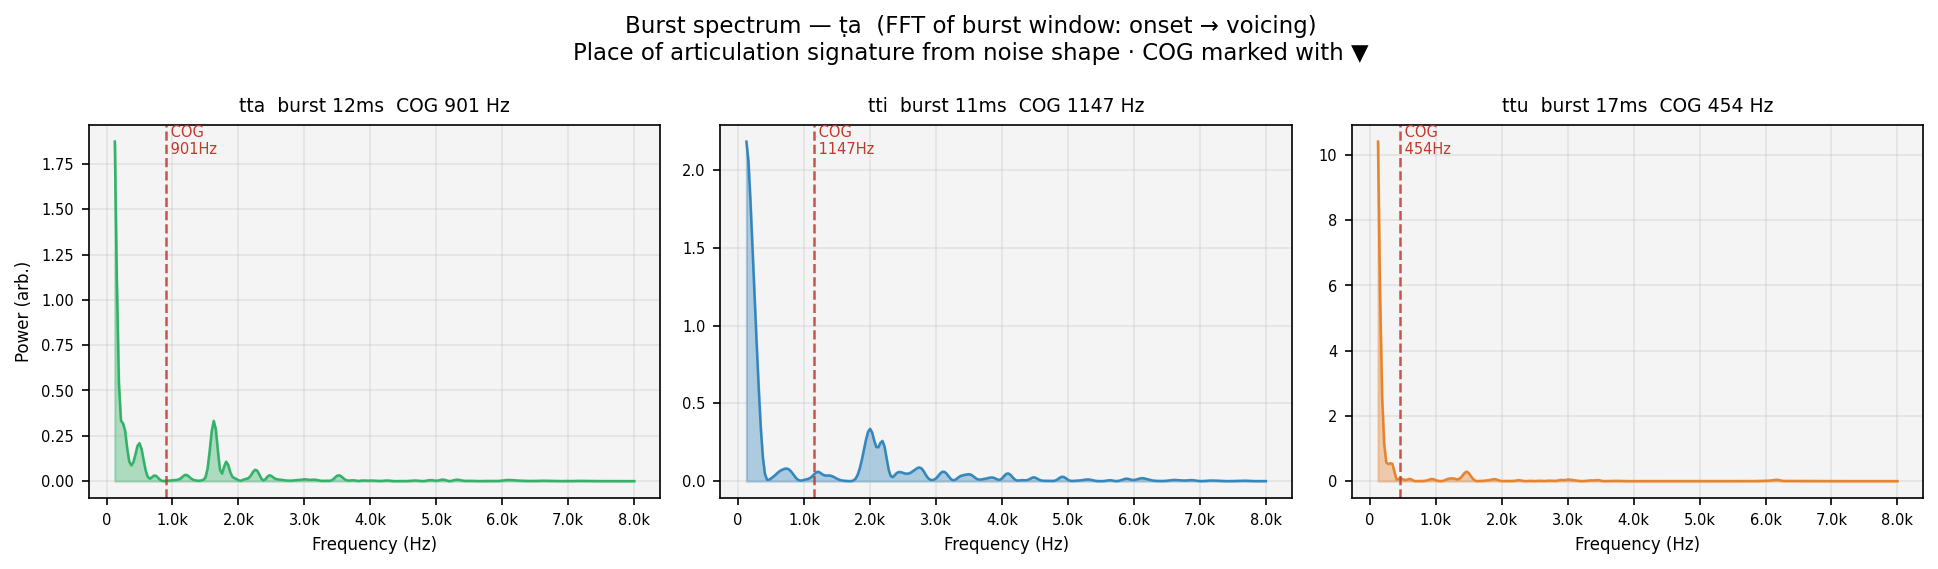
FFT of the aperiodic burst window (speech onset → first voiced frame) for each vowel context. Spectral centre of gravity (COG, red dashed) marks the dominant noise frequency — a place-of-articulation signature independent of the vowel. Velars peak mid-frequency (~1–2 kHz); dentals/alveolars peak high (>3 kHz); labials are spectrally flat. COG should be consistent across /a/i/u/ for the same consonant — vowel context should not change where the burst energy is.
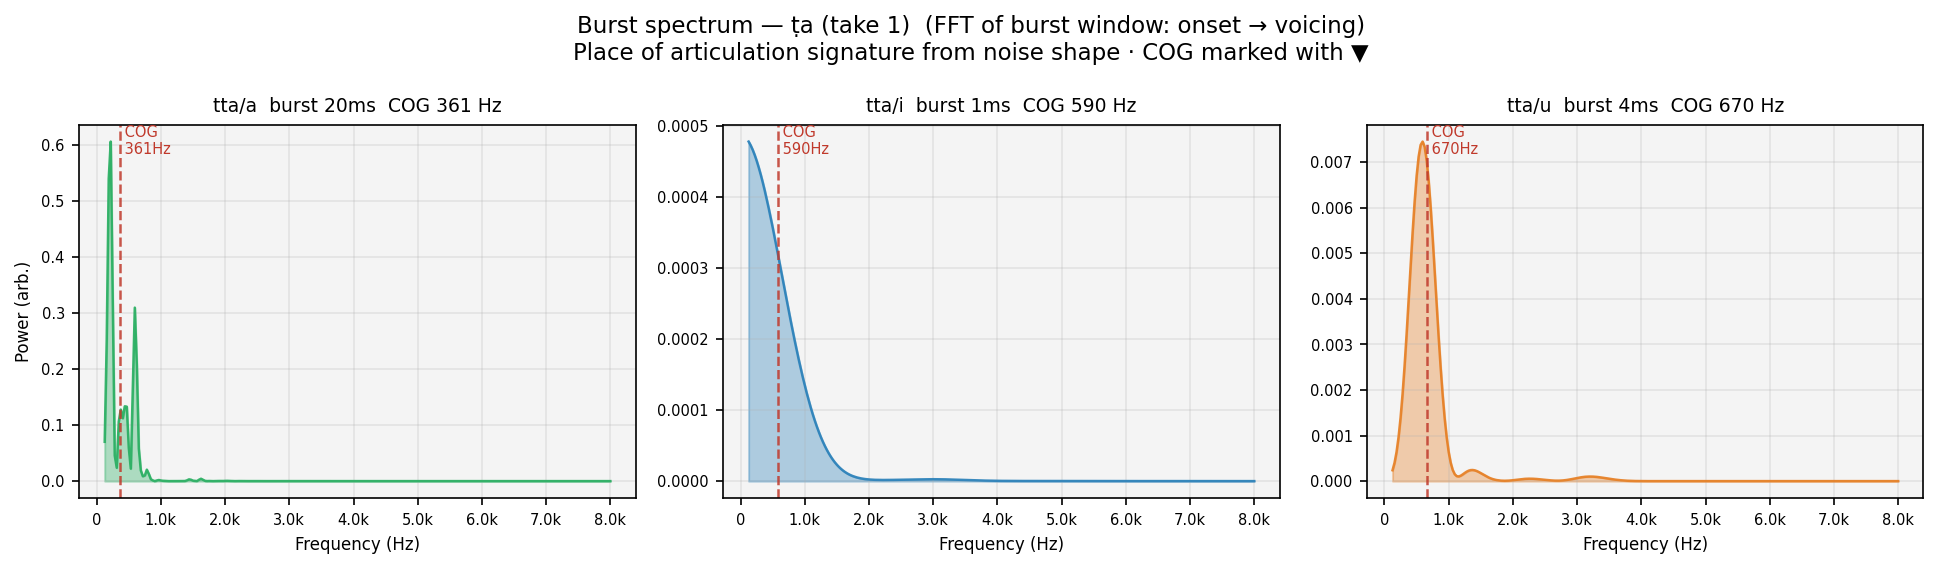
Human take 1
FFT of the aperiodic burst window (speech onset → first voiced frame) for each vowel context. Spectral centre of gravity (COG, red dashed) marks the dominant noise frequency — a place-of-articulation signature independent of the vowel. Velars peak mid-frequency (~1–2 kHz); dentals/alveolars peak high (>3 kHz); labials are spectrally flat. COG should be consistent across /a/i/u/ for the same consonant — vowel context should not change where the burst energy is.
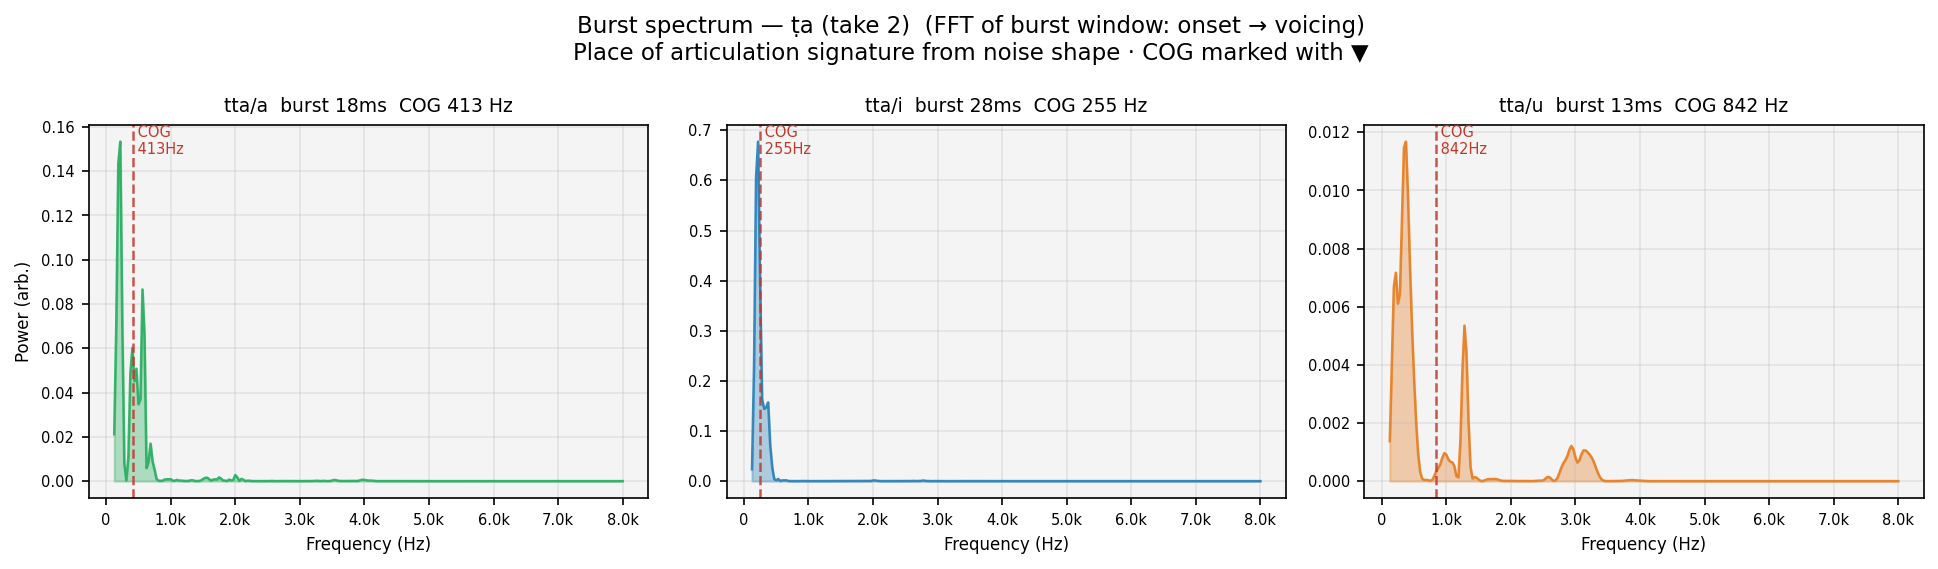
Human take 2
FFT of the aperiodic burst window (speech onset → first voiced frame) for each vowel context. Spectral centre of gravity (COG, red dashed) marks the dominant noise frequency — a place-of-articulation signature independent of the vowel. Velars peak mid-frequency (~1–2 kHz); dentals/alveolars peak high (>3 kHz); labials are spectrally flat. COG should be consistent across /a/i/u/ for the same consonant — vowel context should not change where the burst energy is.
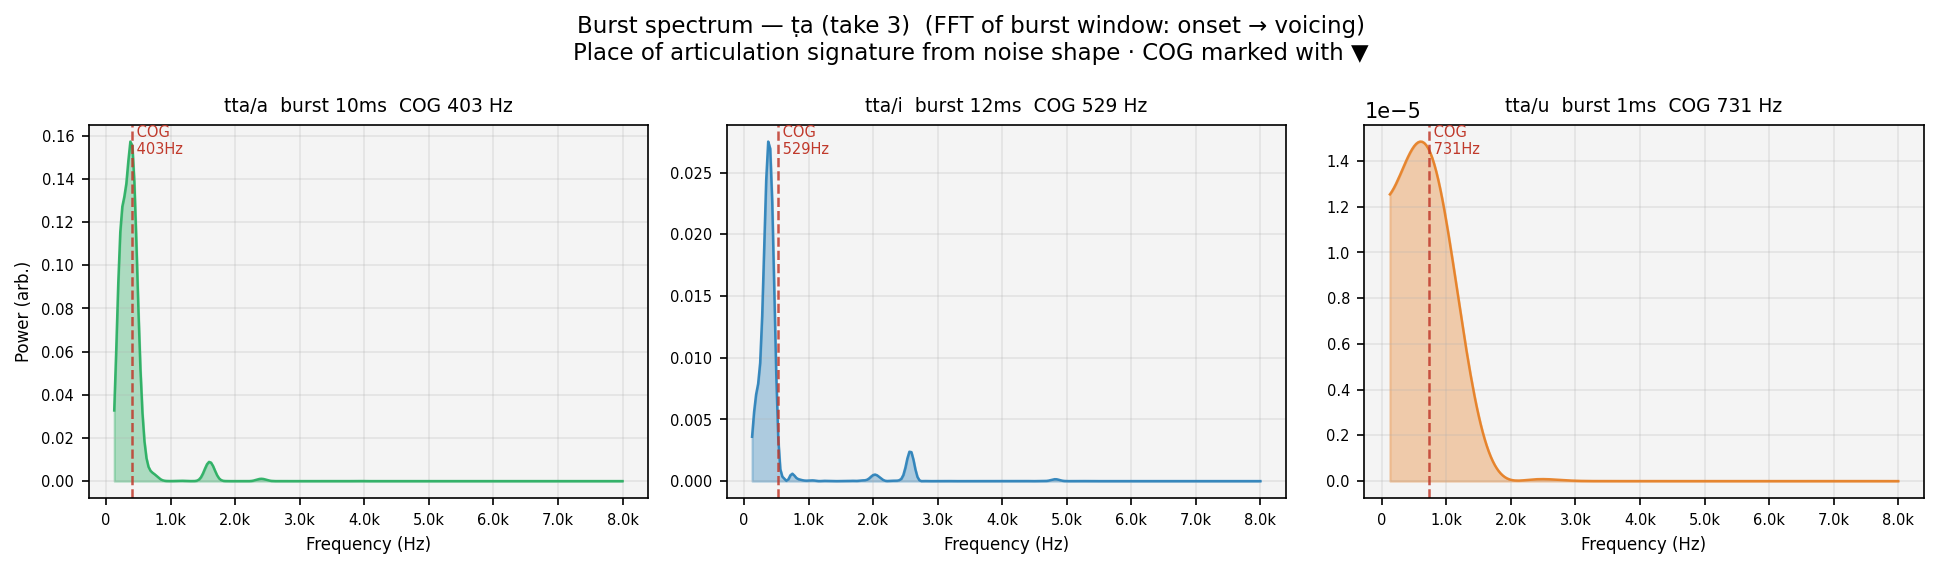
Human take 3
FFT of the aperiodic burst window (speech onset → first voiced frame) for each vowel context. Spectral centre of gravity (COG, red dashed) marks the dominant noise frequency — a place-of-articulation signature independent of the vowel. Velars peak mid-frequency (~1–2 kHz); dentals/alveolars peak high (>3 kHz); labials are spectrally flat. COG should be consistent across /a/i/u/ for the same consonant — vowel context should not change where the burst energy is.
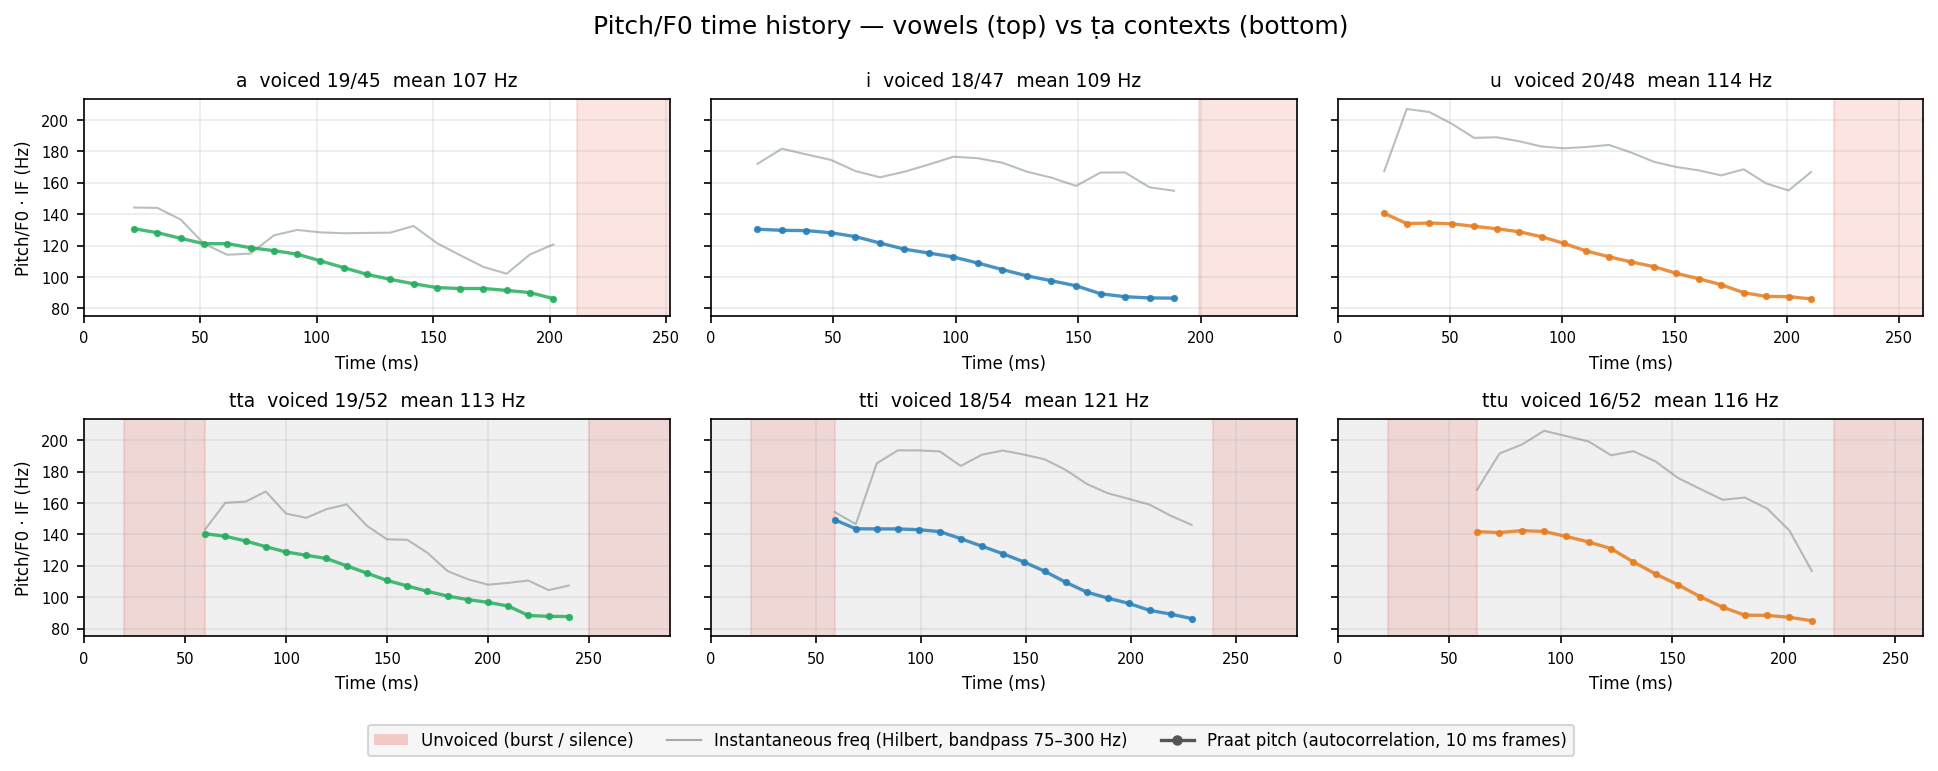
Colored dots = Praat pitch (autocorrelation, 10 ms frames). Gray line = instantaneous frequency (Hilbert transform on 75–300 Hz bandpass). Both show F0 region — IF is noisier; Praat smooths by choosing the most periodic candidate. Red shade = unvoiced (burst / silence).
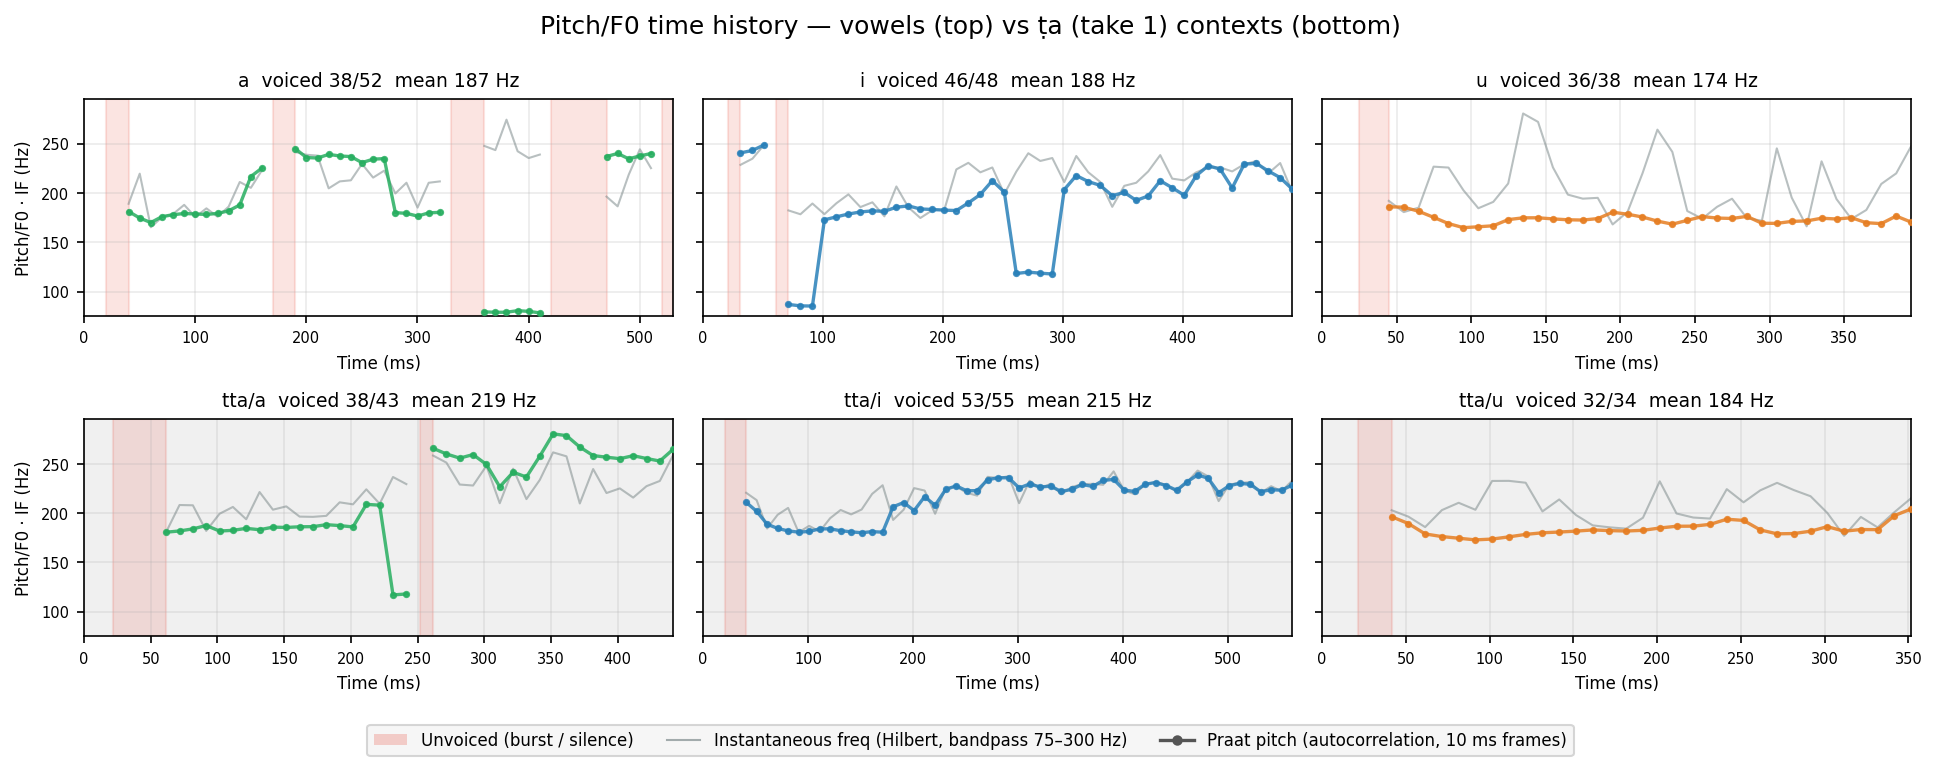
Human take 1
Colored dots = Praat pitch (autocorrelation, 10 ms frames). Gray line = instantaneous frequency (Hilbert transform on 75–300 Hz bandpass). Both show F0 region — IF is noisier; Praat smooths by choosing the most periodic candidate. Red shade = unvoiced (burst / silence).
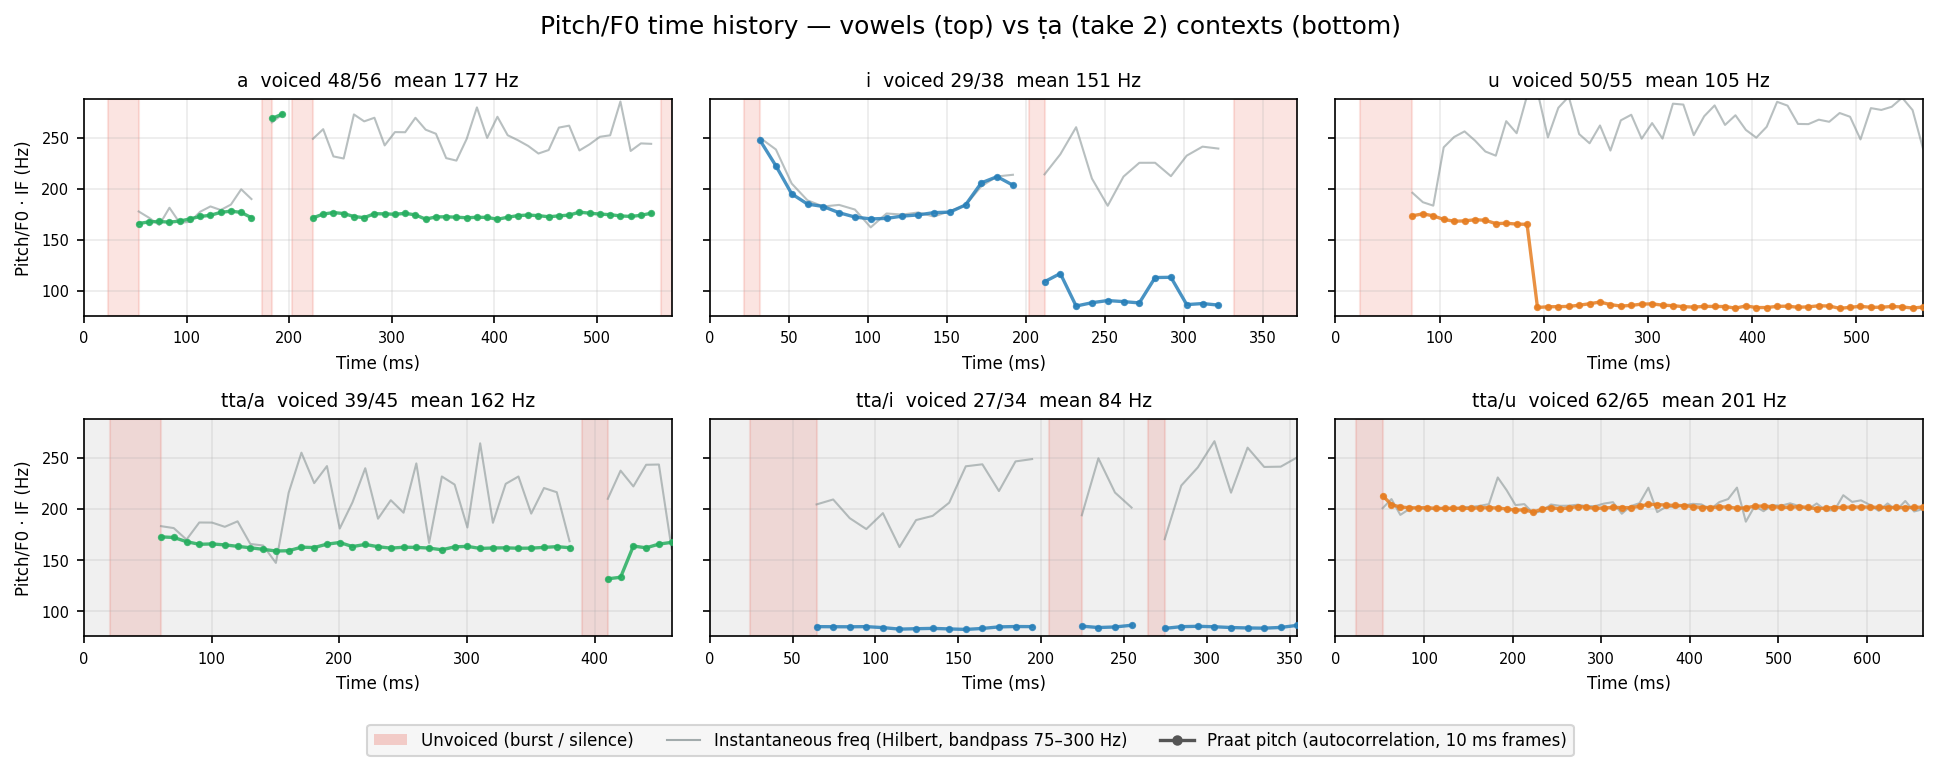
Human take 2
Colored dots = Praat pitch (autocorrelation, 10 ms frames). Gray line = instantaneous frequency (Hilbert transform on 75–300 Hz bandpass). Both show F0 region — IF is noisier; Praat smooths by choosing the most periodic candidate. Red shade = unvoiced (burst / silence).
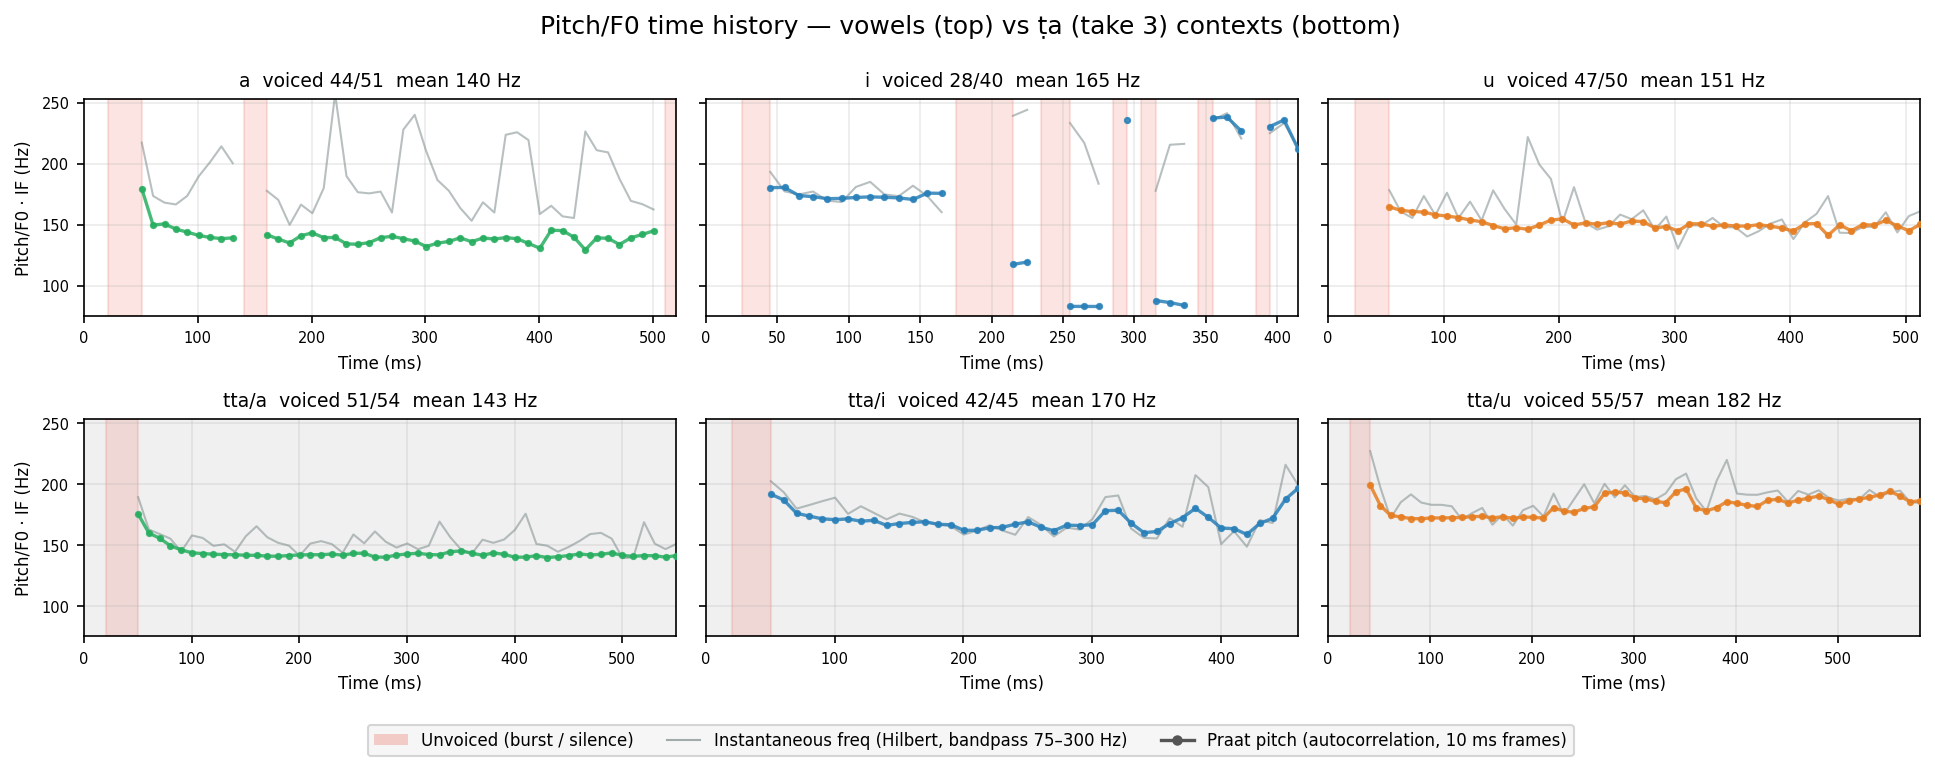
Human take 3
Colored dots = Praat pitch (autocorrelation, 10 ms frames). Gray line = instantaneous frequency (Hilbert transform on 75–300 Hz bandpass). Both show F0 region — IF is noisier; Praat smooths by choosing the most periodic candidate. Red shade = unvoiced (burst / silence).
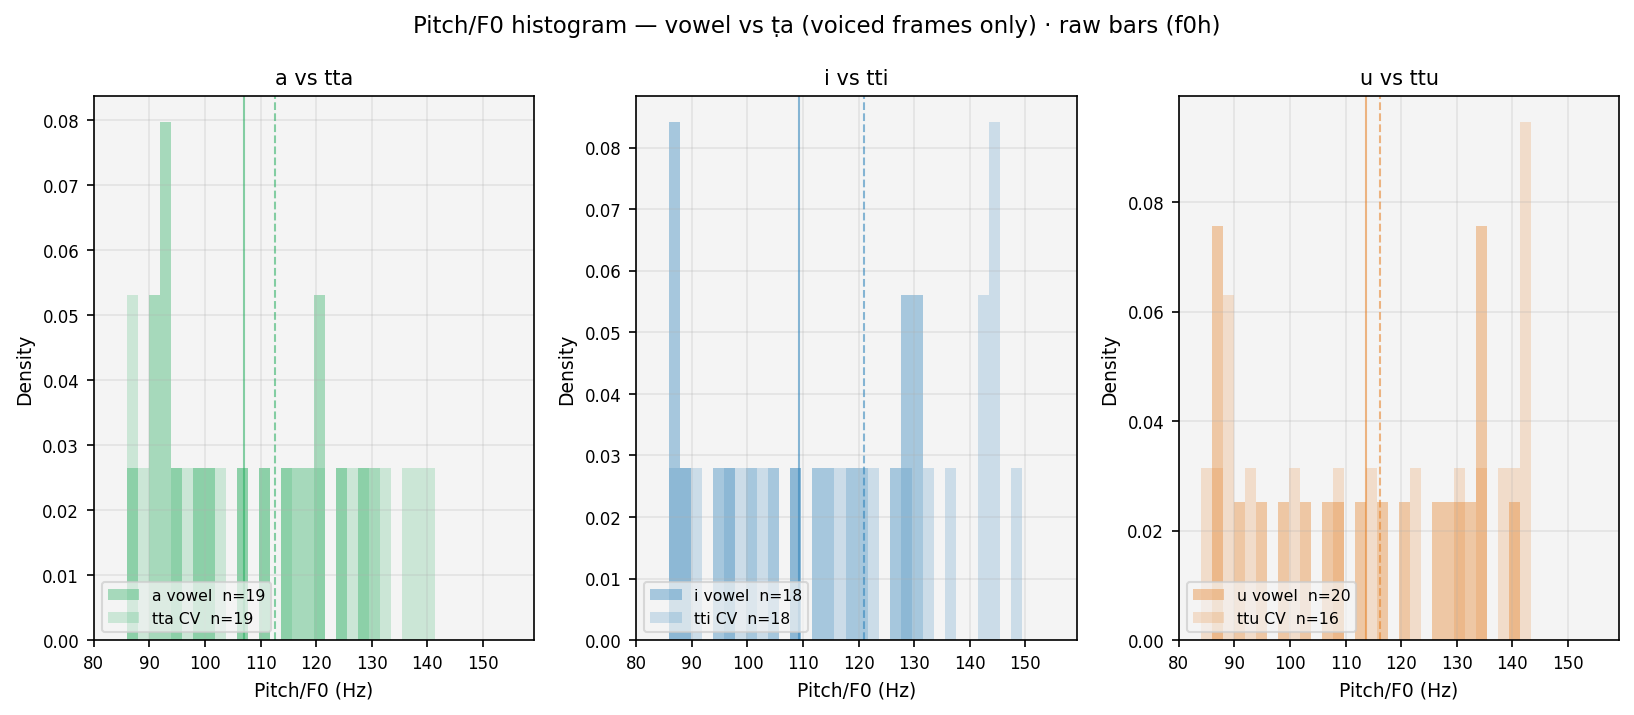
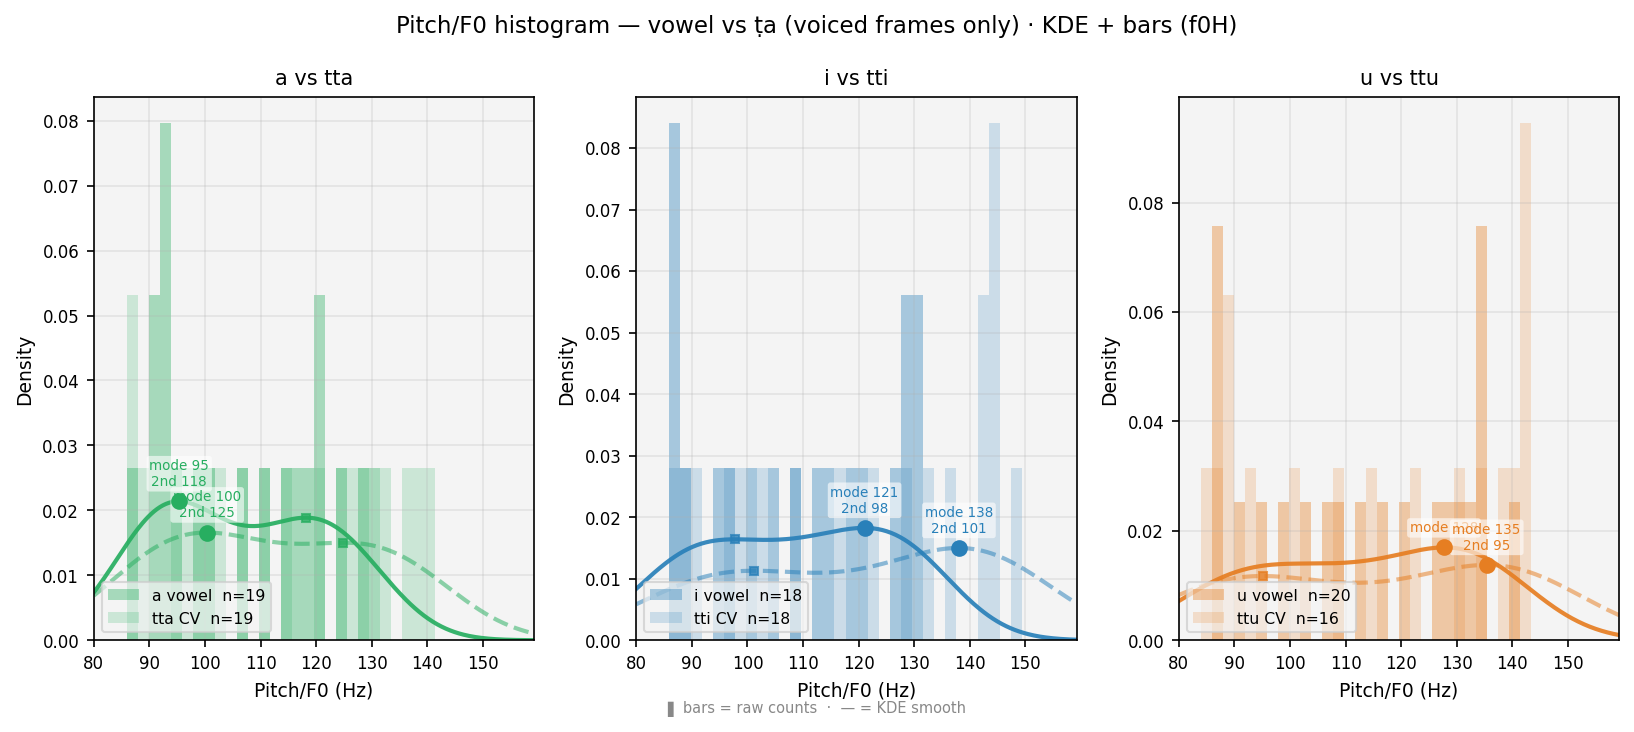
Smoothed histogram (each curve = bars drawn as a continuous line to avoid clutter from overlapping bars). Solid = vowel · Dashed = CV · voiced frames only. ● = primary peak (mode, most frequent pitch). ■ = secondary peak (onset elevation, smaller square). Thin verticals = means. Burst frames absent: voiceless stops produce no vocal-cord vibration — Praat returns NaN, so those frames never enter this plot.
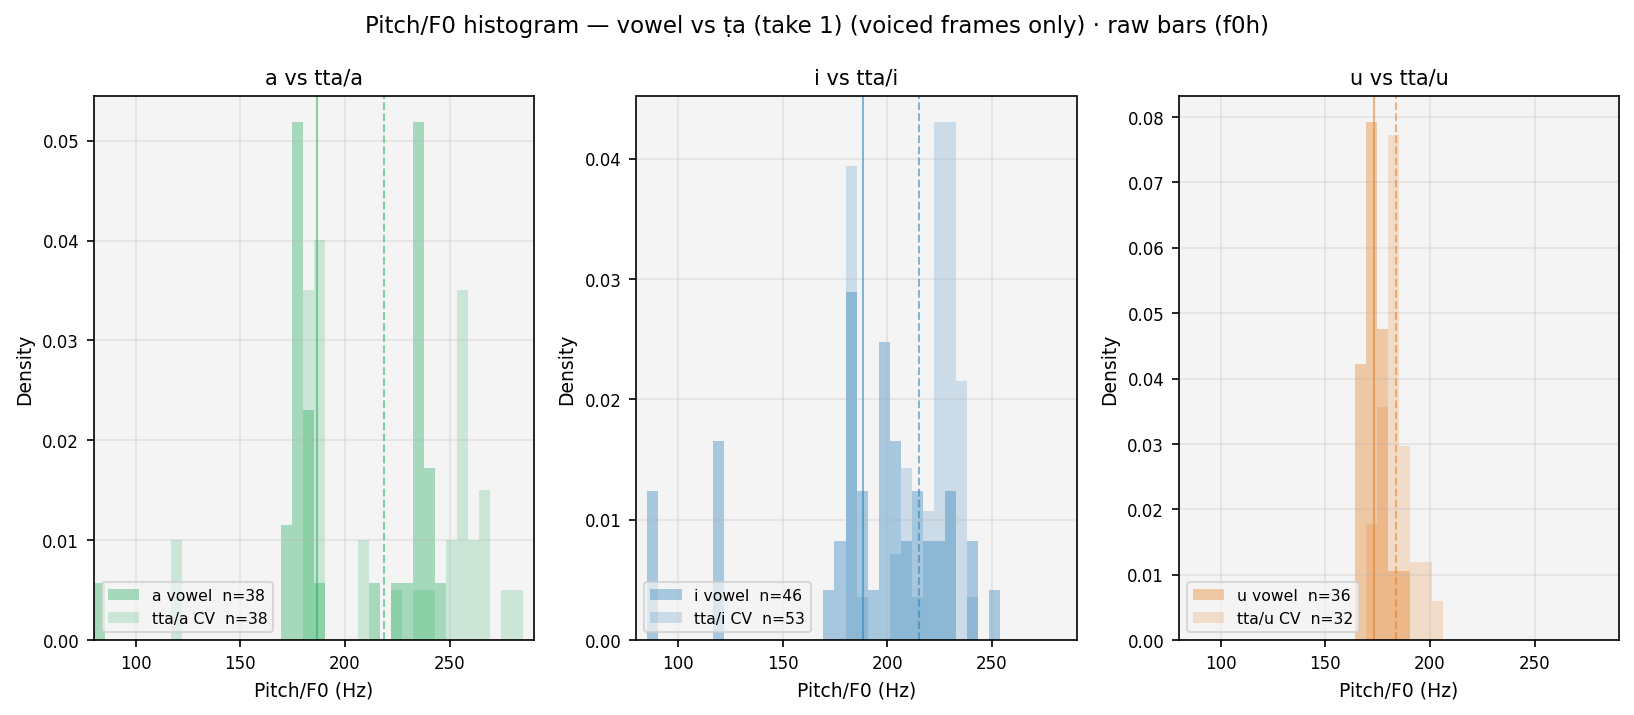
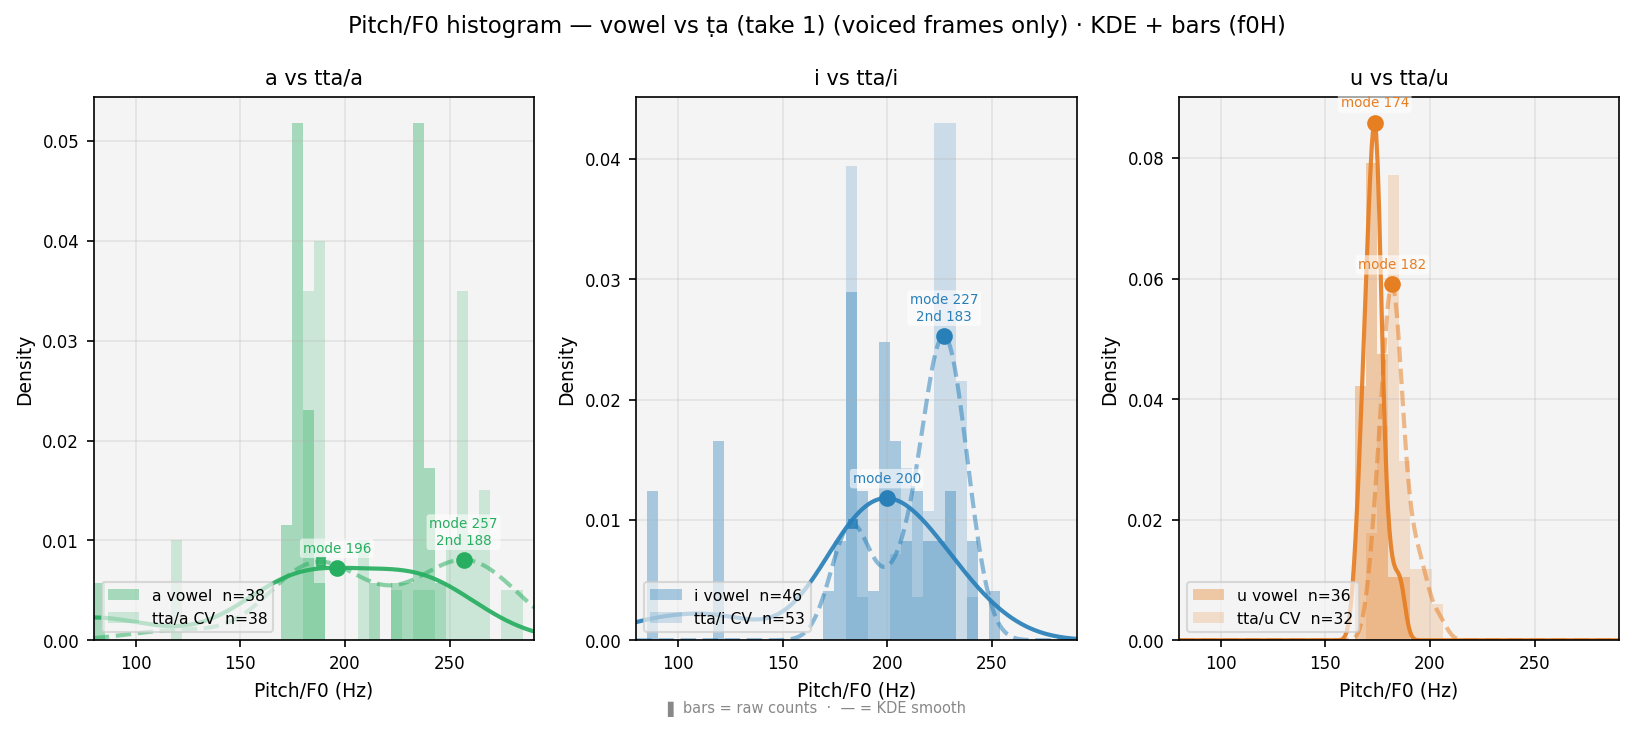
Smoothed histogram (each curve = bars drawn as a continuous line to avoid clutter from overlapping bars). Solid = vowel · Dashed = CV · voiced frames only. ● = primary peak (mode, most frequent pitch). ■ = secondary peak (onset elevation, smaller square). Thin verticals = means. Burst frames absent: voiceless stops produce no vocal-cord vibration — Praat returns NaN, so those frames never enter this plot.
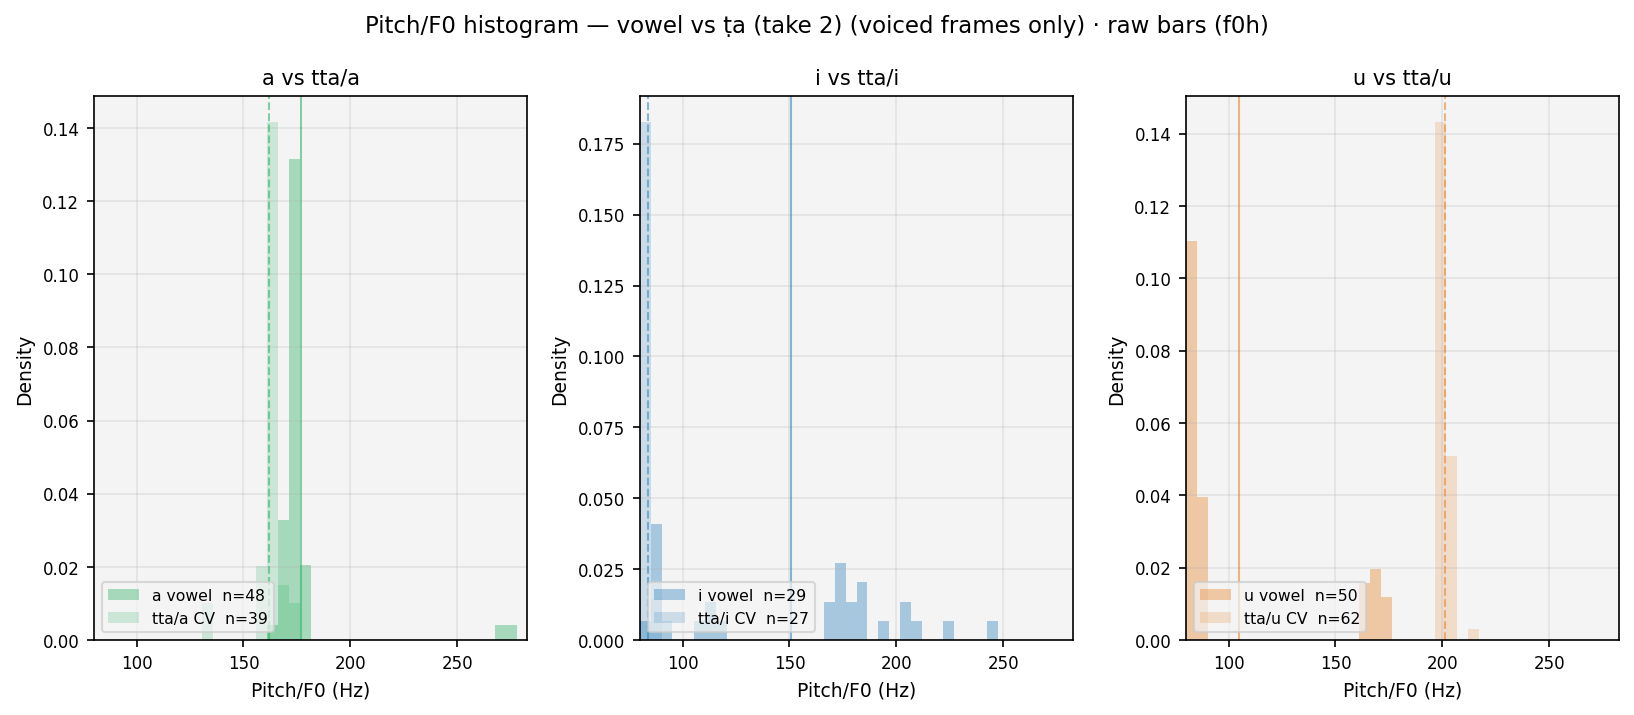
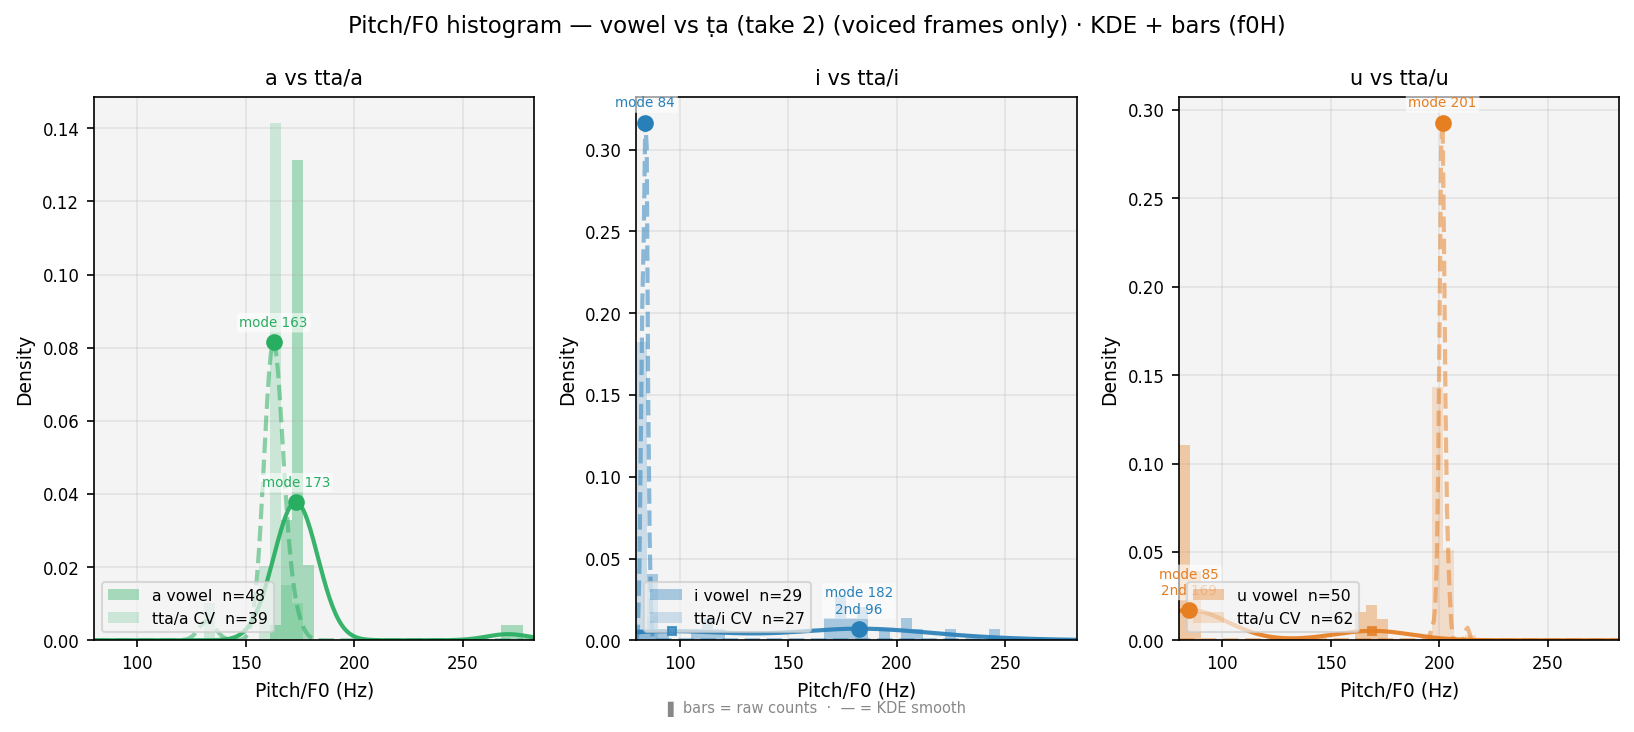
Smoothed histogram (each curve = bars drawn as a continuous line to avoid clutter from overlapping bars). Solid = vowel · Dashed = CV · voiced frames only. ● = primary peak (mode, most frequent pitch). ■ = secondary peak (onset elevation, smaller square). Thin verticals = means. Burst frames absent: voiceless stops produce no vocal-cord vibration — Praat returns NaN, so those frames never enter this plot.
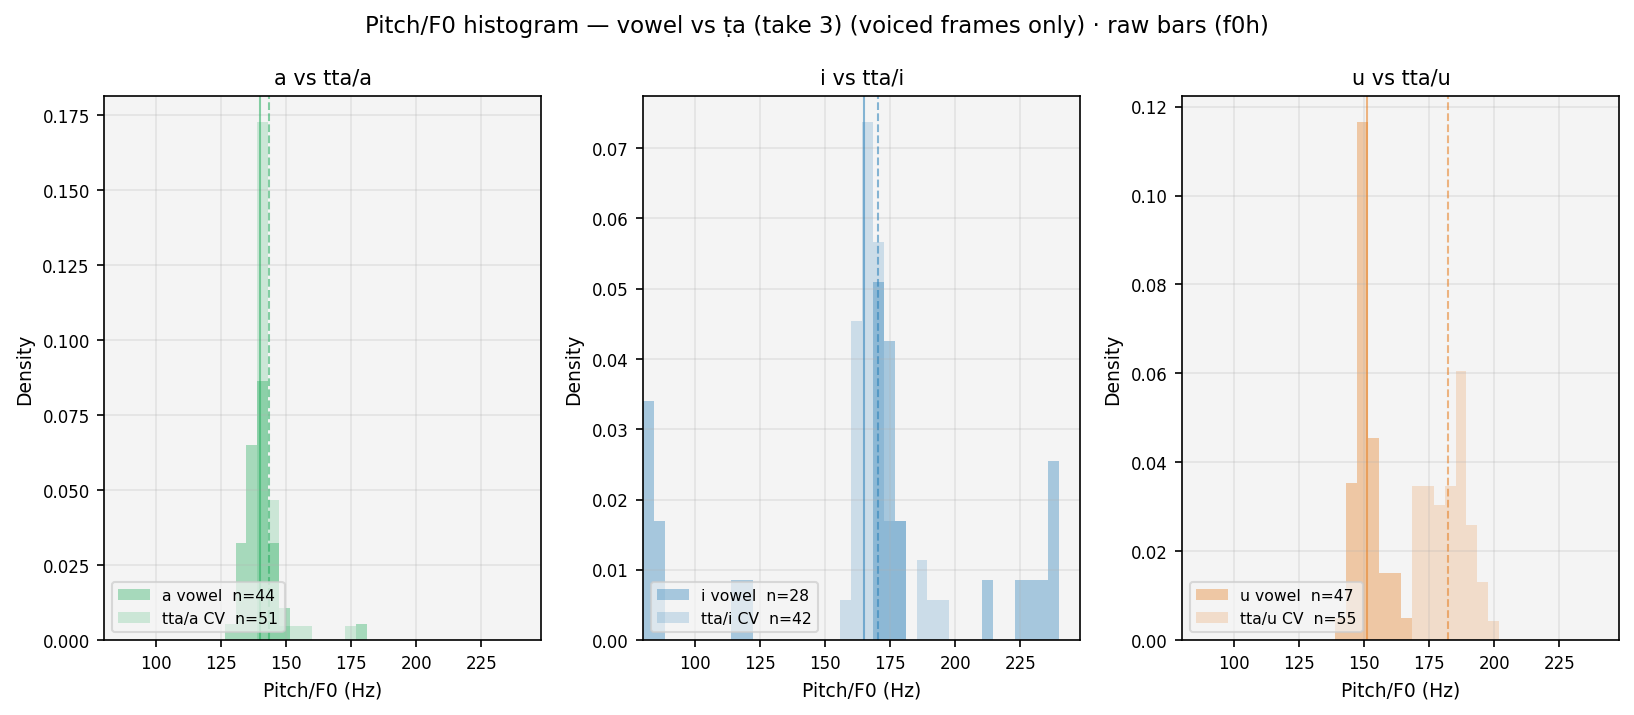
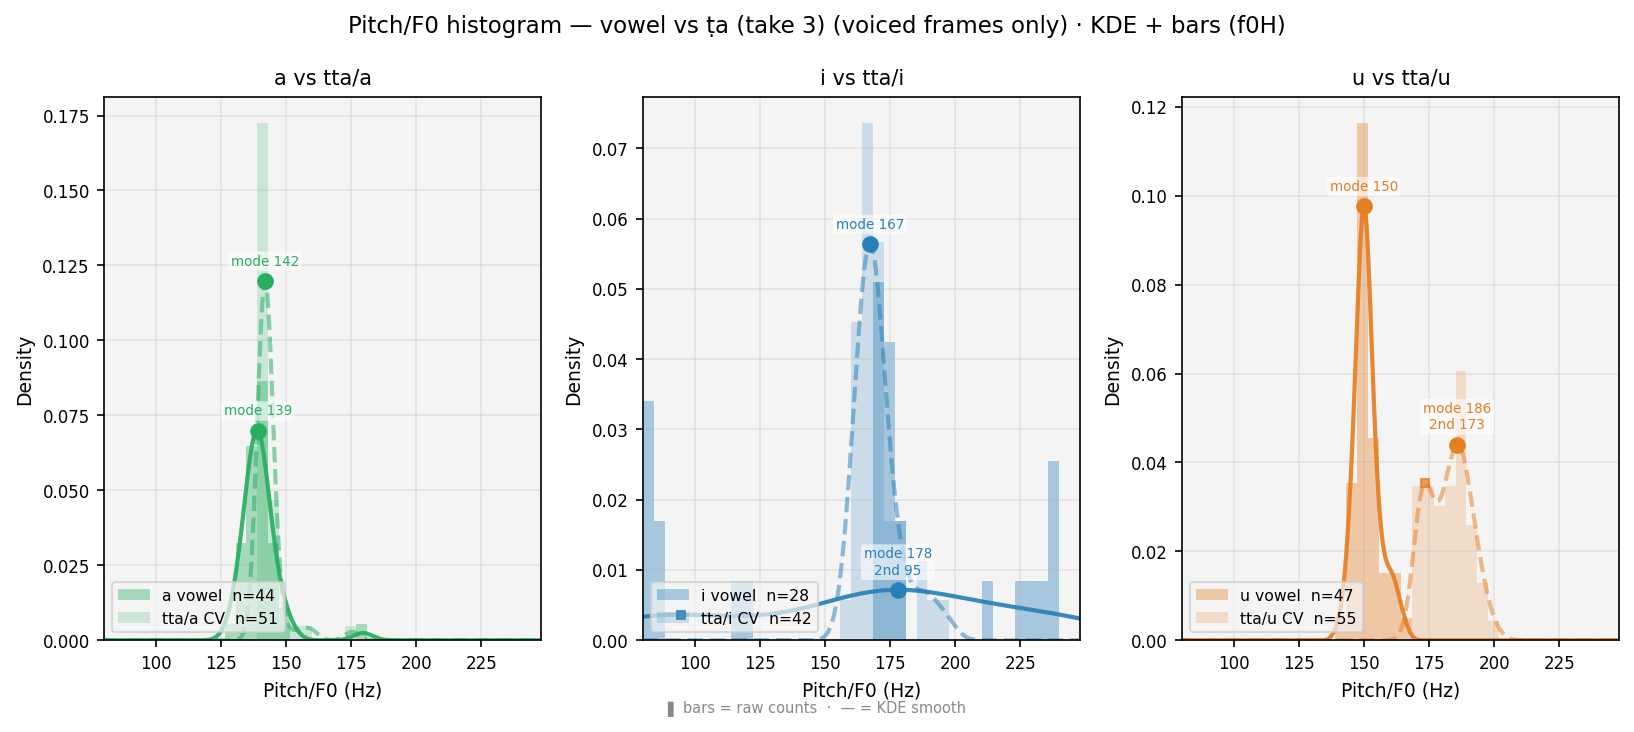
Smoothed histogram (each curve = bars drawn as a continuous line to avoid clutter from overlapping bars). Solid = vowel · Dashed = CV · voiced frames only. ● = primary peak (mode, most frequent pitch). ■ = secondary peak (onset elevation, smaller square). Thin verticals = means. Burst frames absent: voiceless stops produce no vocal-cord vibration — Praat returns NaN, so those frames never enter this plot.
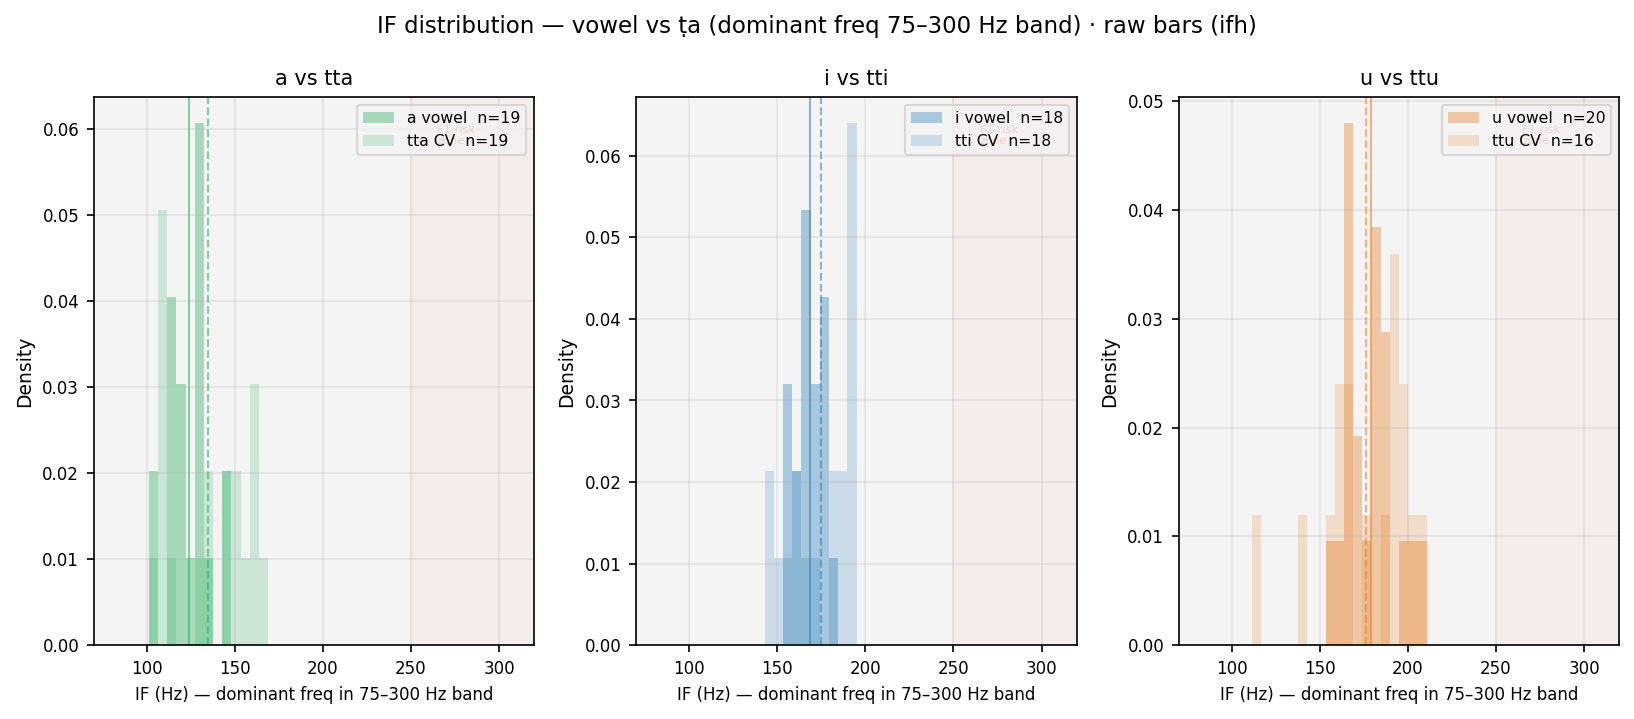
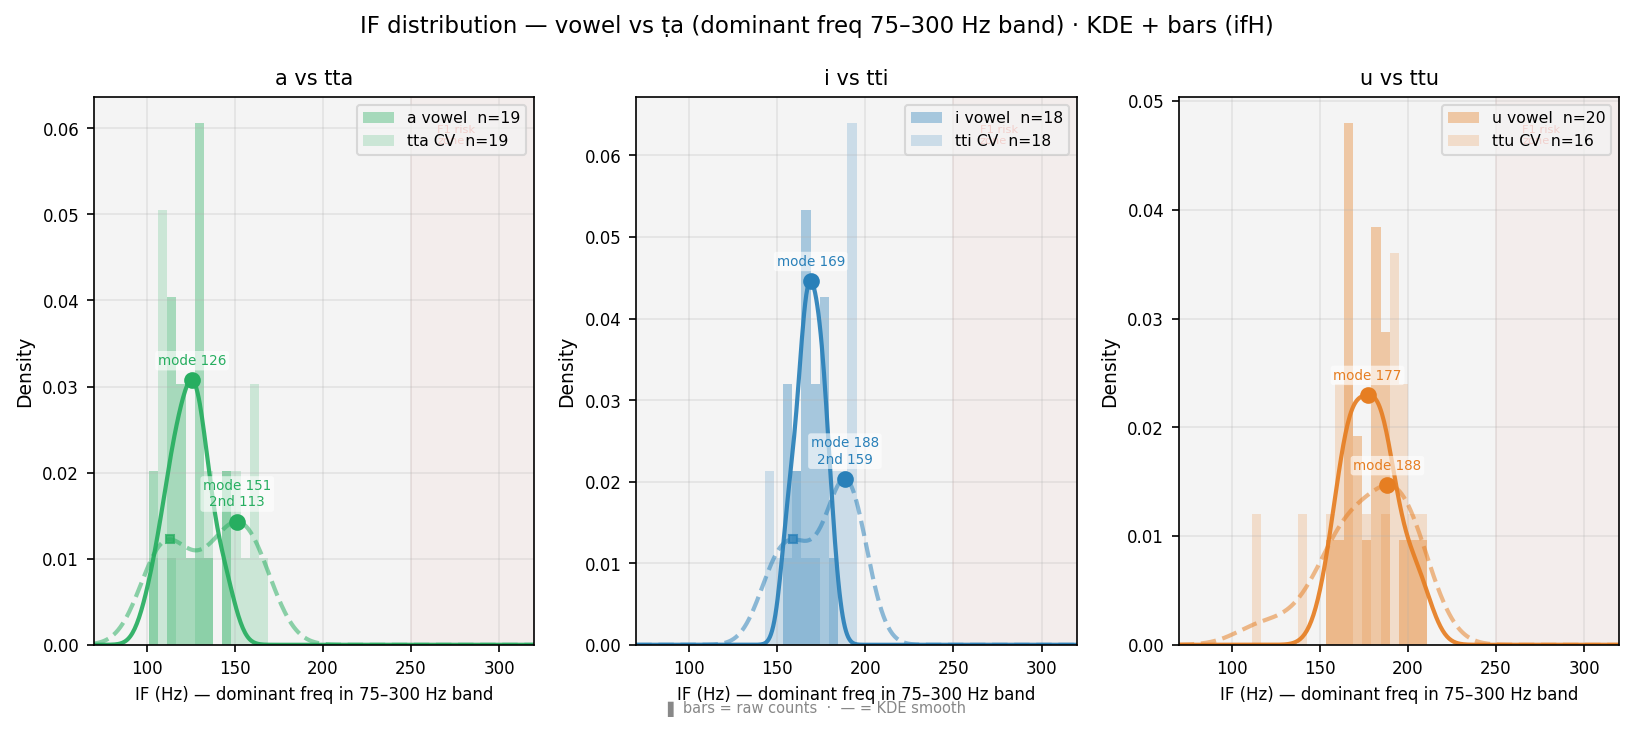
Distribution of instantaneous frequency (Hilbert transform, bandpass 75–300 Hz) at Praat frame rate. For /a/ (F1~800 Hz, outside band): IF tracks F0 — histogram aligns with Praat pitch histogram. For /i/ /u/ (F1~280–300 Hz, inside band): IF may track F1 — red-shaded zone marks this risk. Comparison of vowel vs CV curves shows coarticulation effect on dominant bandpass frequency. ● primary peak · ■ secondary peak.
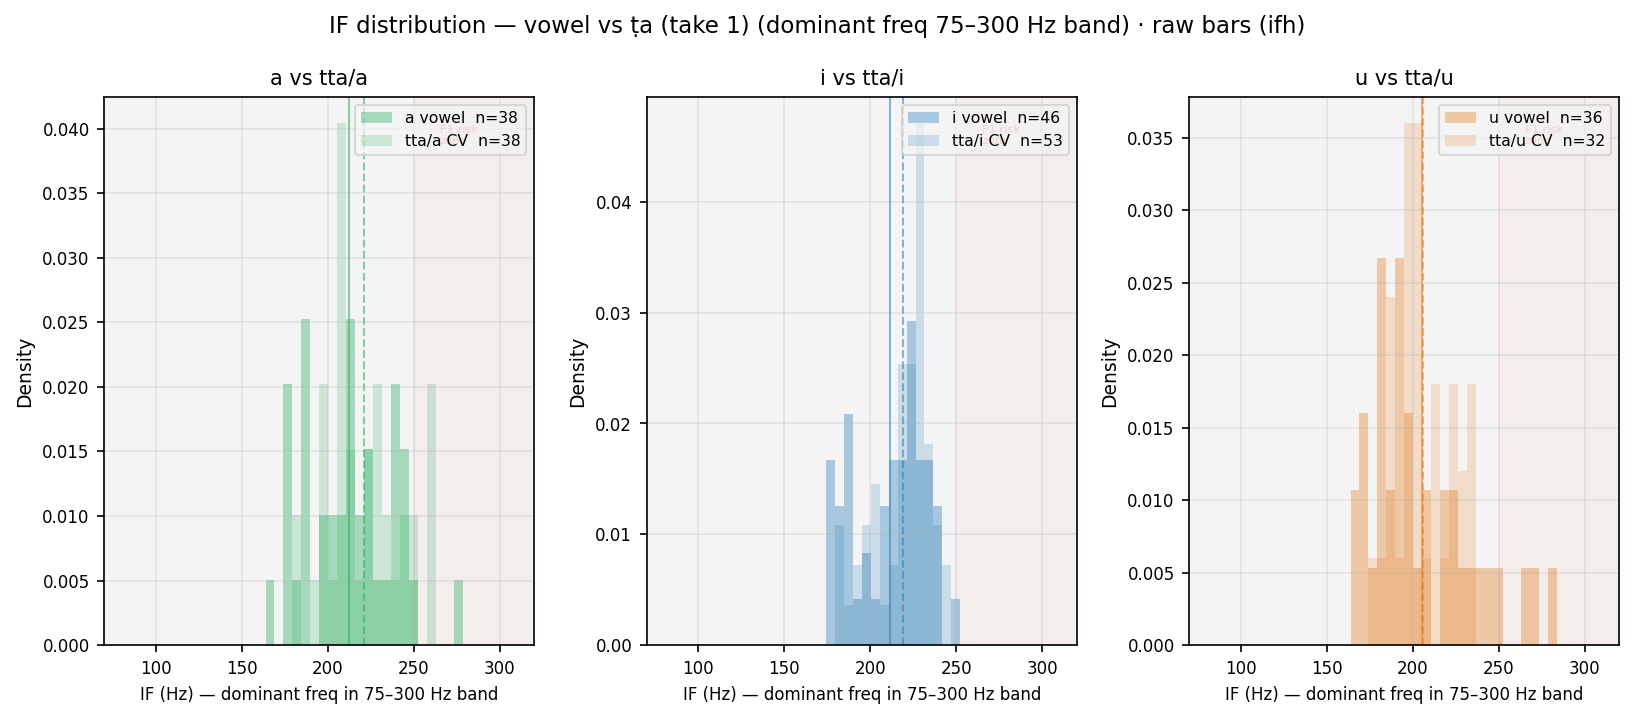
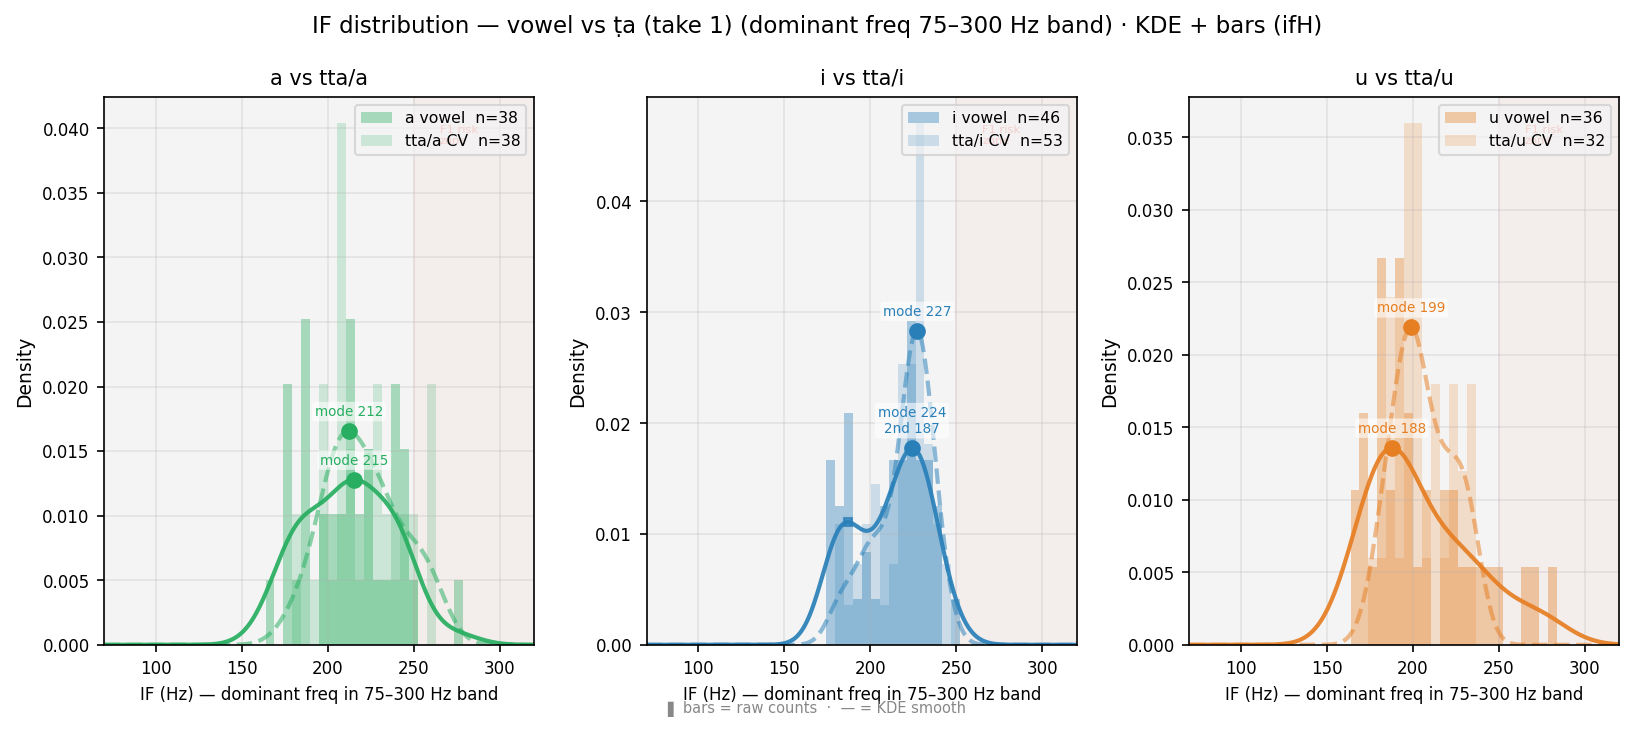
Distribution of instantaneous frequency (Hilbert transform, bandpass 75–300 Hz) at Praat frame rate. For /a/ (F1~800 Hz, outside band): IF tracks F0 — histogram aligns with Praat pitch histogram. For /i/ /u/ (F1~280–300 Hz, inside band): IF may track F1 — red-shaded zone marks this risk. Comparison of vowel vs CV curves shows coarticulation effect on dominant bandpass frequency. ● primary peak · ■ secondary peak.
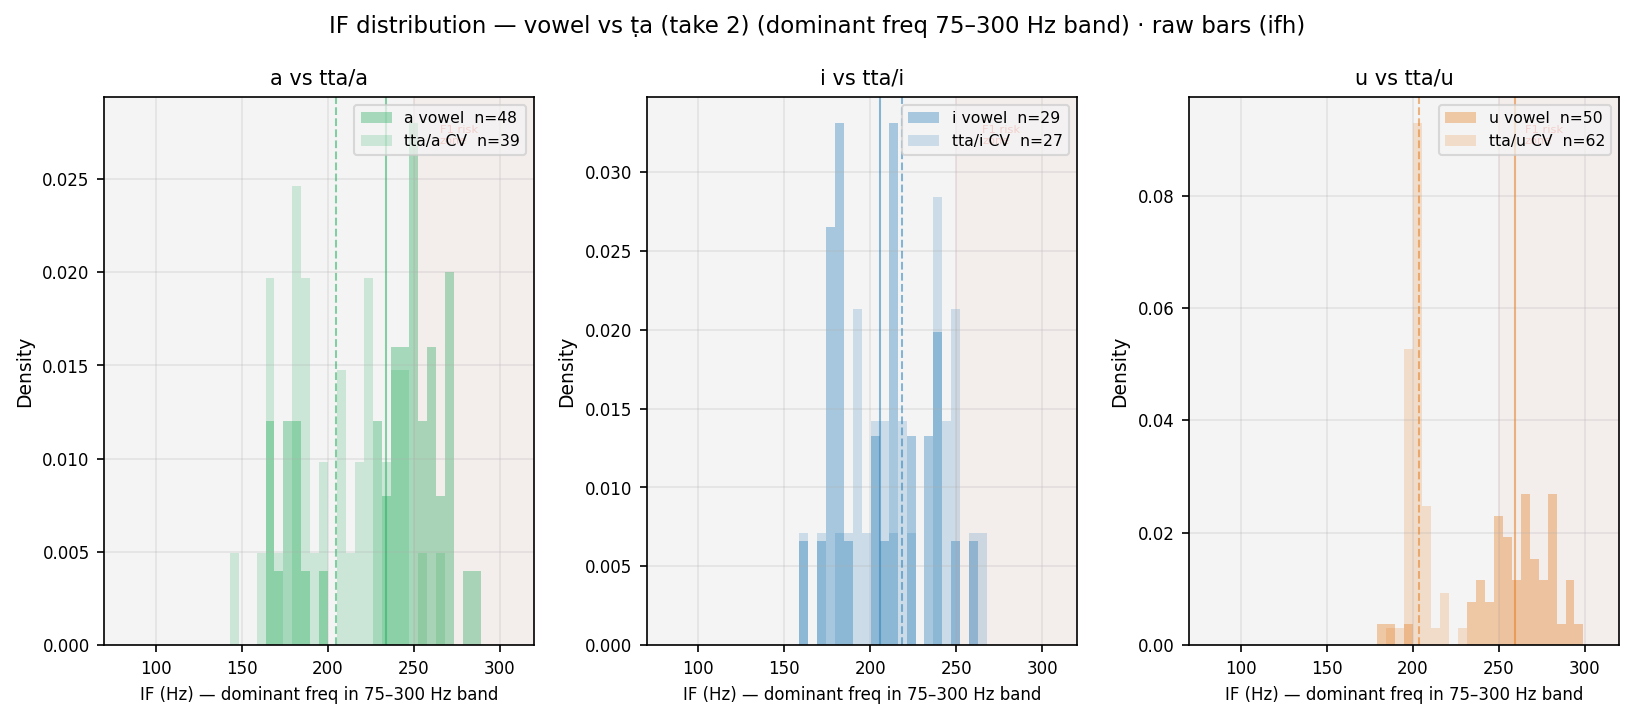
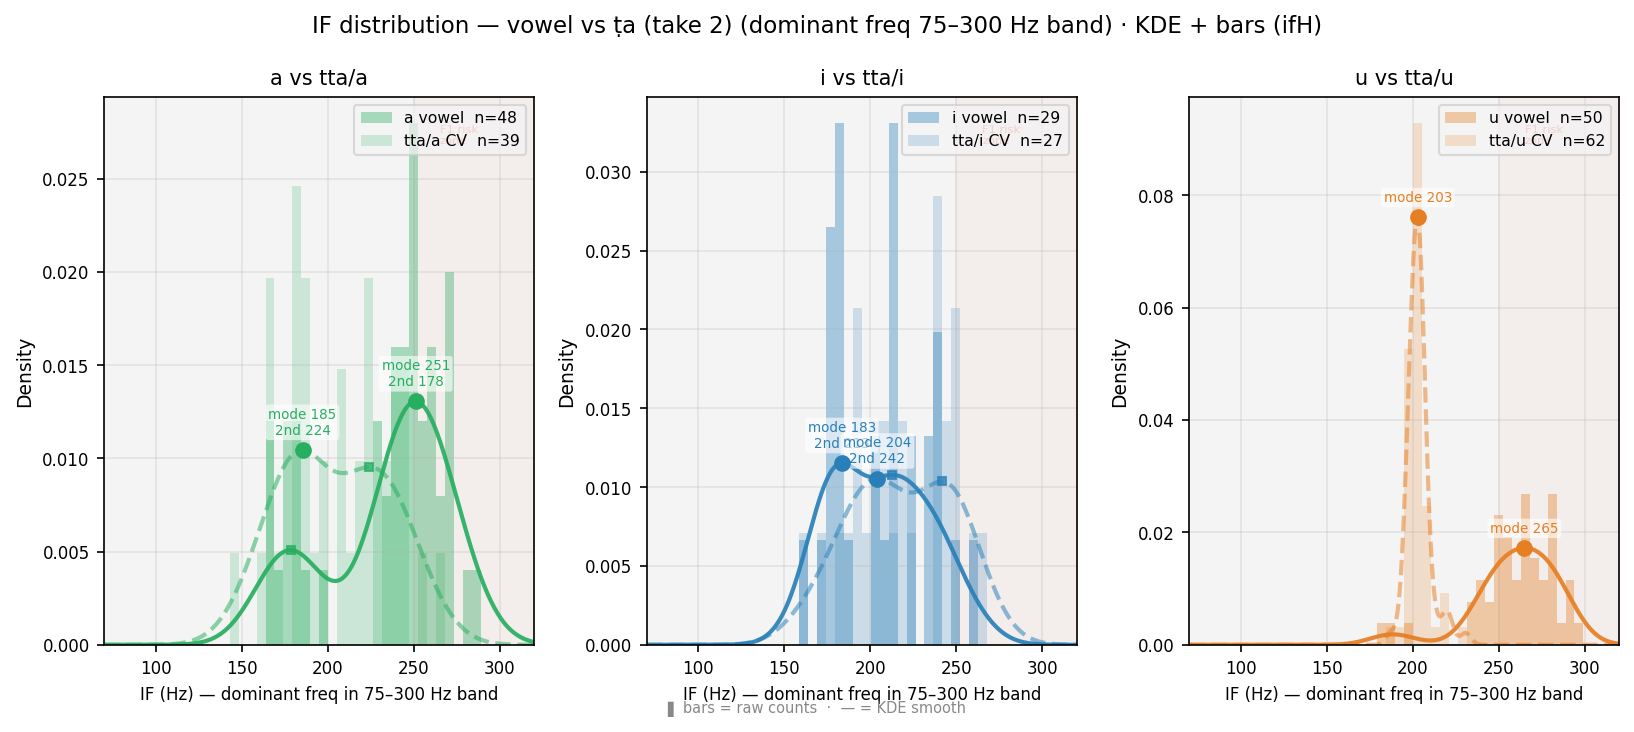
Distribution of instantaneous frequency (Hilbert transform, bandpass 75–300 Hz) at Praat frame rate. For /a/ (F1~800 Hz, outside band): IF tracks F0 — histogram aligns with Praat pitch histogram. For /i/ /u/ (F1~280–300 Hz, inside band): IF may track F1 — red-shaded zone marks this risk. Comparison of vowel vs CV curves shows coarticulation effect on dominant bandpass frequency. ● primary peak · ■ secondary peak.
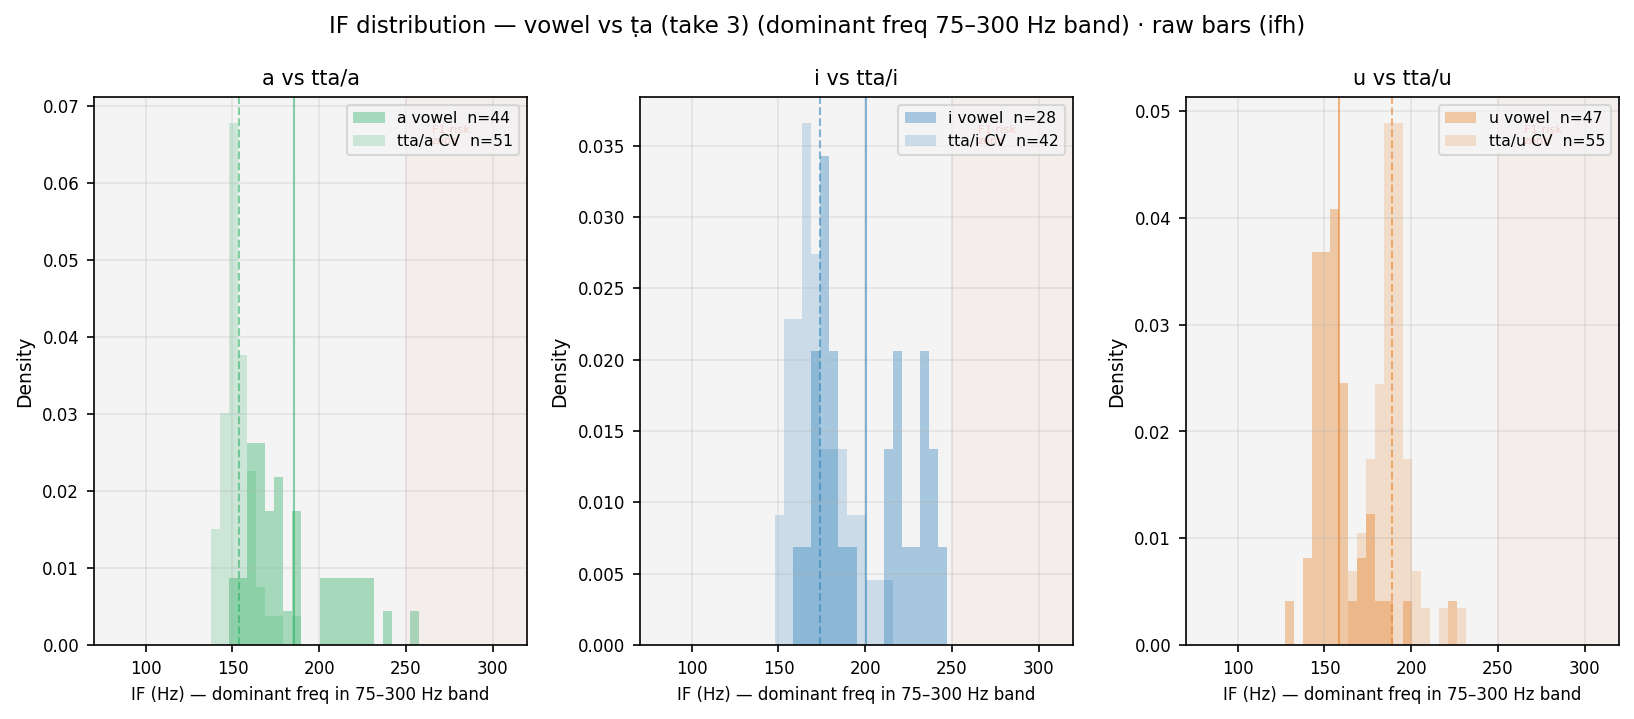
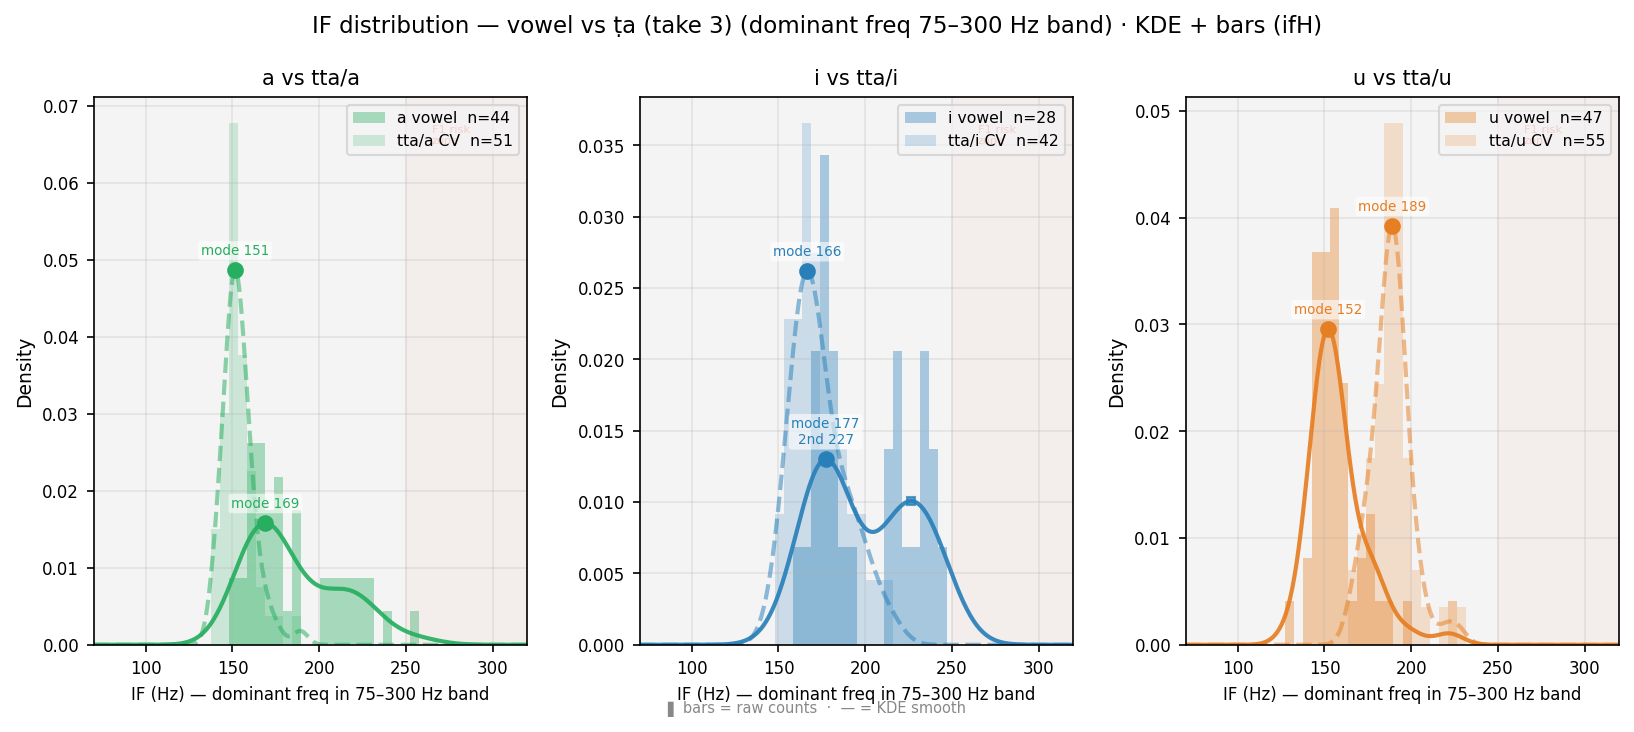
Distribution of instantaneous frequency (Hilbert transform, bandpass 75–300 Hz) at Praat frame rate. For /a/ (F1~800 Hz, outside band): IF tracks F0 — histogram aligns with Praat pitch histogram. For /i/ /u/ (F1~280–300 Hz, inside band): IF may track F1 — red-shaded zone marks this risk. Comparison of vowel vs CV curves shows coarticulation effect on dominant bandpass frequency. ● primary peak · ■ secondary peak.
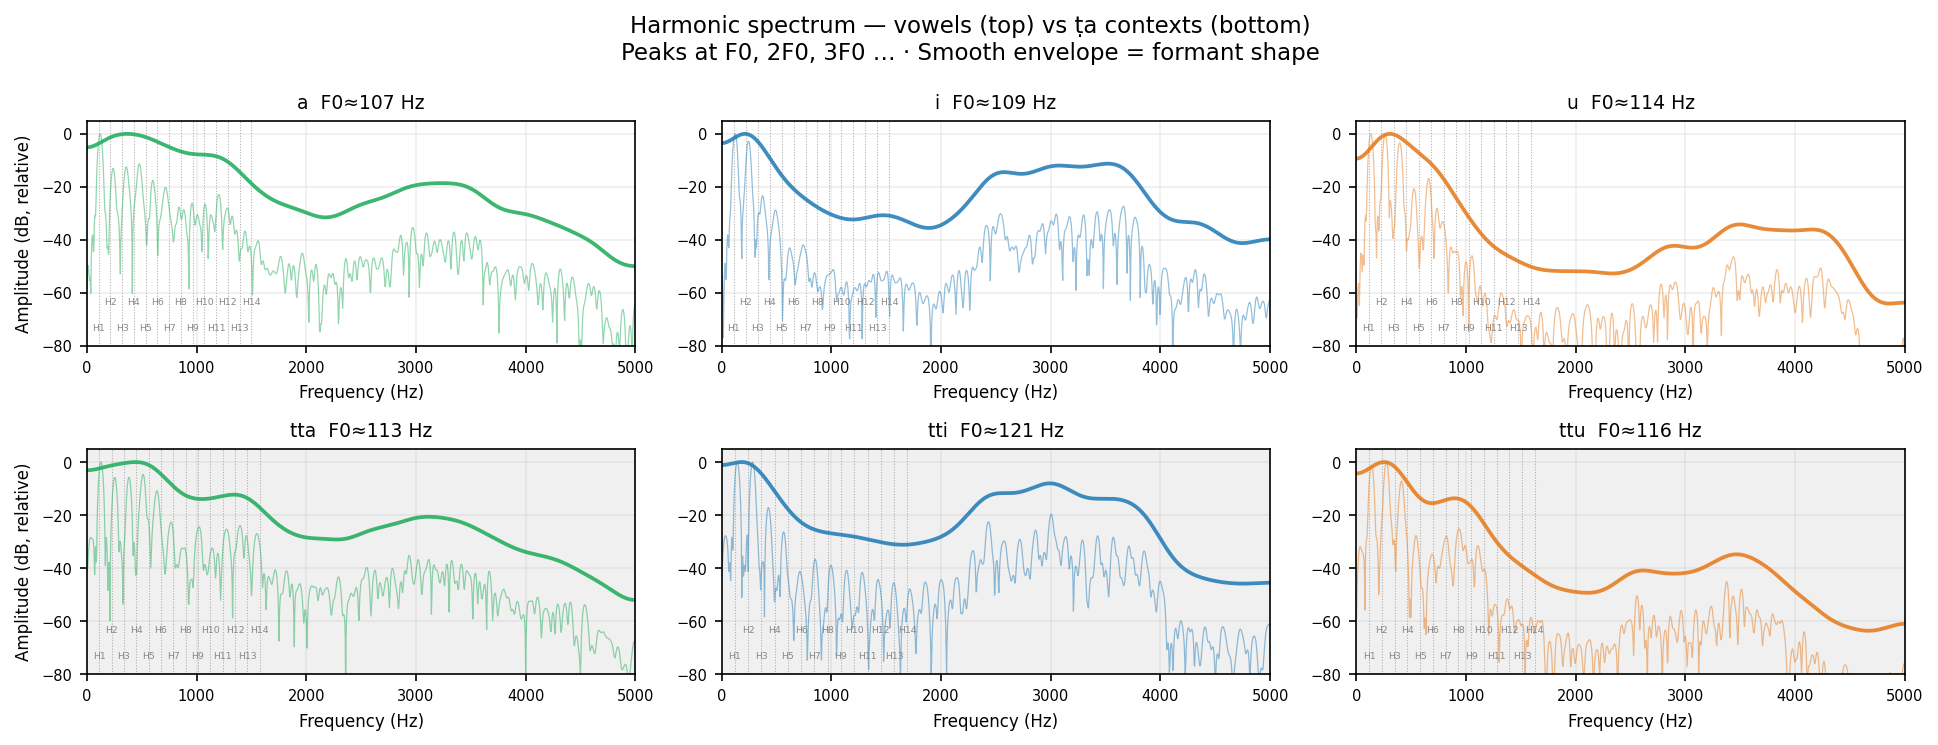
Plain reading: A vowel is a mixture of tones all sounding together. The lowest tone is the fundamental (H1 ≈ F0, ~100 Hz for this voice). The voice also produces tones at exactly 2×, 3×, 4× that frequency — these are harmonics (H2, H3, …). The shape of the mouth amplifies some harmonics more than others; those amplified regions appear as bumps in the smooth envelope — those are the formants (F1 F2 F3). Changing the vowel (अ → इ → उ) reshapes the mouth and shifts the envelope bumps while keeping the comb spacing (F0) the same. Technical: FFT of 50 ms steady-state (20–70 ms after voicing onset). Thin line = raw spectrum · bold line = Gaussian-smoothed spectral envelope (~150 Hz width). Dotted verticals = expected harmonics at n×F0. Y-axis normalised to 0 dB at peak.
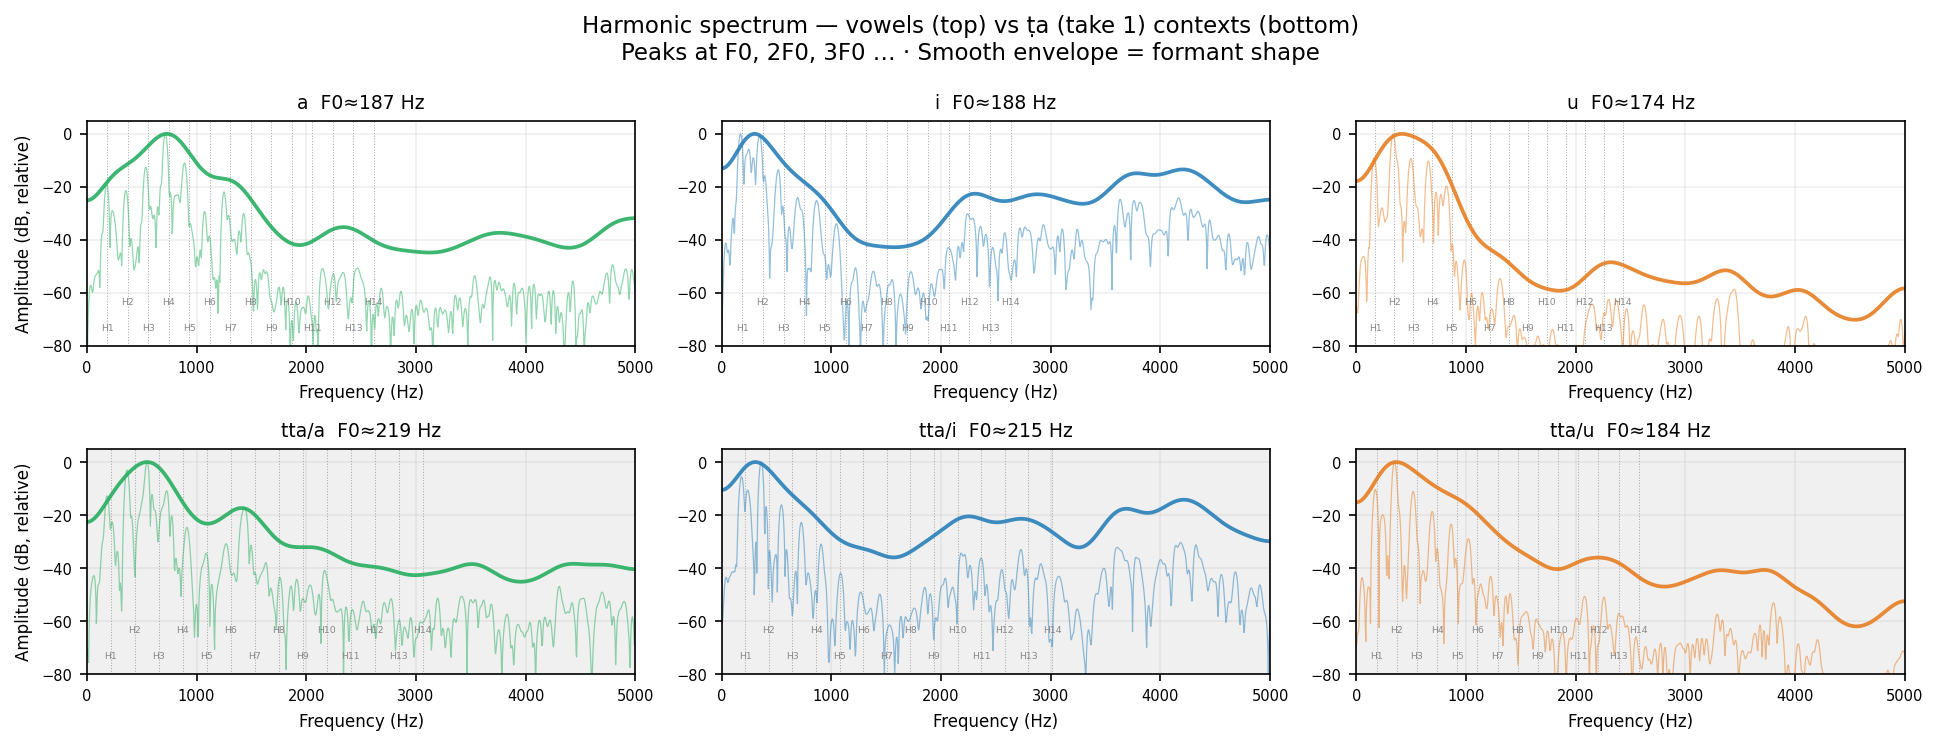
Human take 1
Plain reading: A vowel is a mixture of tones all sounding together. The lowest tone is the fundamental (H1 ≈ F0, ~100 Hz for this voice). The voice also produces tones at exactly 2×, 3×, 4× that frequency — these are harmonics (H2, H3, …). The shape of the mouth amplifies some harmonics more than others; those amplified regions appear as bumps in the smooth envelope — those are the formants (F1 F2 F3). Changing the vowel (अ → इ → उ) reshapes the mouth and shifts the envelope bumps while keeping the comb spacing (F0) the same. Technical: FFT of 50 ms steady-state (20–70 ms after voicing onset). Thin line = raw spectrum · bold line = Gaussian-smoothed spectral envelope (~150 Hz width). Dotted verticals = expected harmonics at n×F0. Y-axis normalised to 0 dB at peak.
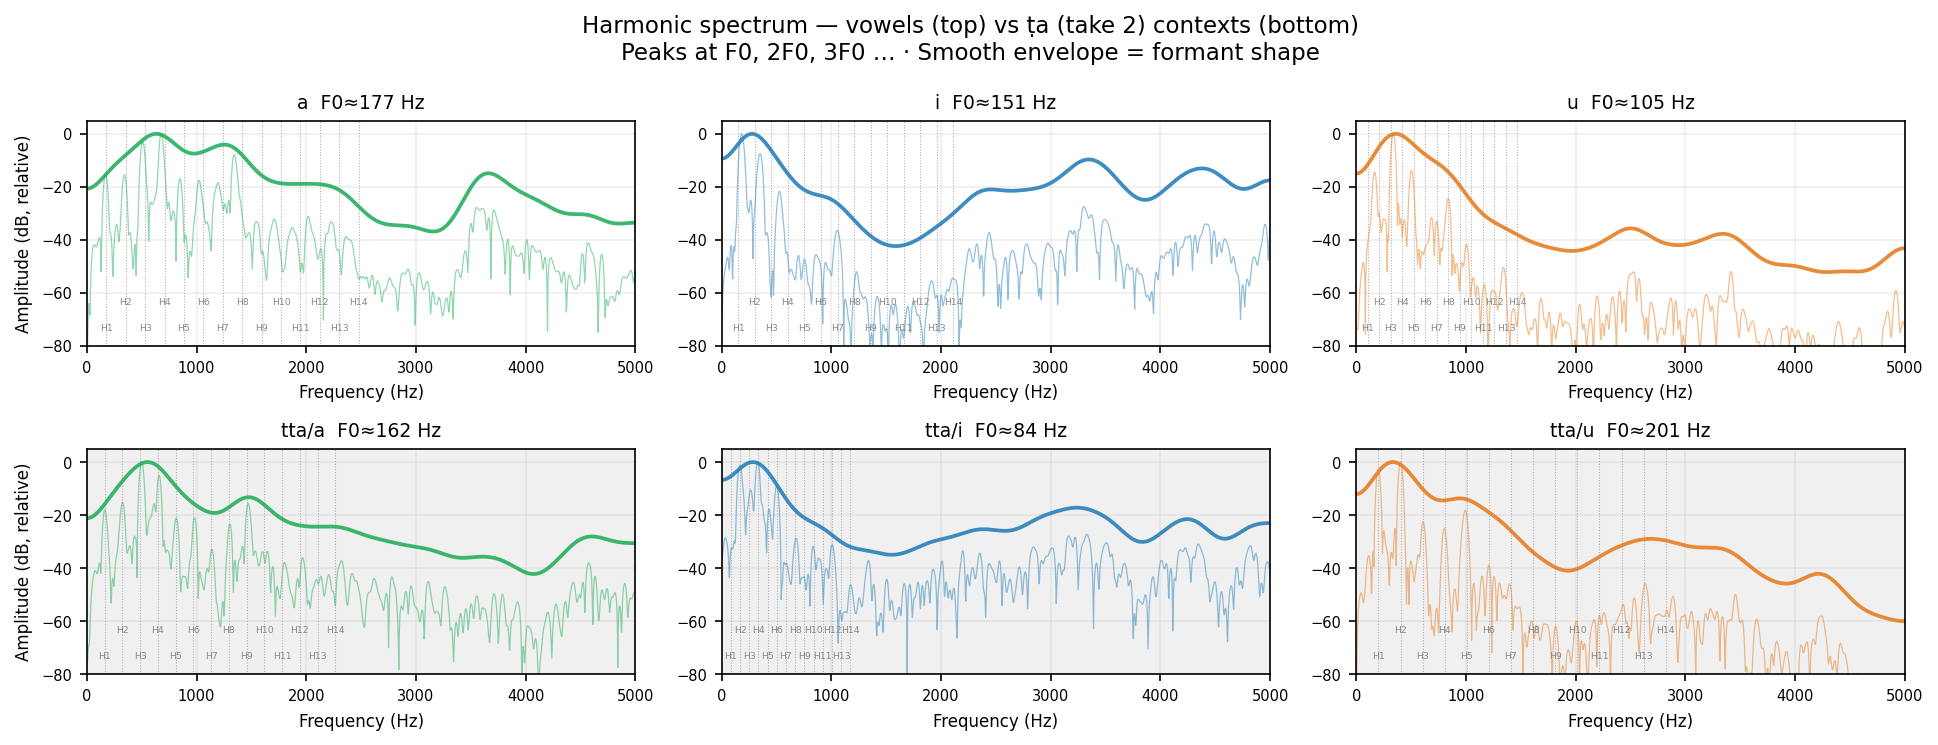
Human take 2
Plain reading: A vowel is a mixture of tones all sounding together. The lowest tone is the fundamental (H1 ≈ F0, ~100 Hz for this voice). The voice also produces tones at exactly 2×, 3×, 4× that frequency — these are harmonics (H2, H3, …). The shape of the mouth amplifies some harmonics more than others; those amplified regions appear as bumps in the smooth envelope — those are the formants (F1 F2 F3). Changing the vowel (अ → इ → उ) reshapes the mouth and shifts the envelope bumps while keeping the comb spacing (F0) the same. Technical: FFT of 50 ms steady-state (20–70 ms after voicing onset). Thin line = raw spectrum · bold line = Gaussian-smoothed spectral envelope (~150 Hz width). Dotted verticals = expected harmonics at n×F0. Y-axis normalised to 0 dB at peak.
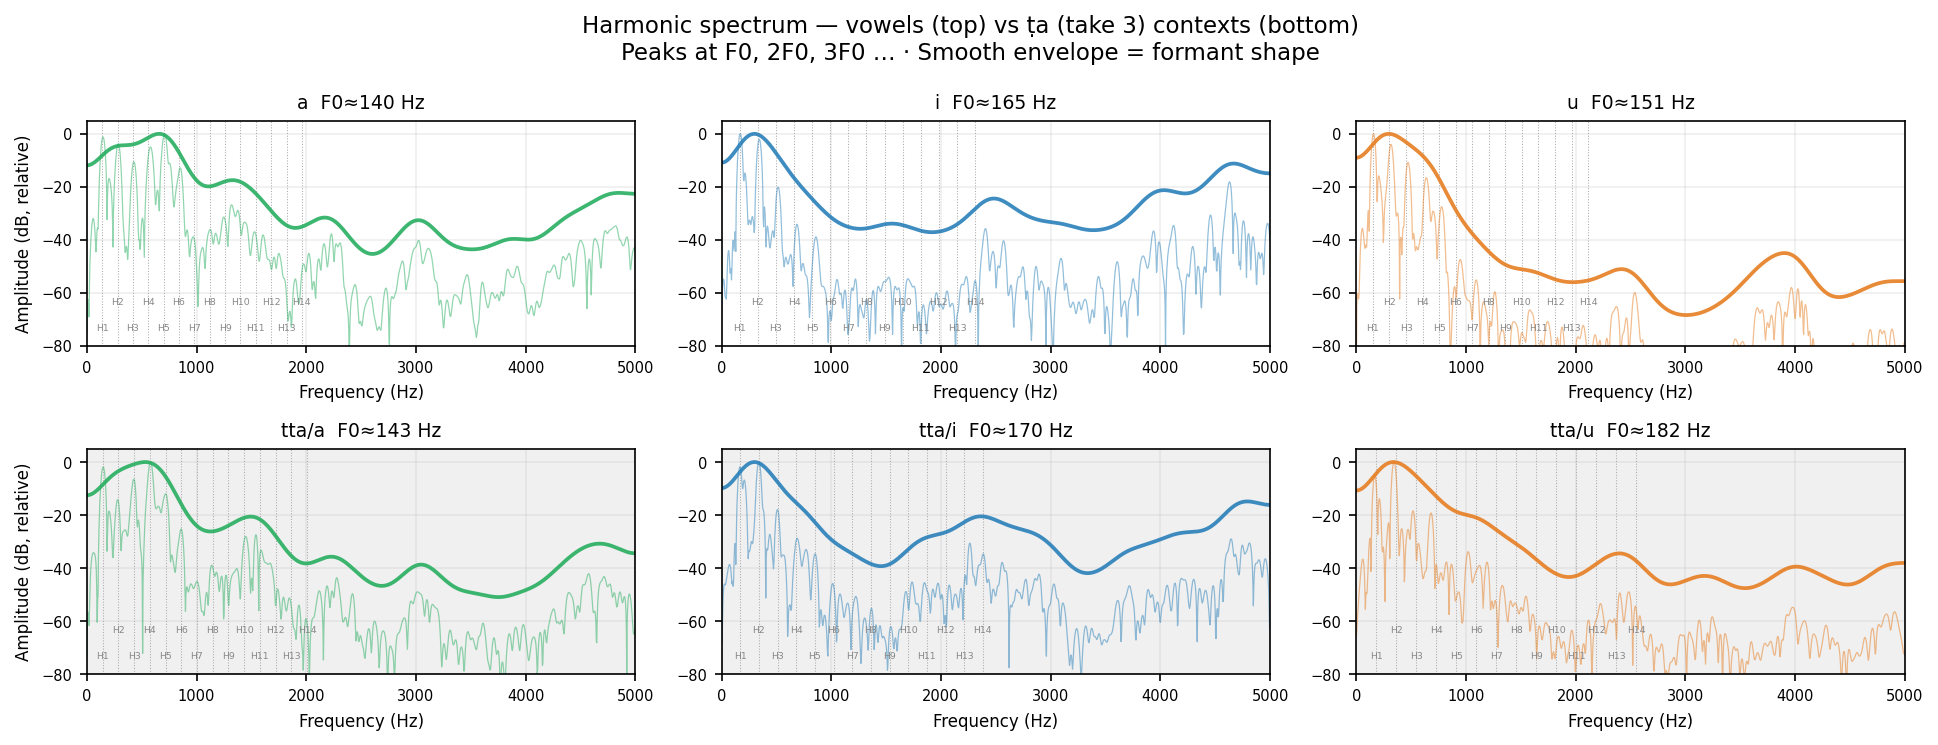
Human take 3
Plain reading: A vowel is a mixture of tones all sounding together. The lowest tone is the fundamental (H1 ≈ F0, ~100 Hz for this voice). The voice also produces tones at exactly 2×, 3×, 4× that frequency — these are harmonics (H2, H3, …). The shape of the mouth amplifies some harmonics more than others; those amplified regions appear as bumps in the smooth envelope — those are the formants (F1 F2 F3). Changing the vowel (अ → इ → उ) reshapes the mouth and shifts the envelope bumps while keeping the comb spacing (F0) the same. Technical: FFT of 50 ms steady-state (20–70 ms after voicing onset). Thin line = raw spectrum · bold line = Gaussian-smoothed spectral envelope (~150 Hz width). Dotted verticals = expected harmonics at n×F0. Y-axis normalised to 0 dB at peak.
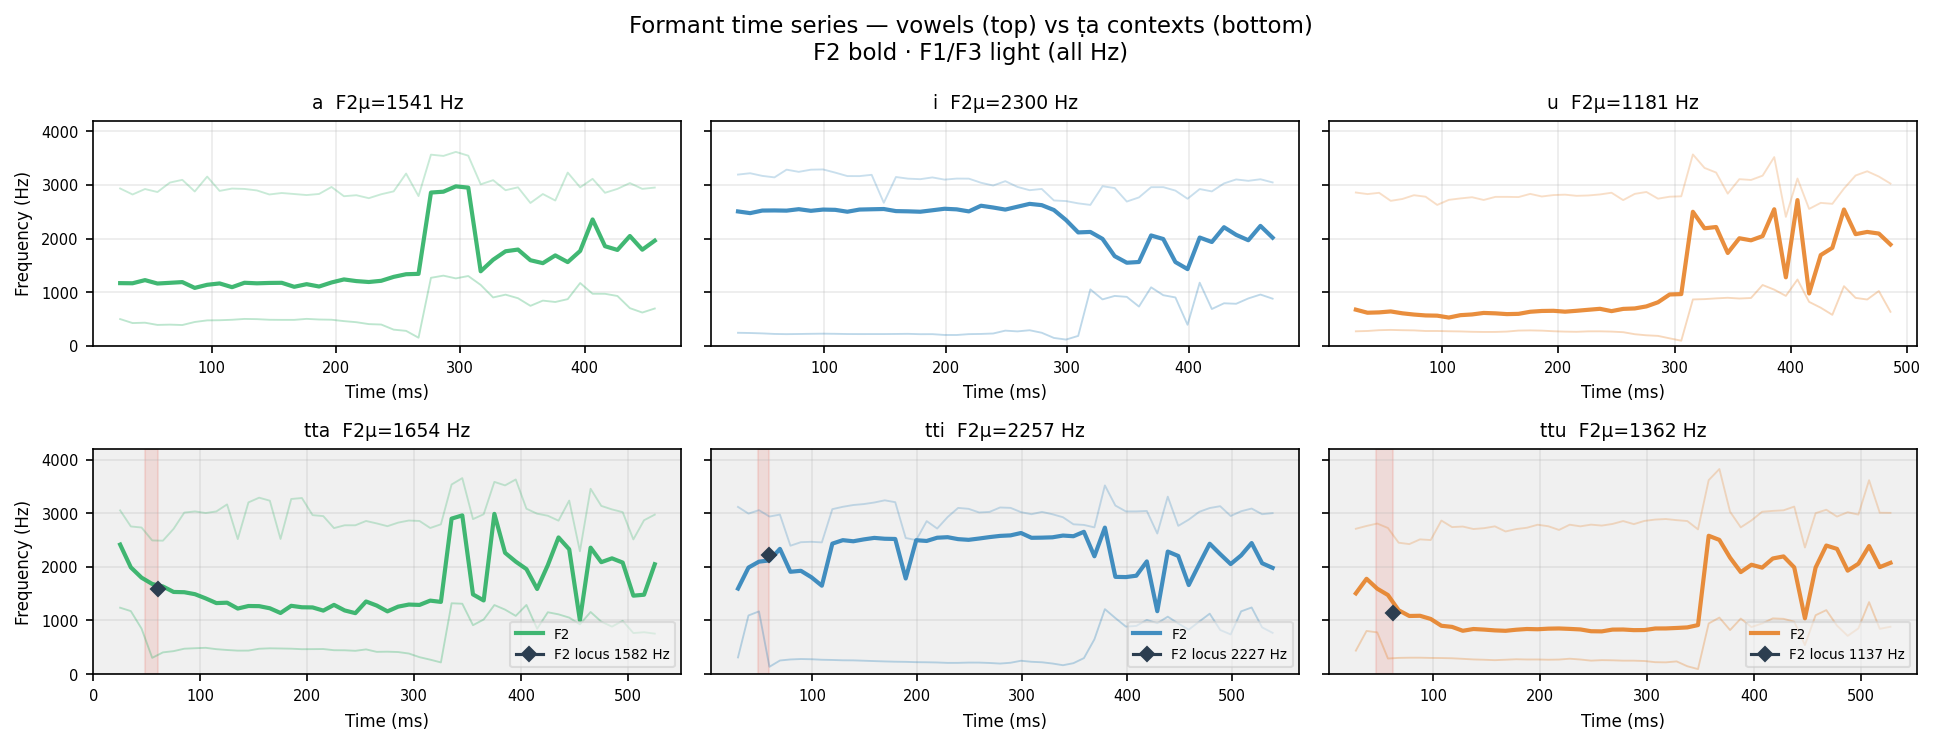
F2 bold · F1/F3 light (alpha). ◆ = F2 locus (F2 at voicing onset = place of articulation marker). Red shade = burst window.
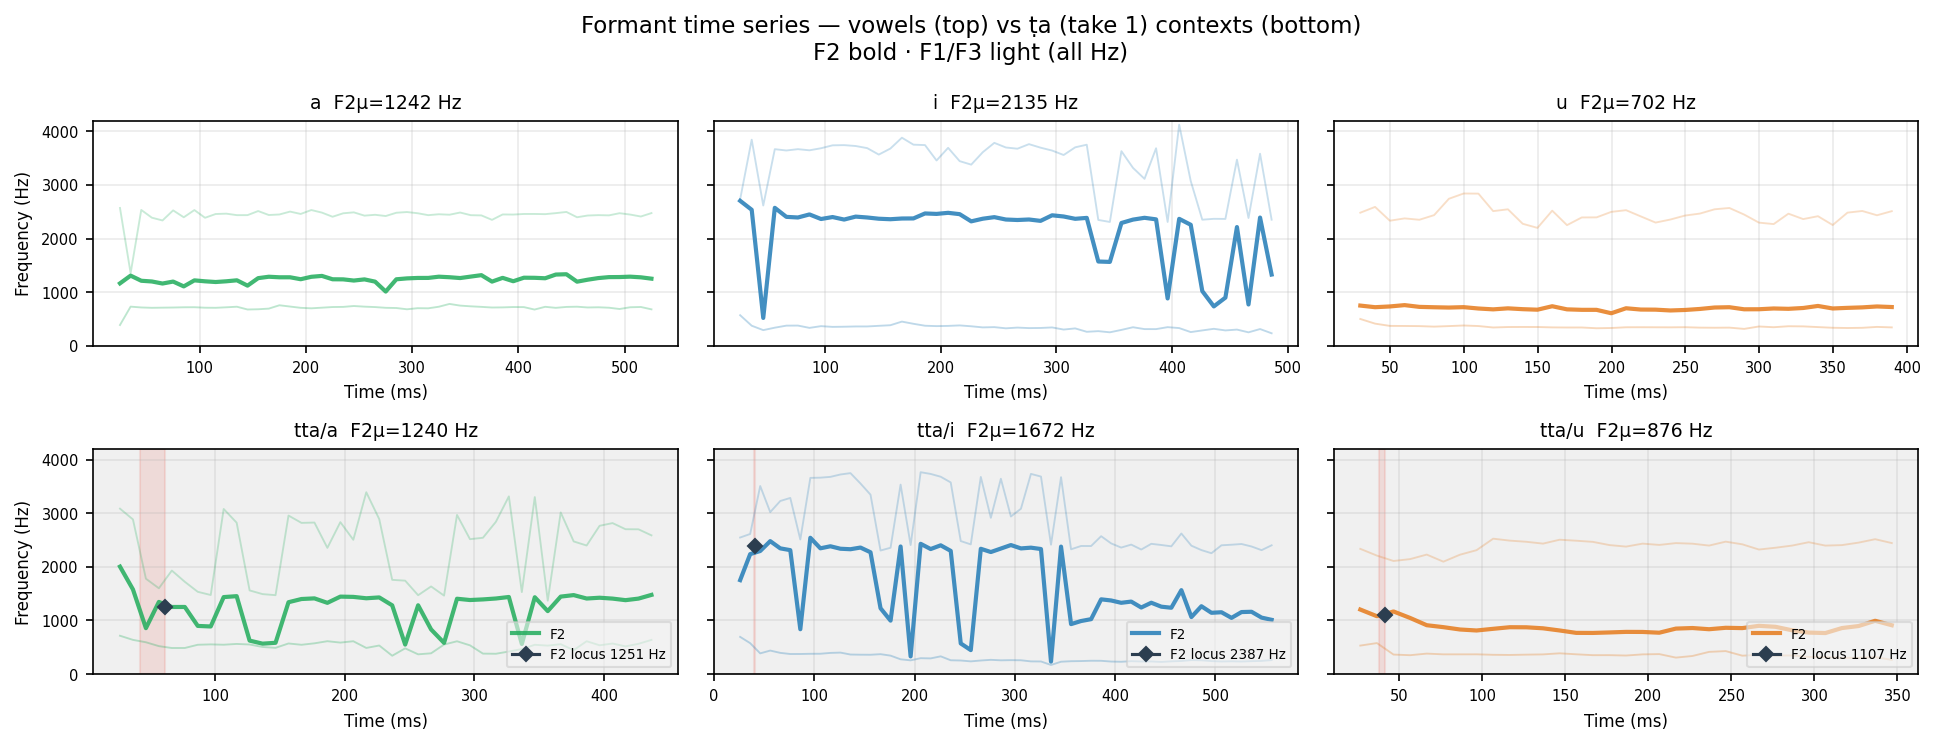
Human take 1
F2 bold · F1/F3 light (alpha). ◆ = F2 locus (F2 at voicing onset = place of articulation marker). Red shade = burst window.
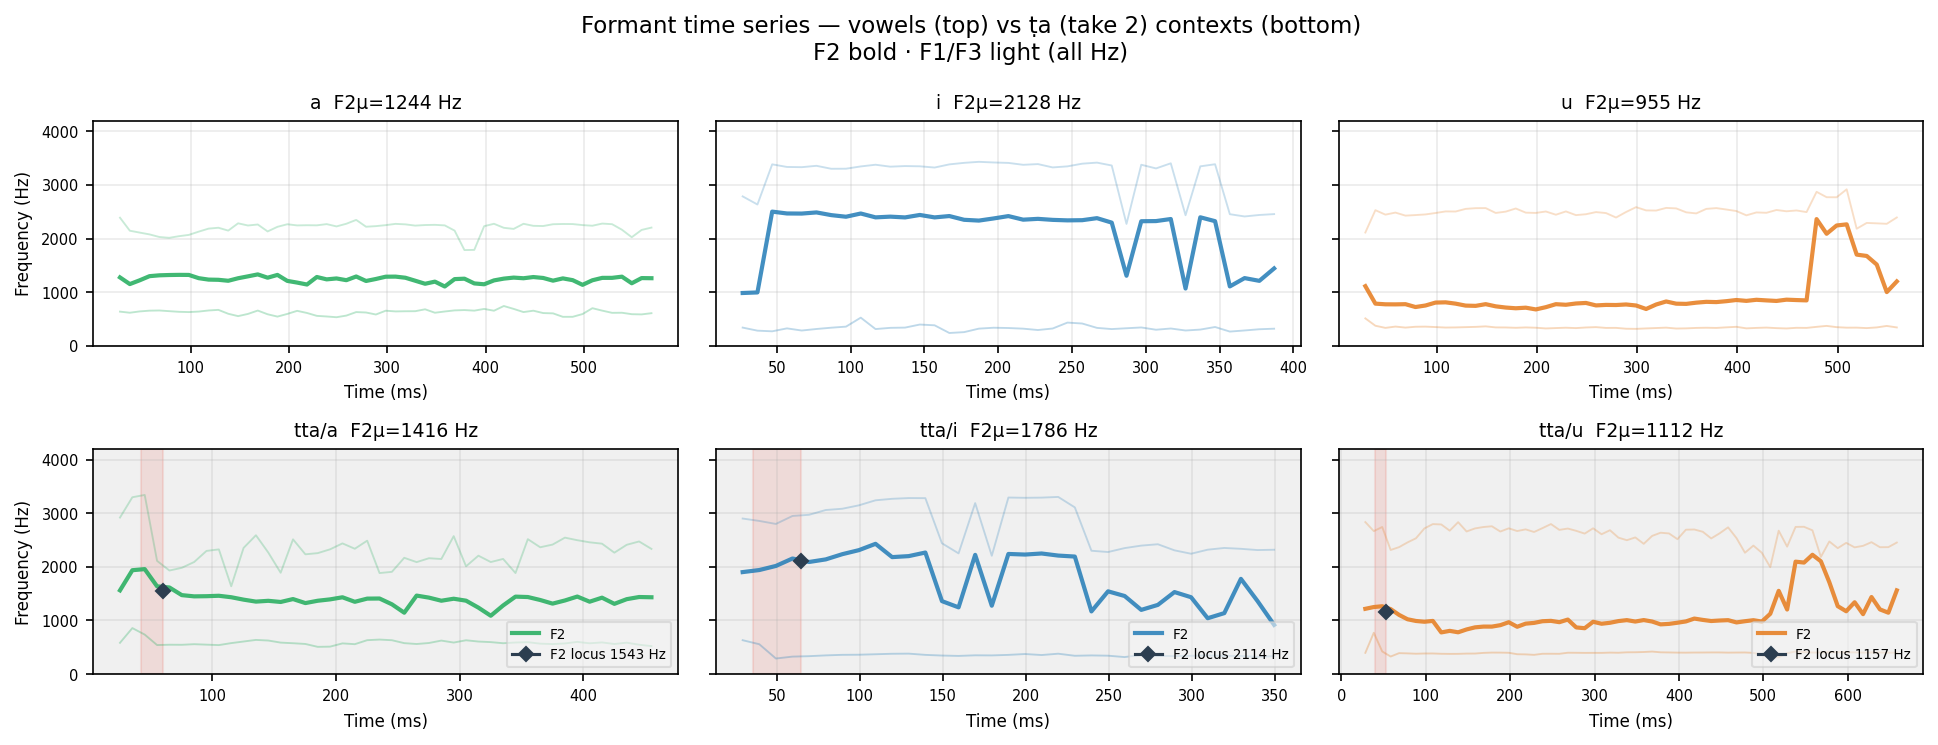
Human take 2
F2 bold · F1/F3 light (alpha). ◆ = F2 locus (F2 at voicing onset = place of articulation marker). Red shade = burst window.
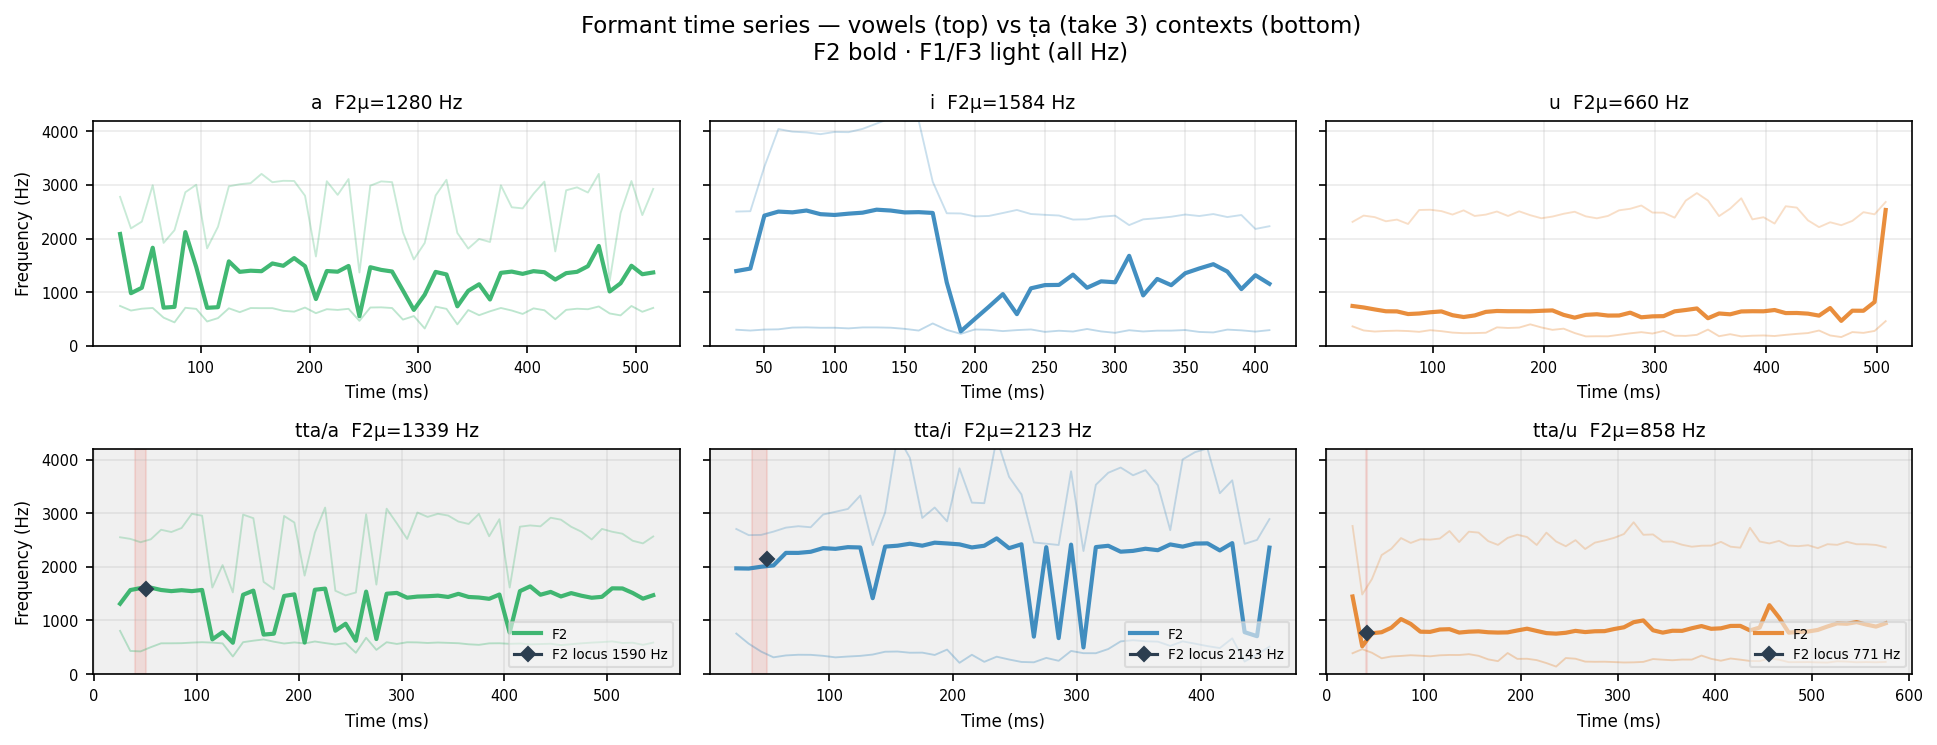
Human take 3
F2 bold · F1/F3 light (alpha). ◆ = F2 locus (F2 at voicing onset = place of articulation marker). Red shade = burst window.
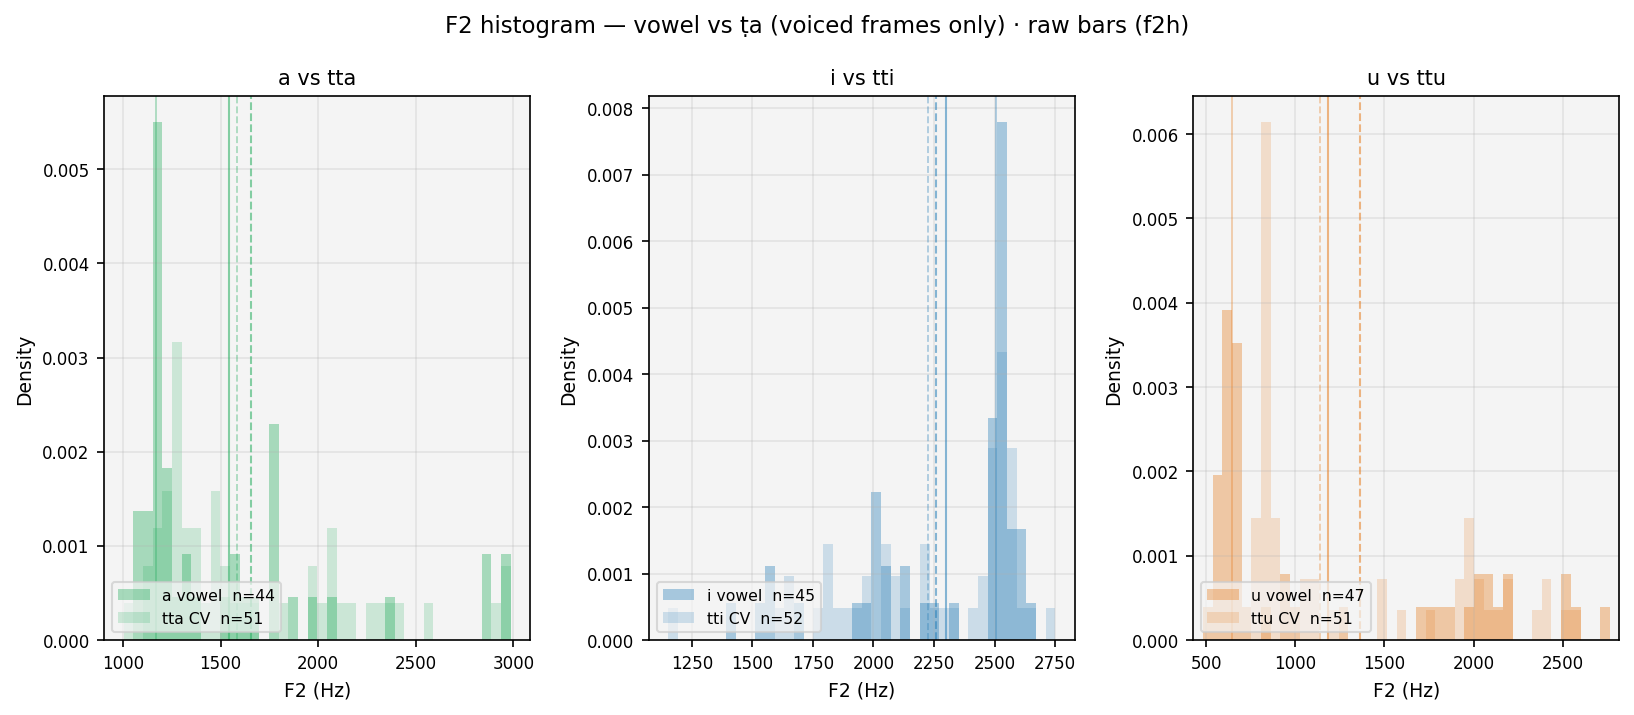
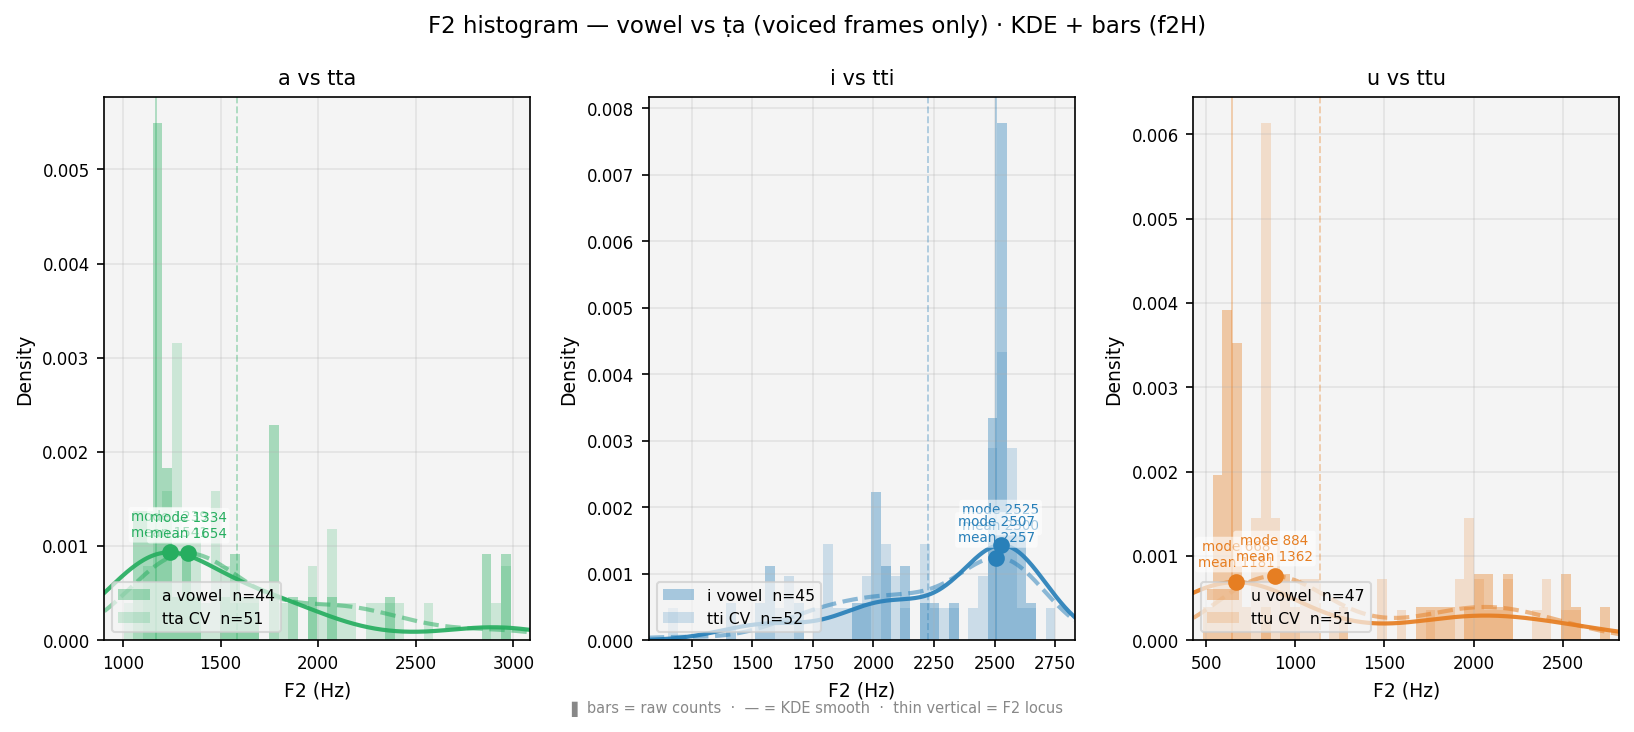
F2 smoothed histogram — vowel (solid) vs CV (dashed). ● = primary peak (mode, most frequent F2). ■ = secondary peak (smaller square). Thin verticals = F2 locus (F2 at voicing onset). Shift between curves = coarticulation. Locus stability across a/i/u contexts characterises the consonant.
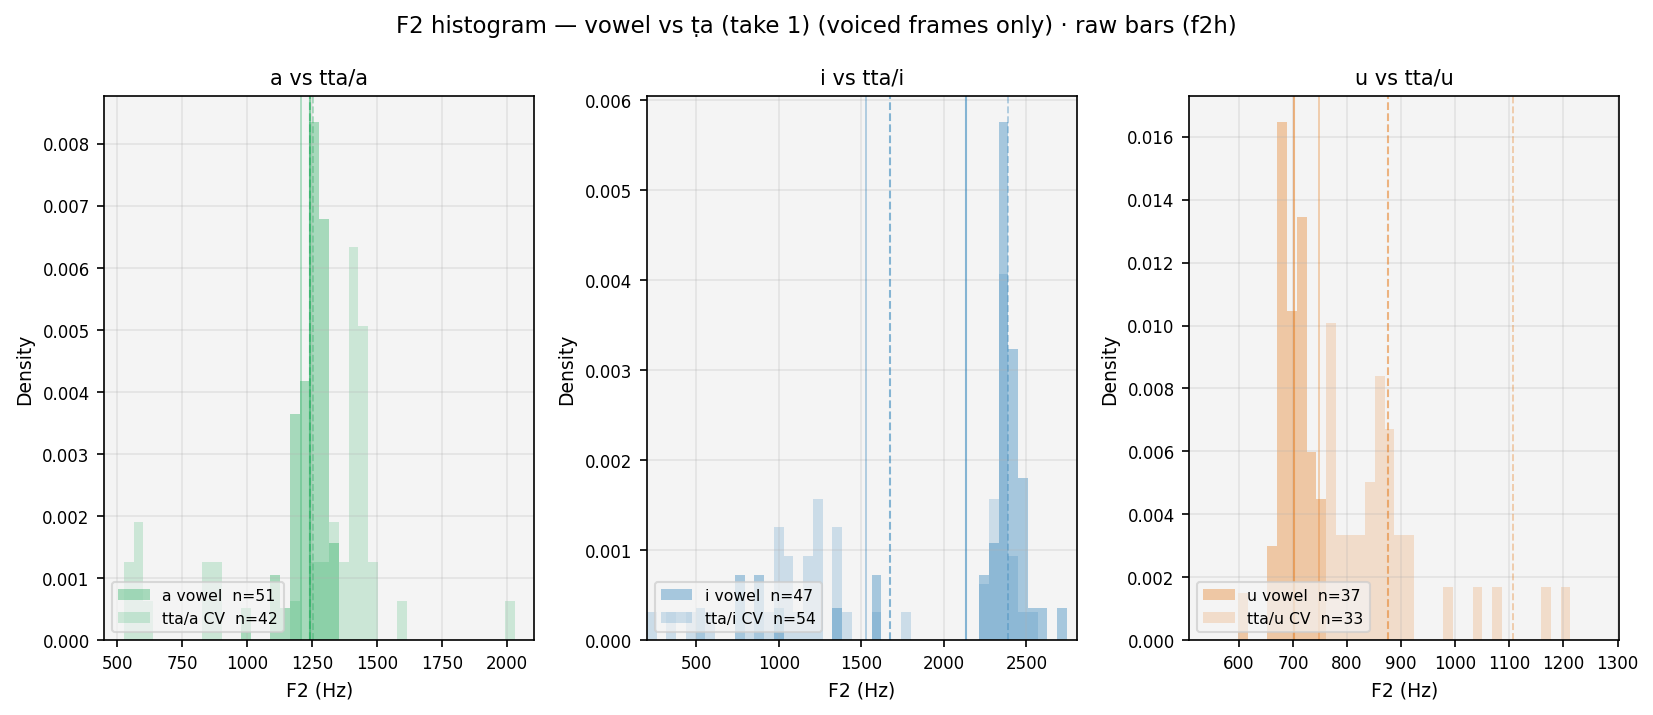
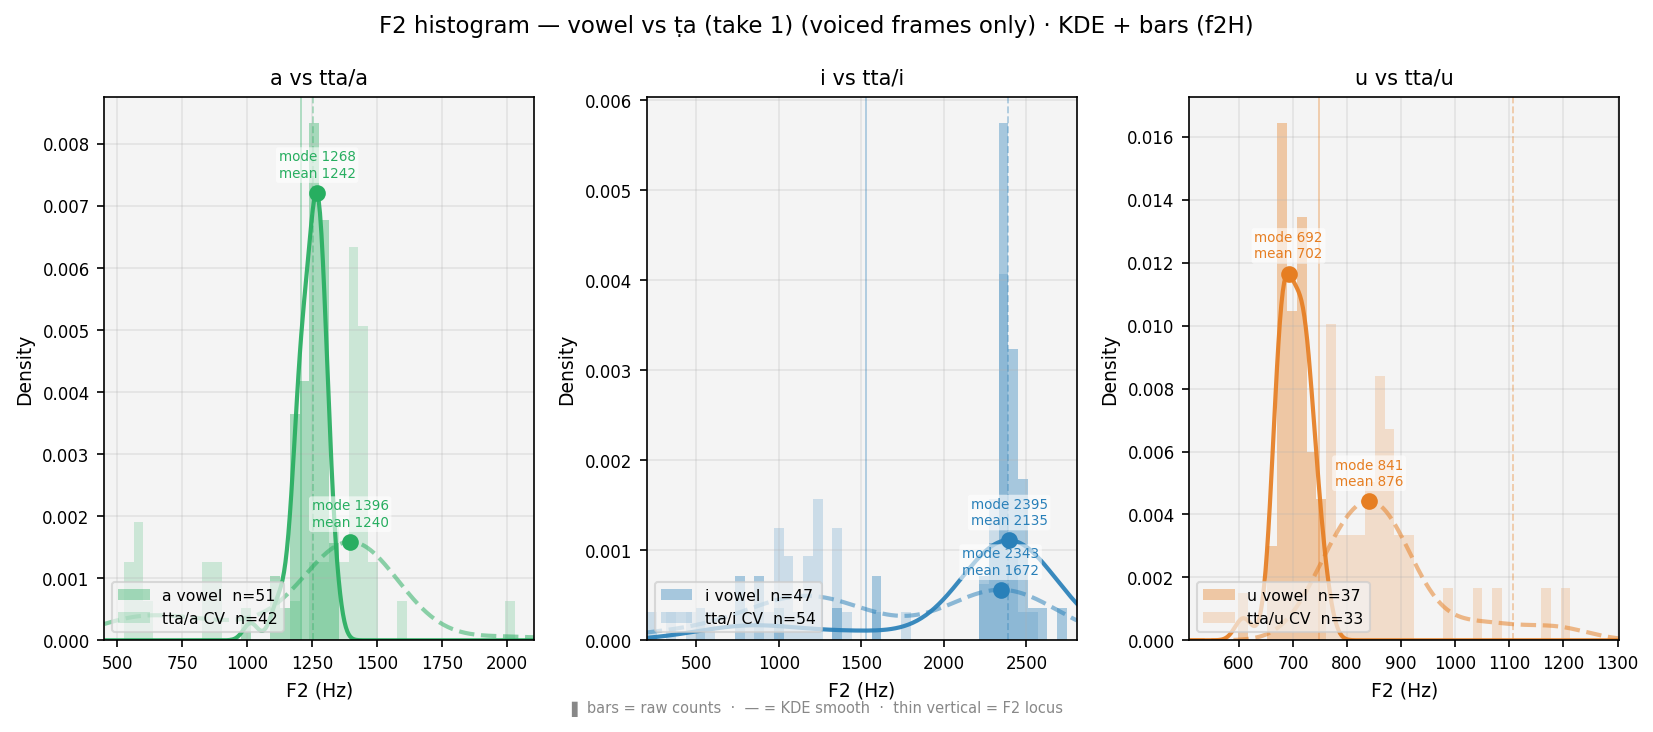
F2 smoothed histogram — vowel (solid) vs CV (dashed). ● = primary peak (mode, most frequent F2). ■ = secondary peak (smaller square). Thin verticals = F2 locus (F2 at voicing onset). Shift between curves = coarticulation. Locus stability across a/i/u contexts characterises the consonant.
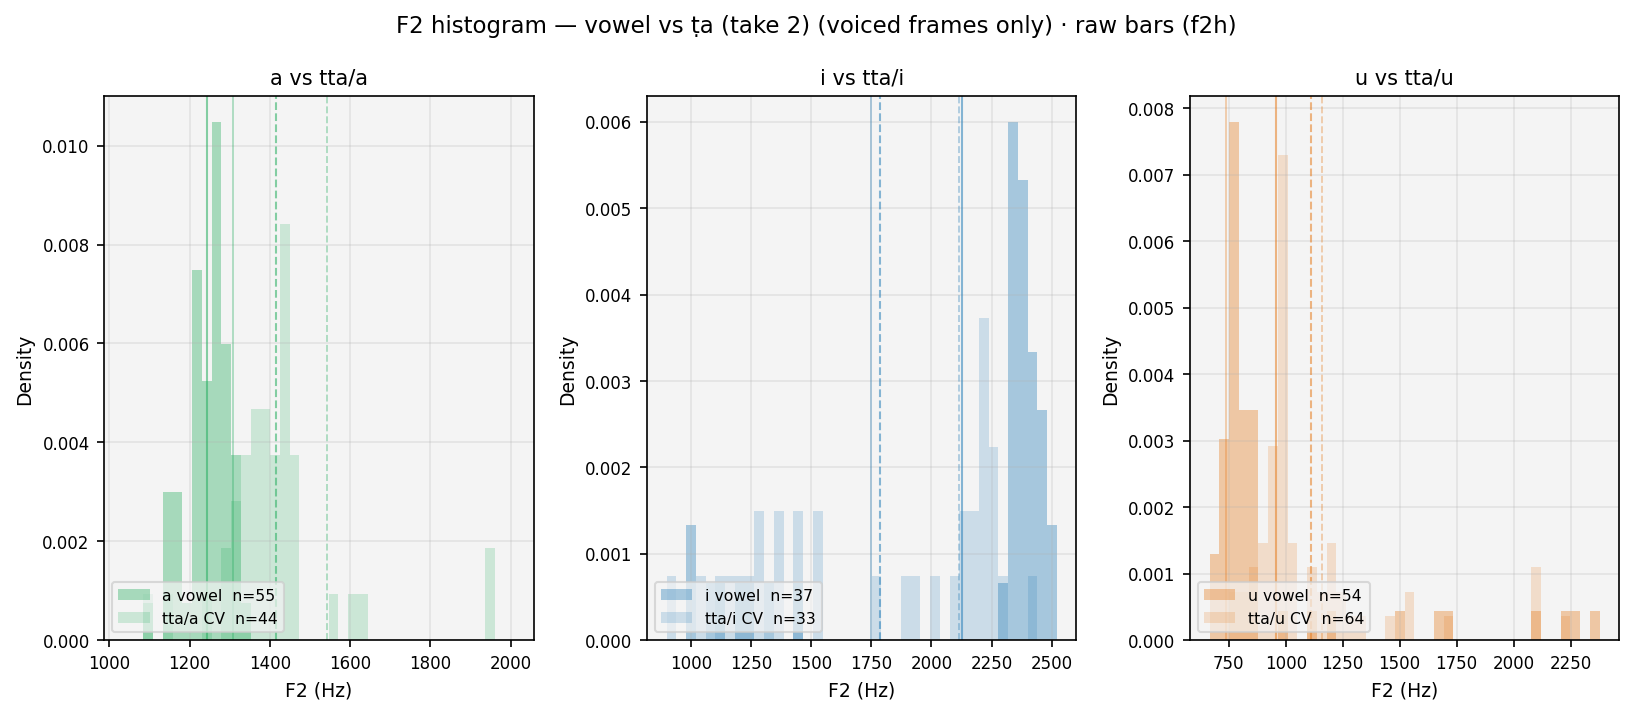
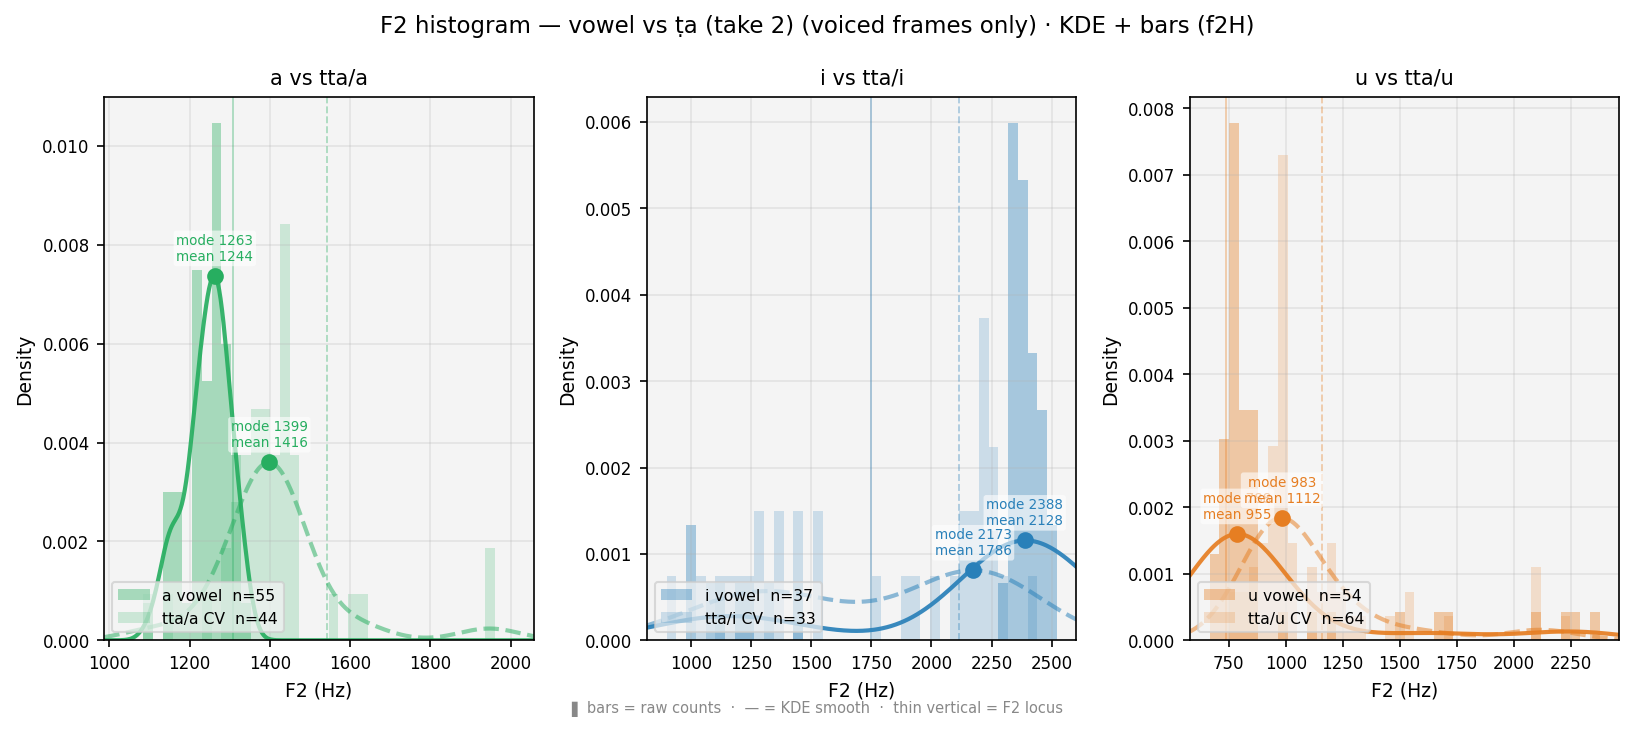
F2 smoothed histogram — vowel (solid) vs CV (dashed). ● = primary peak (mode, most frequent F2). ■ = secondary peak (smaller square). Thin verticals = F2 locus (F2 at voicing onset). Shift between curves = coarticulation. Locus stability across a/i/u contexts characterises the consonant.
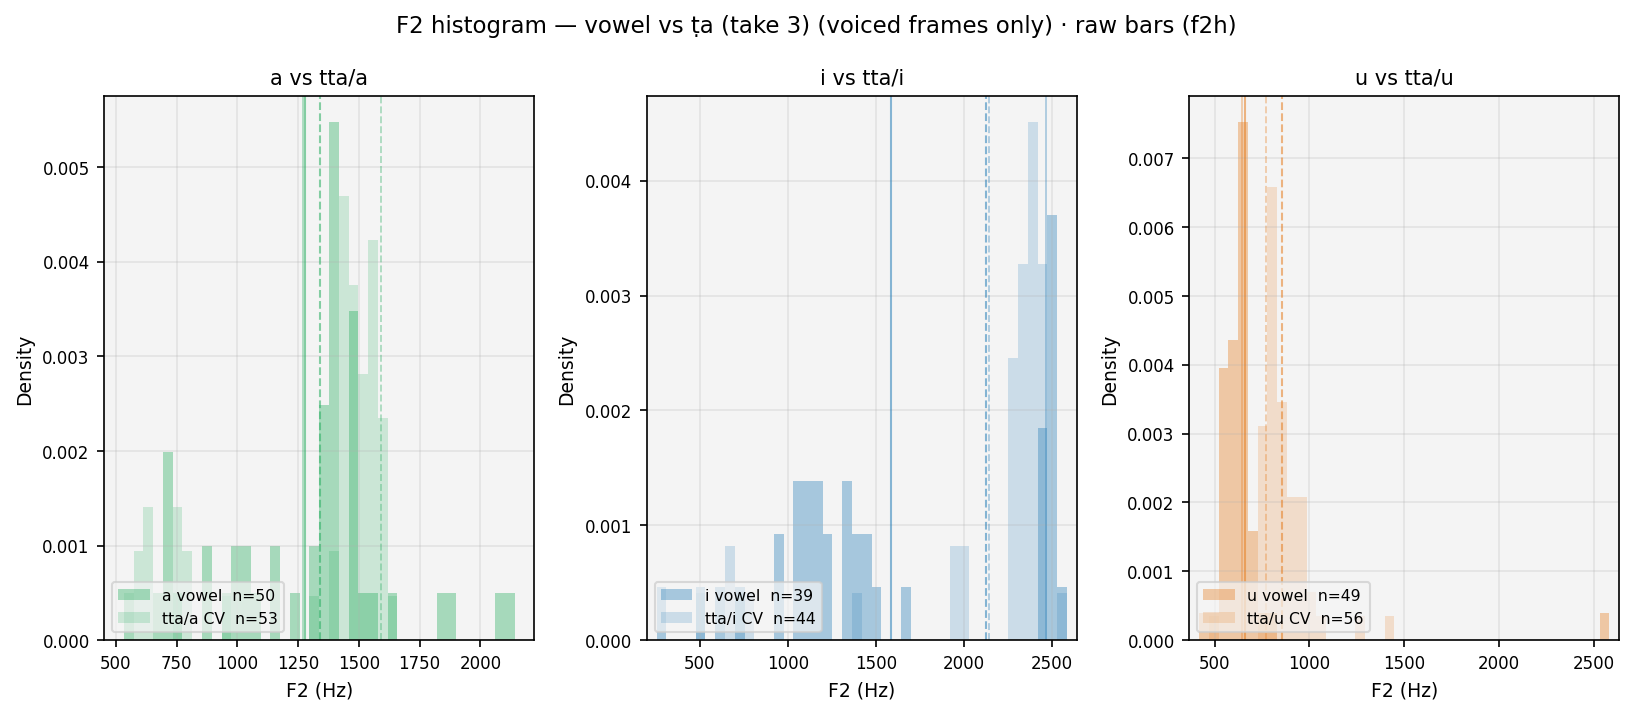
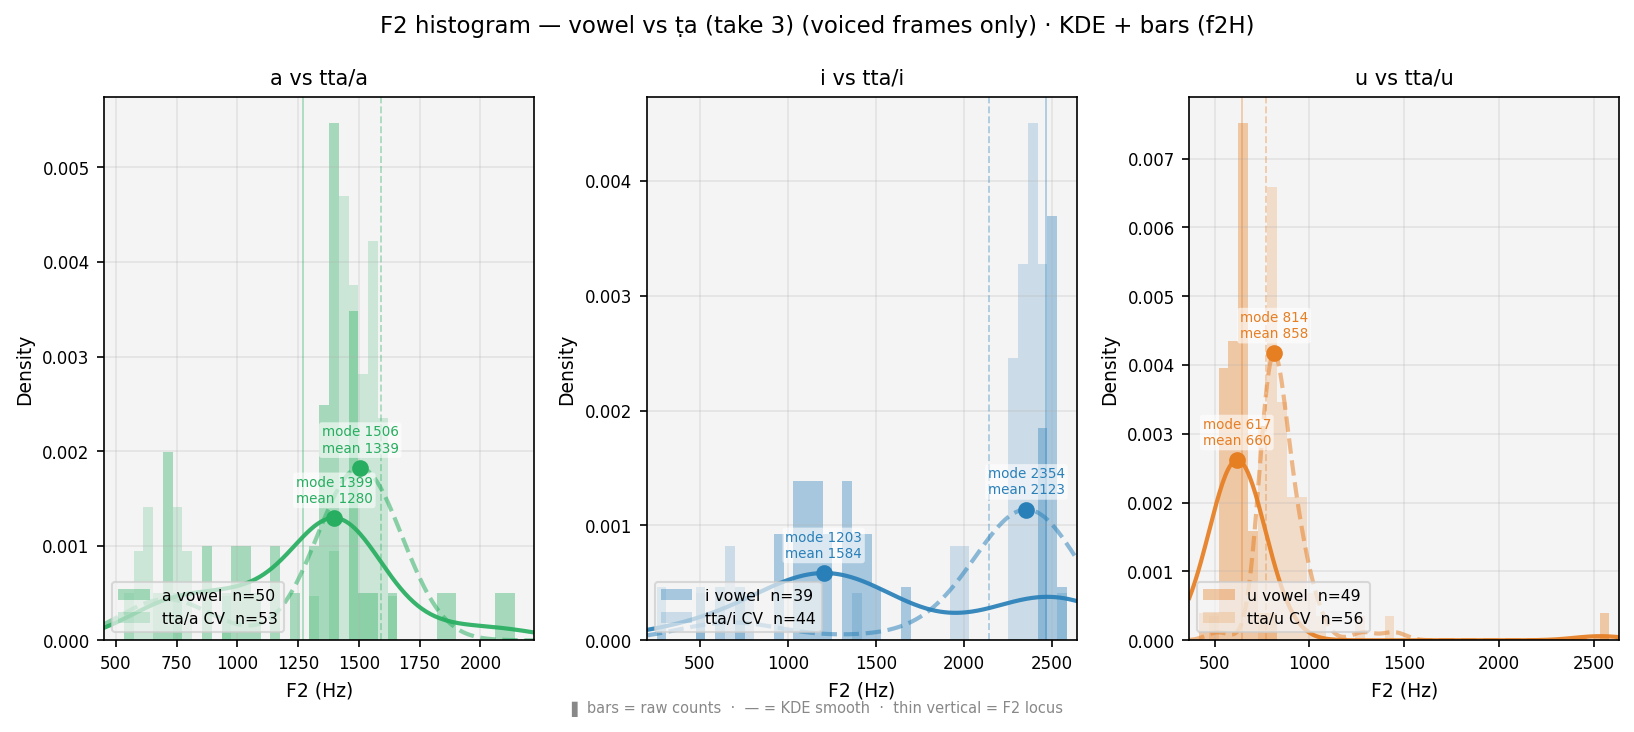
F2 smoothed histogram — vowel (solid) vs CV (dashed). ● = primary peak (mode, most frequent F2). ■ = secondary peak (smaller square). Thin verticals = F2 locus (F2 at voicing onset). Shift between curves = coarticulation. Locus stability across a/i/u contexts characterises the consonant.
| Metric — ṭȧ (Retroflex) | a context | i context | u context | mean ± σ (क् estimate) |
|---|---|---|---|---|
| Pitch gap / burst (ms) | 12 | 11 | 17 | 13 ±2 |
| Pitch/F0 primary peak (Hz) | 101 | 138 | 135 | 125 ±17 |
| Pitch/F0 secondary peak (Hz) | 125 | 101 | 95 | 107 ±13 |
| ΔF0 secondary−primary (Hz) | 25 | -37 | -41 | -18 ±30 |
| F2 locus at voicing onset (Hz) | 1582 | 2227 | 1137 | 1649 ±448 |
| F2 steady-state / vowel (Hz) | 1965 | 2181 | 1873 | 2006 ±129 |
| Reference vowels — no consonant onset: | ||||
| a (pure vowel) | Pitch/F0 mean 107 Hz · F2 locus 1169 Hz · F2 steady 1946 Hz | — | ||
| i (pure vowel) | Pitch/F0 mean 109 Hz · F2 locus 2506 Hz · F2 steady 2058 Hz | — | ||
| u (pure vowel) | Pitch/F0 mean 114 Hz · F2 locus 647 Hz · F2 steady 1814 Hz | — | ||
| Metric — ṭȧ (Retroflex) | a context | i context | u context | mean ± σ (क् estimate) |
|---|---|---|---|---|
| Pitch gap / burst (ms) | 20 | 1 | 4 | 8 ±8 |
| Pitch/F0 primary peak (Hz) | 256 | 227 | 182 | 222 ±31 |
| Pitch/F0 secondary peak (Hz) | 188 | 183 | — | 186 ±2 |
| ΔF0 secondary−primary (Hz) | -68 | -44 | — | -56 ±12 |
| F2 locus at voicing onset (Hz) | 1251 | 2387 | 1107 | 1582 ±572 |
| F2 steady-state / vowel (Hz) | 1279 | 1295 | 861 | 1145 ±201 |
| Reference vowels — no consonant onset: | ||||
| a (pure vowel) | Pitch/F0 mean 187 Hz · F2 locus 1207 Hz · F2 steady 1270 Hz | — | ||
| i (pure vowel) | Pitch/F0 mean 188 Hz · F2 locus 1529 Hz · F2 steady 1895 Hz | — | ||
| u (pure vowel) | Pitch/F0 mean 174 Hz · F2 locus 748 Hz · F2 steady 703 Hz | — | ||
| Metric — ṭȧ (Retroflex) | a context | i context | u context | mean ± σ (क् estimate) |
|---|---|---|---|---|
| Pitch gap / burst (ms) | 18 | 28 | 13 | 20 ±6 |
| Pitch/F0 primary peak (Hz) | 163 | 84 | 201 | 150 ±49 |
| Pitch/F0 secondary peak (Hz) | — | — | — | — |
| ΔF0 secondary−primary (Hz) | — | — | — | — |
| F2 locus at voicing onset (Hz) | 1543 | 2114 | 1157 | 1605 ±393 |
| F2 steady-state / vowel (Hz) | 1364 | 1388 | 1280 | 1344 ±46 |
| Reference vowels — no consonant onset: | ||||
| a (pure vowel) | Pitch/F0 mean 177 Hz · F2 locus 1308 Hz · F2 steady 1225 Hz | — | ||
| i (pure vowel) | Pitch/F0 mean 151 Hz · F2 locus 1750 Hz · F2 steady 1954 Hz | — | ||
| u (pure vowel) | Pitch/F0 mean 105 Hz · F2 locus 739 Hz · F2 steady 1205 Hz | — | ||
| Metric — ṭȧ (Retroflex) | a context | i context | u context | mean ± σ (क् estimate) |
|---|---|---|---|---|
| Pitch gap / burst (ms) | 10 | 12 | 1 | 8 ±5 |
| Pitch/F0 primary peak (Hz) | 142 | 167 | 186 | 165 ±18 |
| Pitch/F0 secondary peak (Hz) | — | — | 174 | 174 |
| ΔF0 secondary−primary (Hz) | — | — | -12 | -12 |
| F2 locus at voicing onset (Hz) | 1590 | 2143 | 771 | 1501 ±564 |
| F2 steady-state / vowel (Hz) | 1453 | 2010 | 890 | 1451 ±457 |
| Reference vowels — no consonant onset: | ||||
| a (pure vowel) | Pitch/F0 mean 140 Hz · F2 locus 1271 Hz · F2 steady 1273 Hz | — | ||
| i (pure vowel) | Pitch/F0 mean 165 Hz · F2 locus 2466 Hz · F2 steady 1254 Hz | — | ||
| u (pure vowel) | Pitch/F0 mean 151 Hz · F2 locus 644 Hz · F2 steady 711 Hz | — | ||
त ta · Dental · Dantya ⠿ drag sections to reorder · 👁 toggle visibility
| TTS — Wavenet-B | |||
|---|---|---|---|
| Vowel | a | i | u |
| CV | ta | ti | tu |
| Human — take 1 | |||
|---|---|---|---|
| Vowel | a | i | u |
| CV | ta/a | ta/i | ta/u |
| Human — take 2 | |||
|---|---|---|---|
| Vowel | a | i | u |
| CV | ta/a | ta/i | ta/u |
| Human — take 3 | |||
|---|---|---|---|
| Vowel | a | i | u |
| CV | ta/a | ta/i | ta/u |
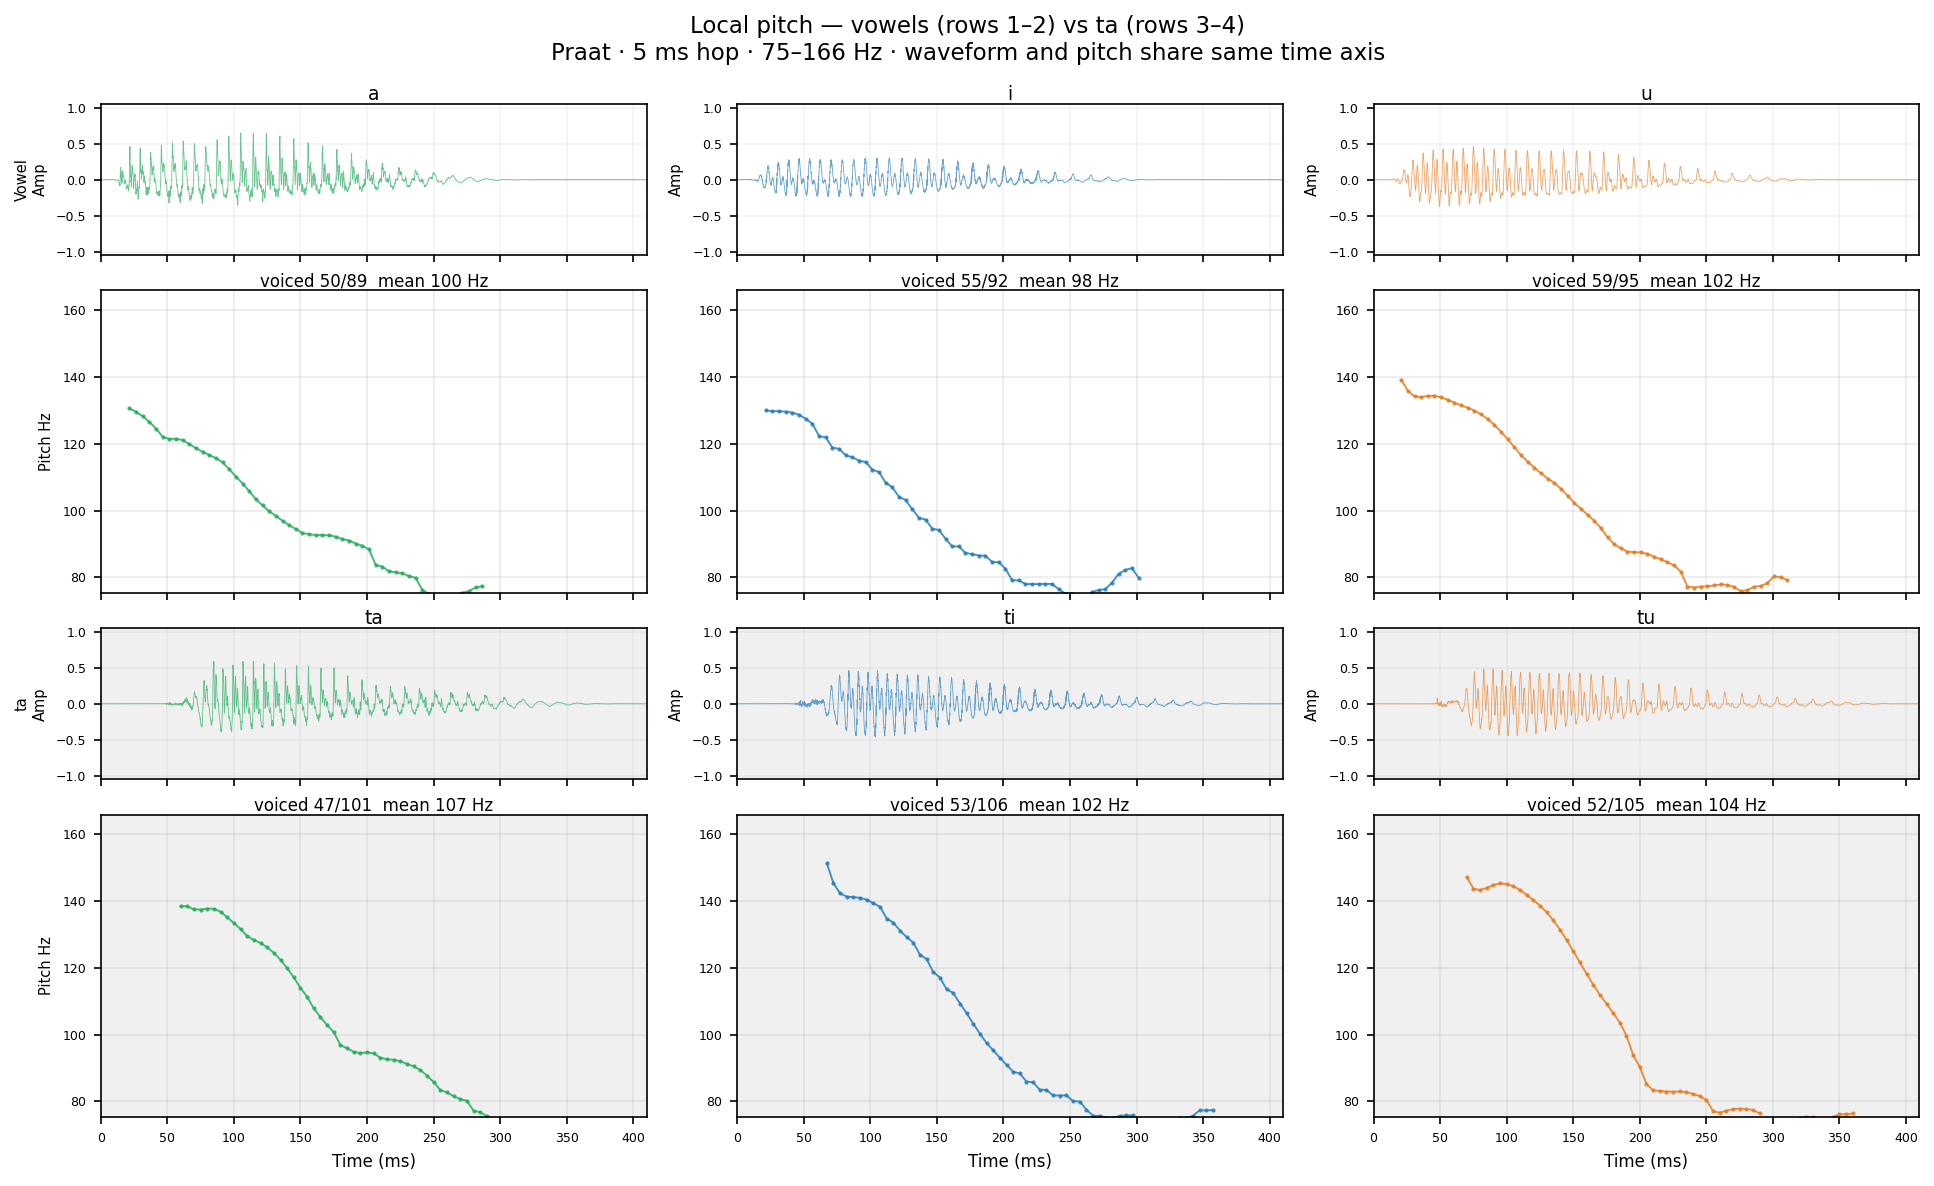
Local pitch (Prof's view): Praat autocorrelation at 5 ms hop, 75–500 Hz range, no voiced/unvoiced separation — gaps only at true silence. Matches Praat's "local pitch plot." Finer time step shows rapid micro-variation in pitch; vowels show relatively flat regions; burst/transitions show gaps or jumps. Compare with the Pitch/IF panel below (10 ms hop, voiced-only, with IF overlay).
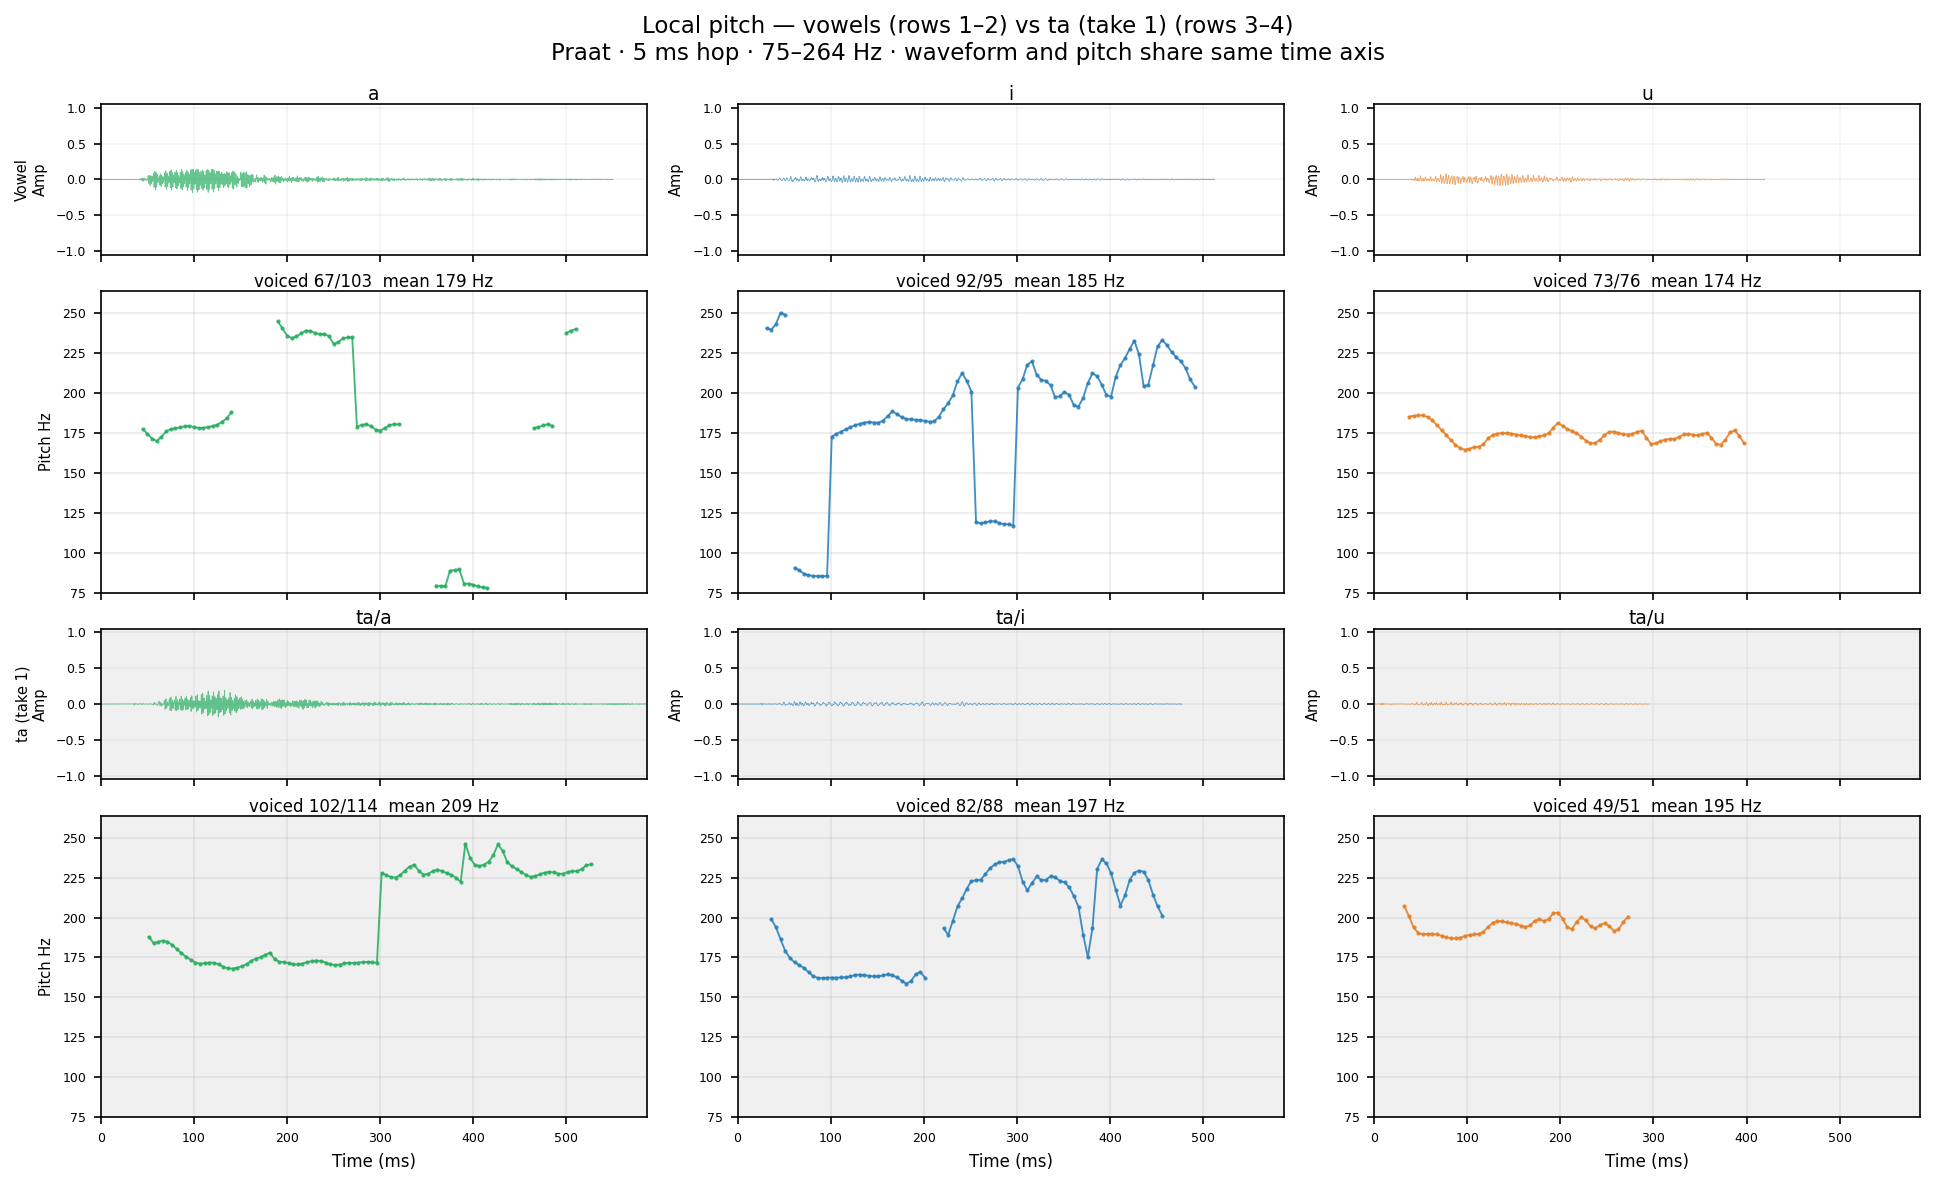
Human take 1 Same Praat settings as TTS. Compare burst gap duration and F0 onset.
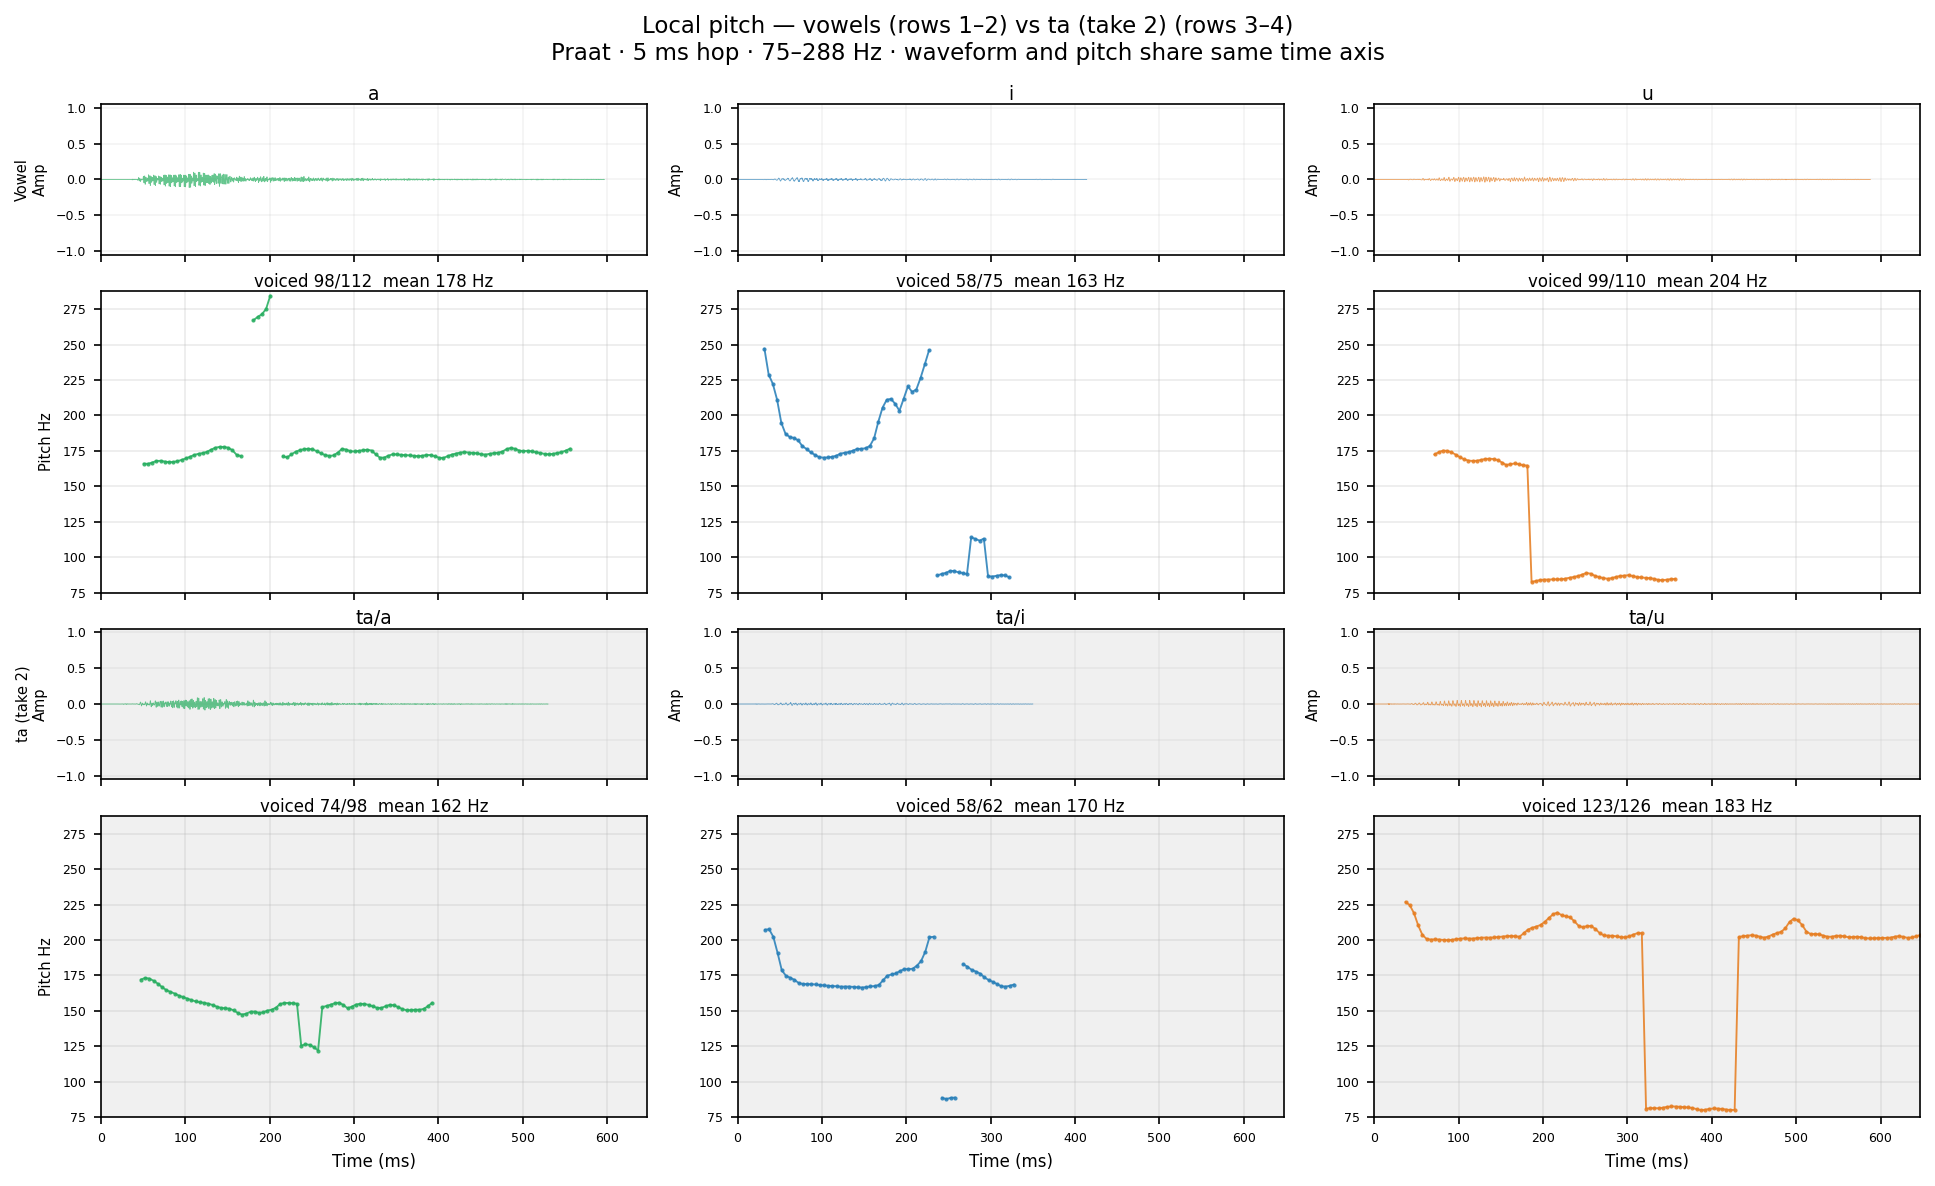
Human take 2 Same Praat settings as TTS. Compare burst gap duration and F0 onset.
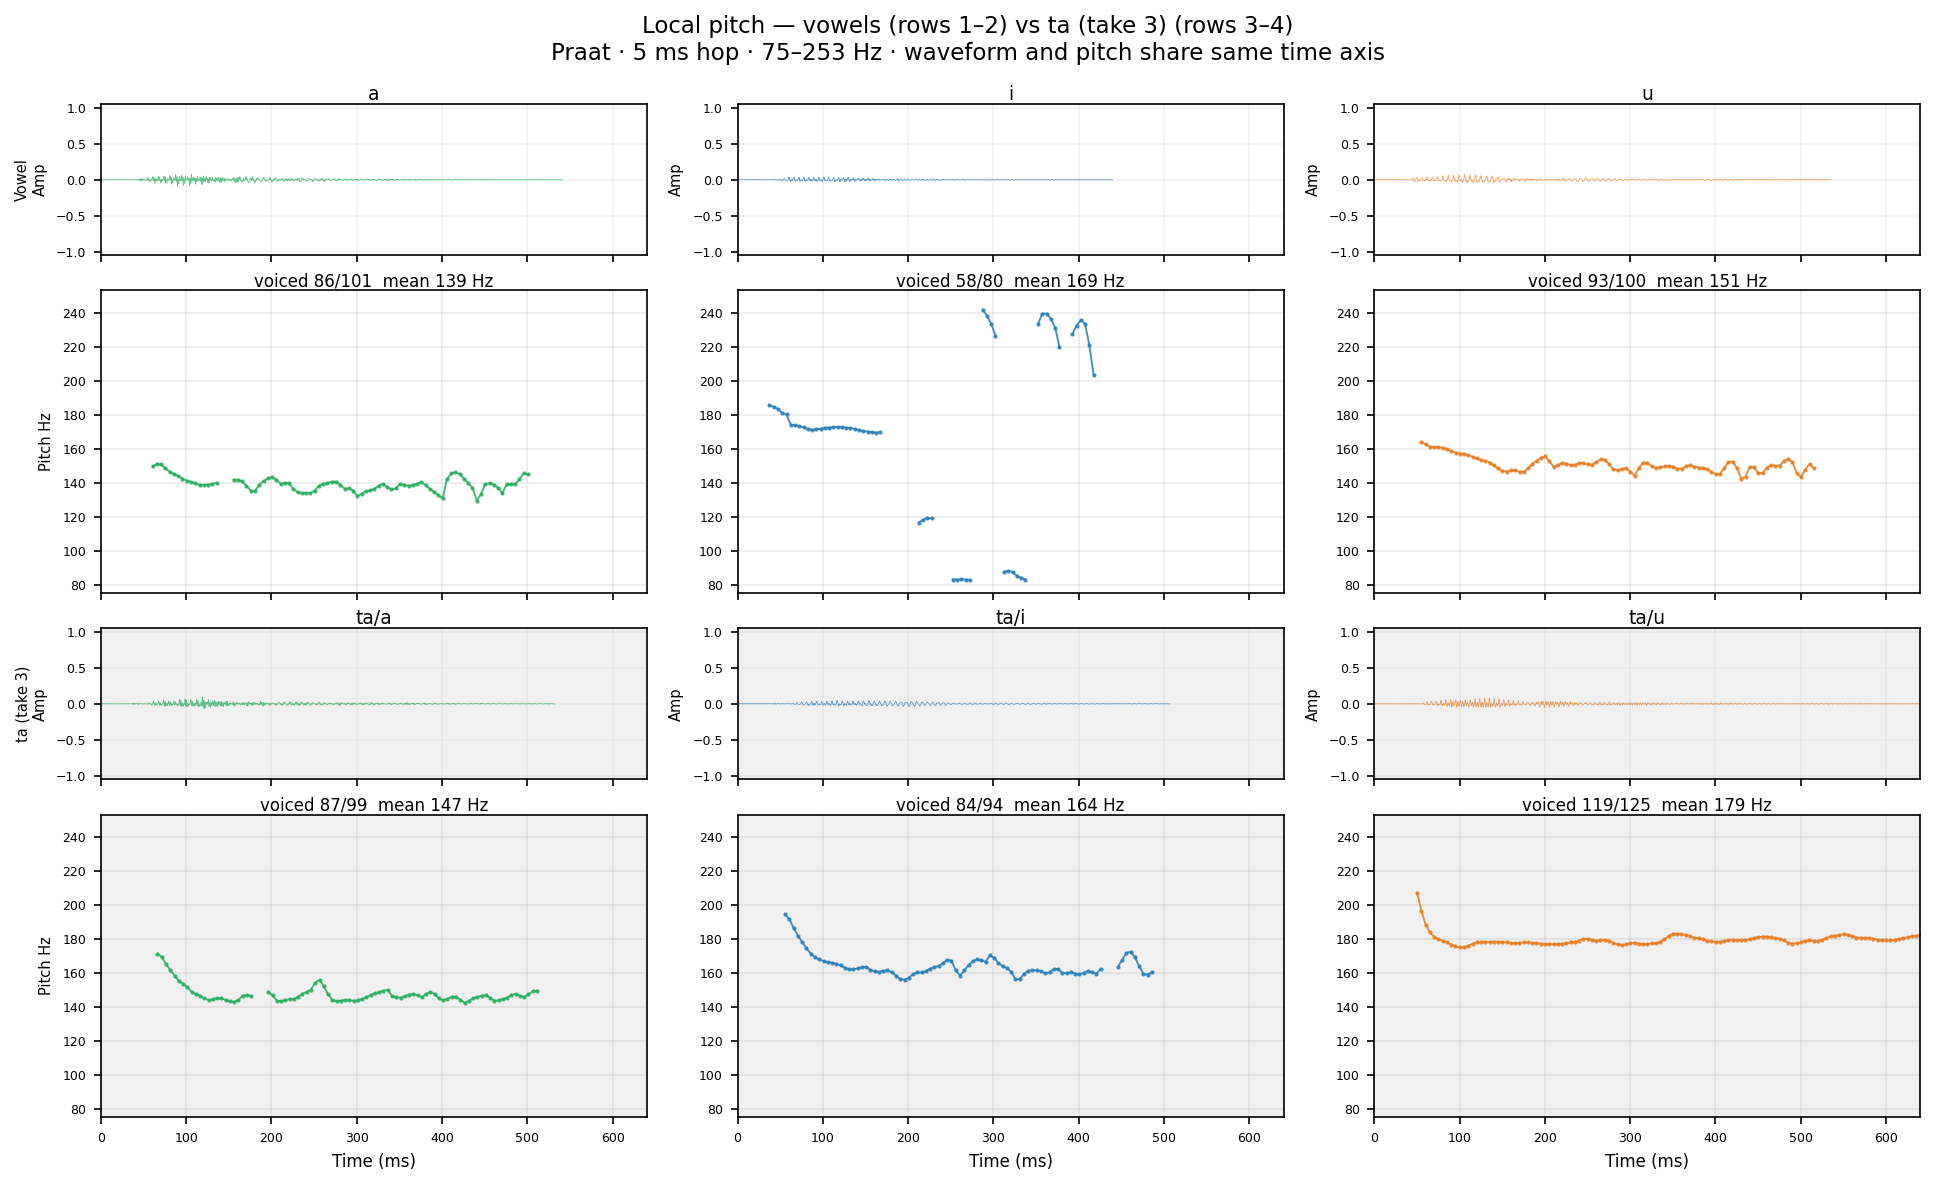
Human take 3 Same Praat settings as TTS. Compare burst gap duration and F0 onset.
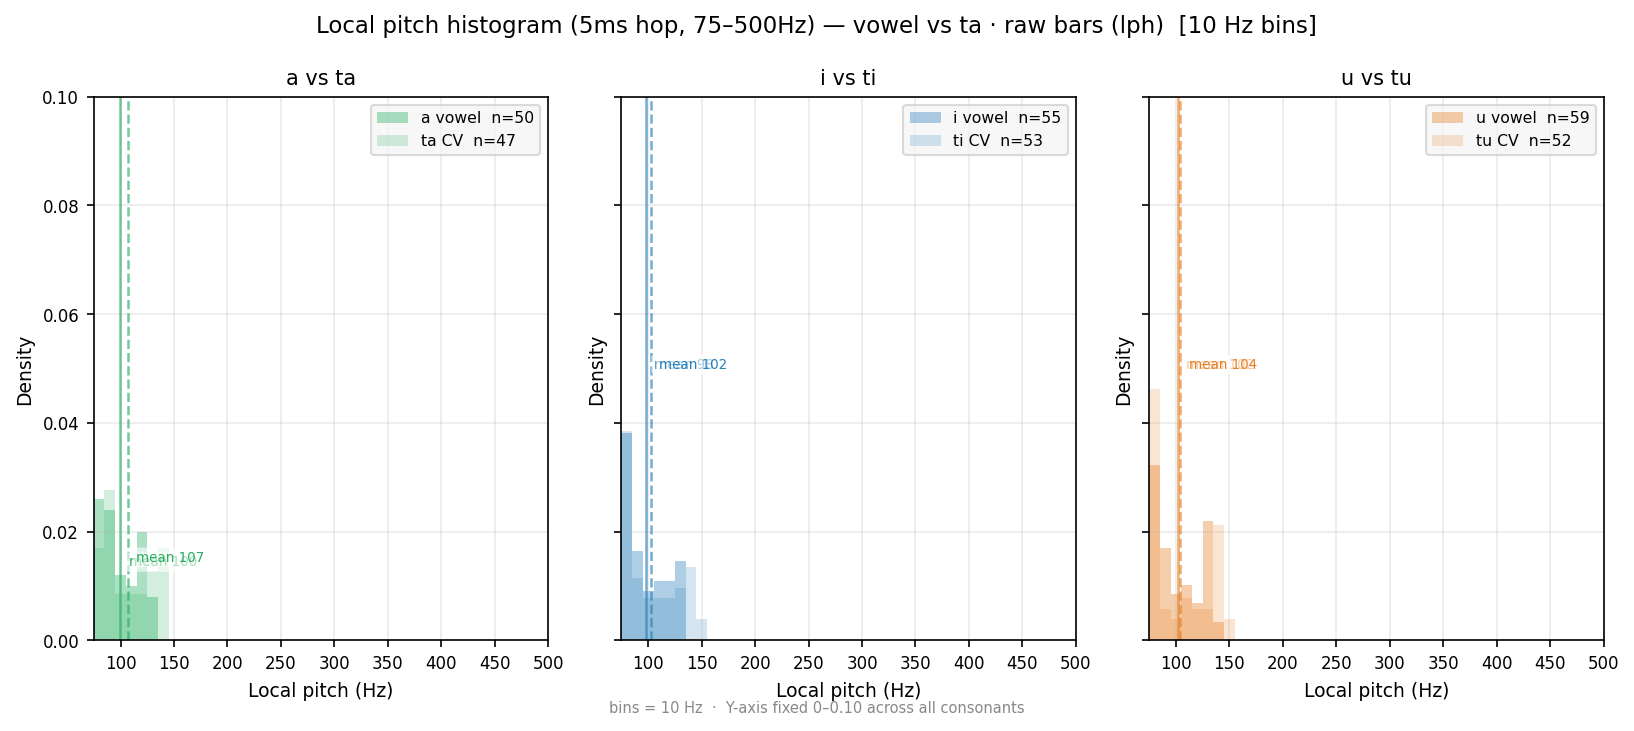
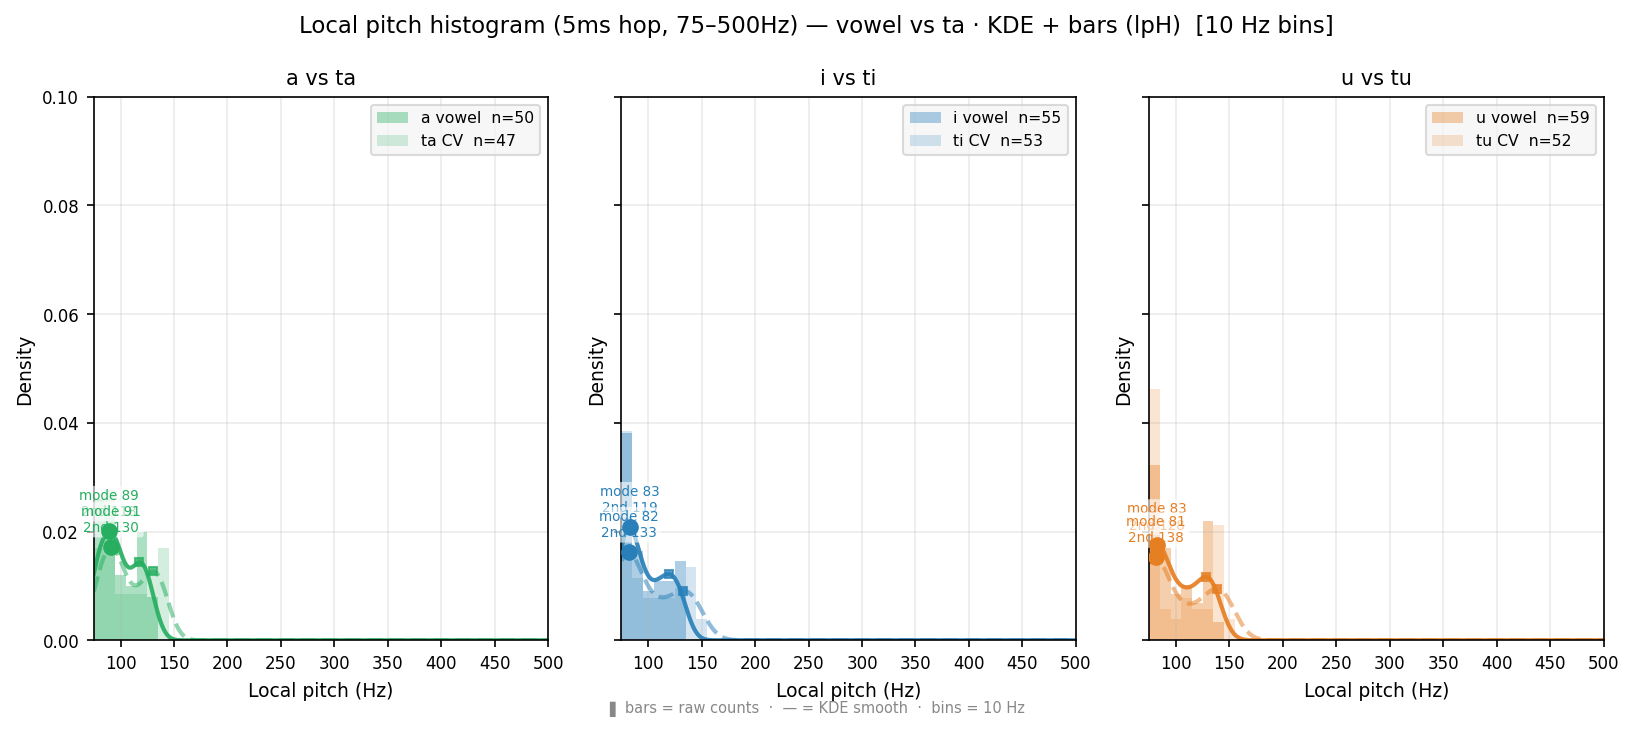
Local pitch (5ms hop, 75–500Hz) histogram — wider range than Pitch/F0 distribution (10ms, 75–300Hz). lpH = alpha bars + KDE smooth: readable peaks, secondary bump visible. lph = raw bars: unsmoothed, honest bin counts. Primary ● and secondary ■ peaks marked on KDE curve (lpH only). Wider X-axis (to 500Hz) may reveal F1 leakage for /i/ /u/ above 300Hz. Compare with Pitch/F0 distribution below for time-step and frequency-range effect.
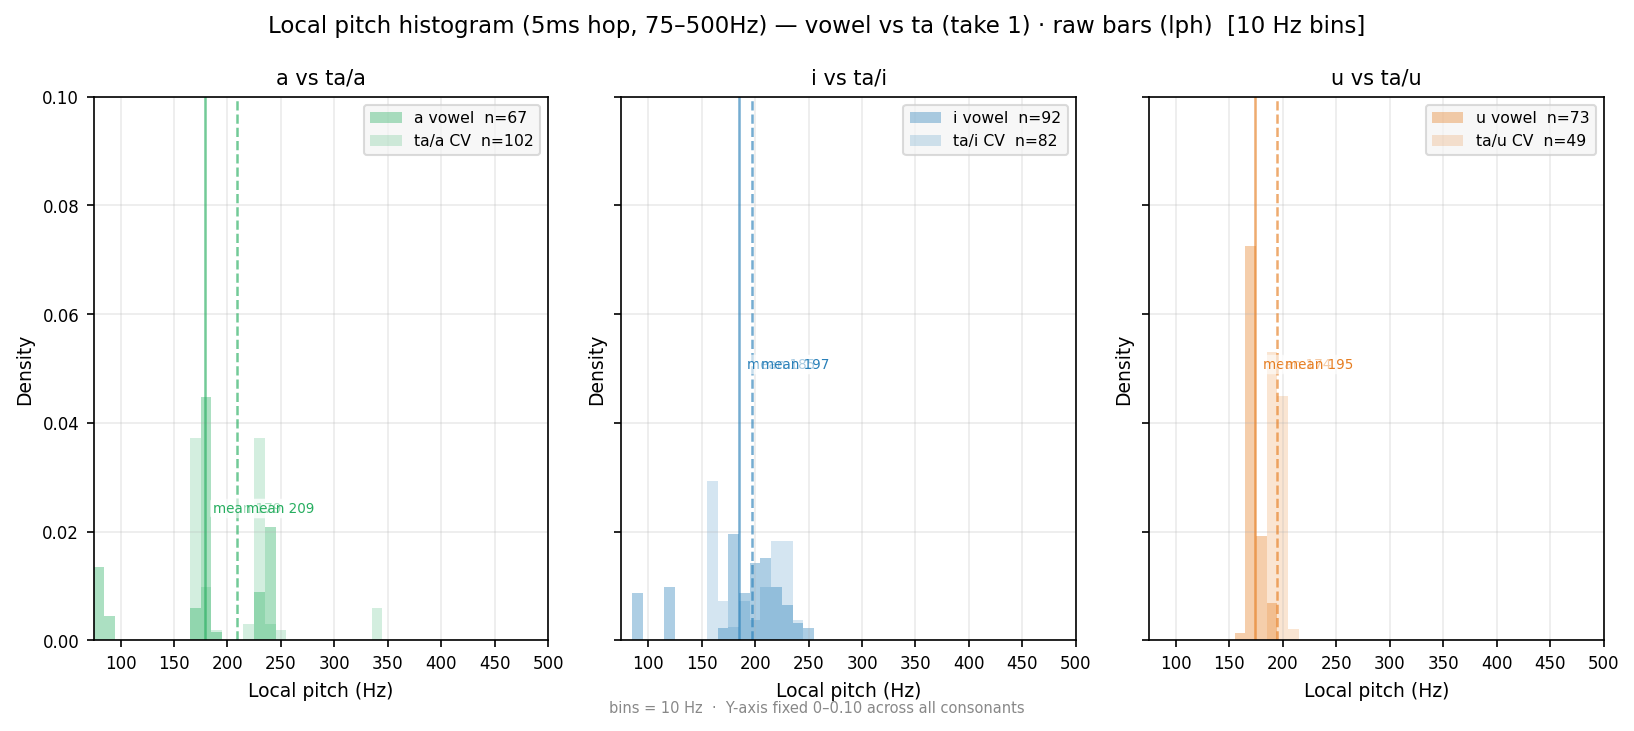
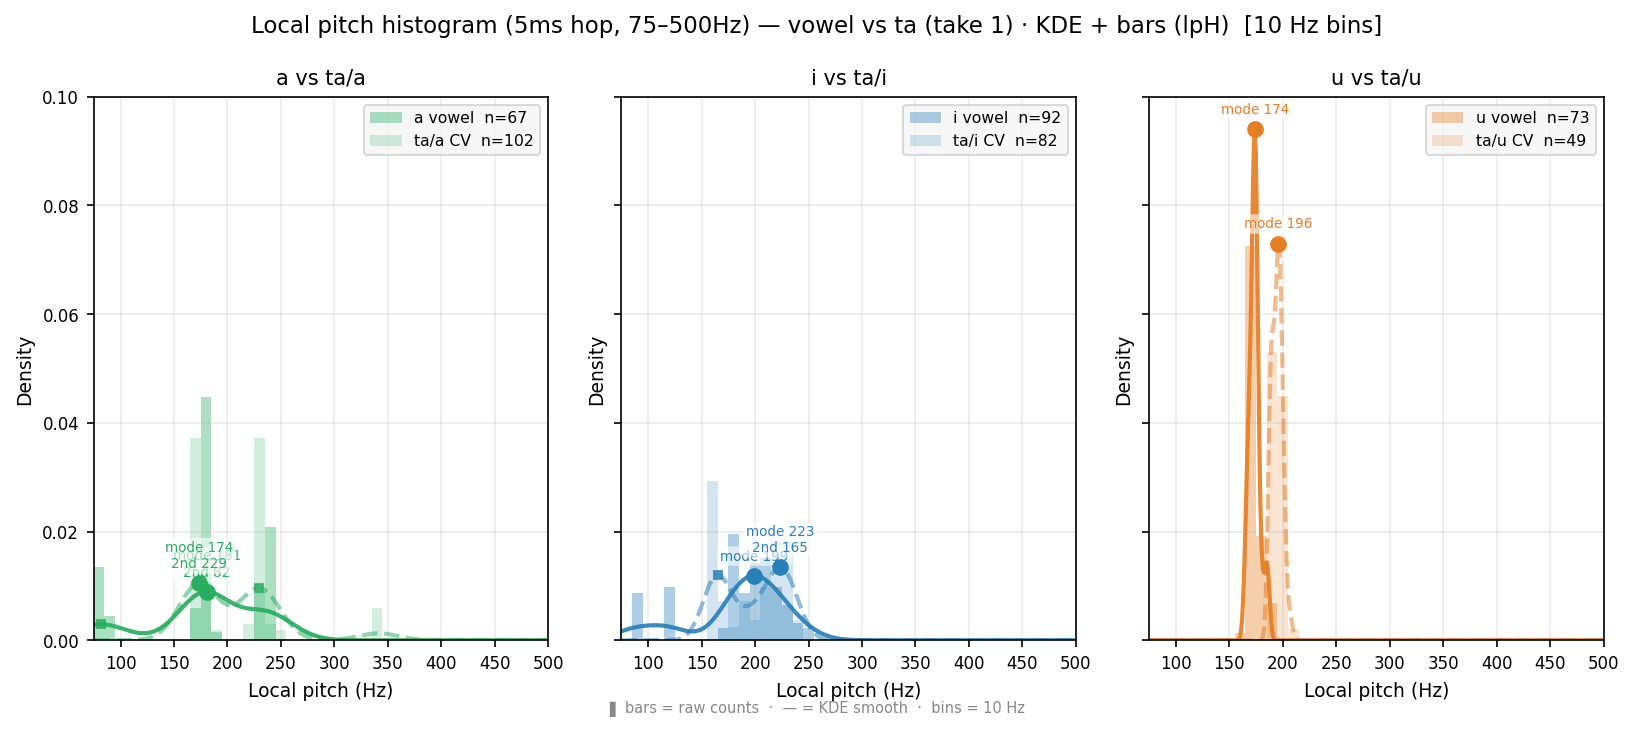
Local pitch (5ms hop, 75–500Hz) histogram — wider range than Pitch/F0 distribution (10ms, 75–300Hz). lpH = alpha bars + KDE smooth: readable peaks, secondary bump visible. lph = raw bars: unsmoothed, honest bin counts. Primary ● and secondary ■ peaks marked on KDE curve (lpH only). Wider X-axis (to 500Hz) may reveal F1 leakage for /i/ /u/ above 300Hz. Compare with Pitch/F0 distribution below for time-step and frequency-range effect.
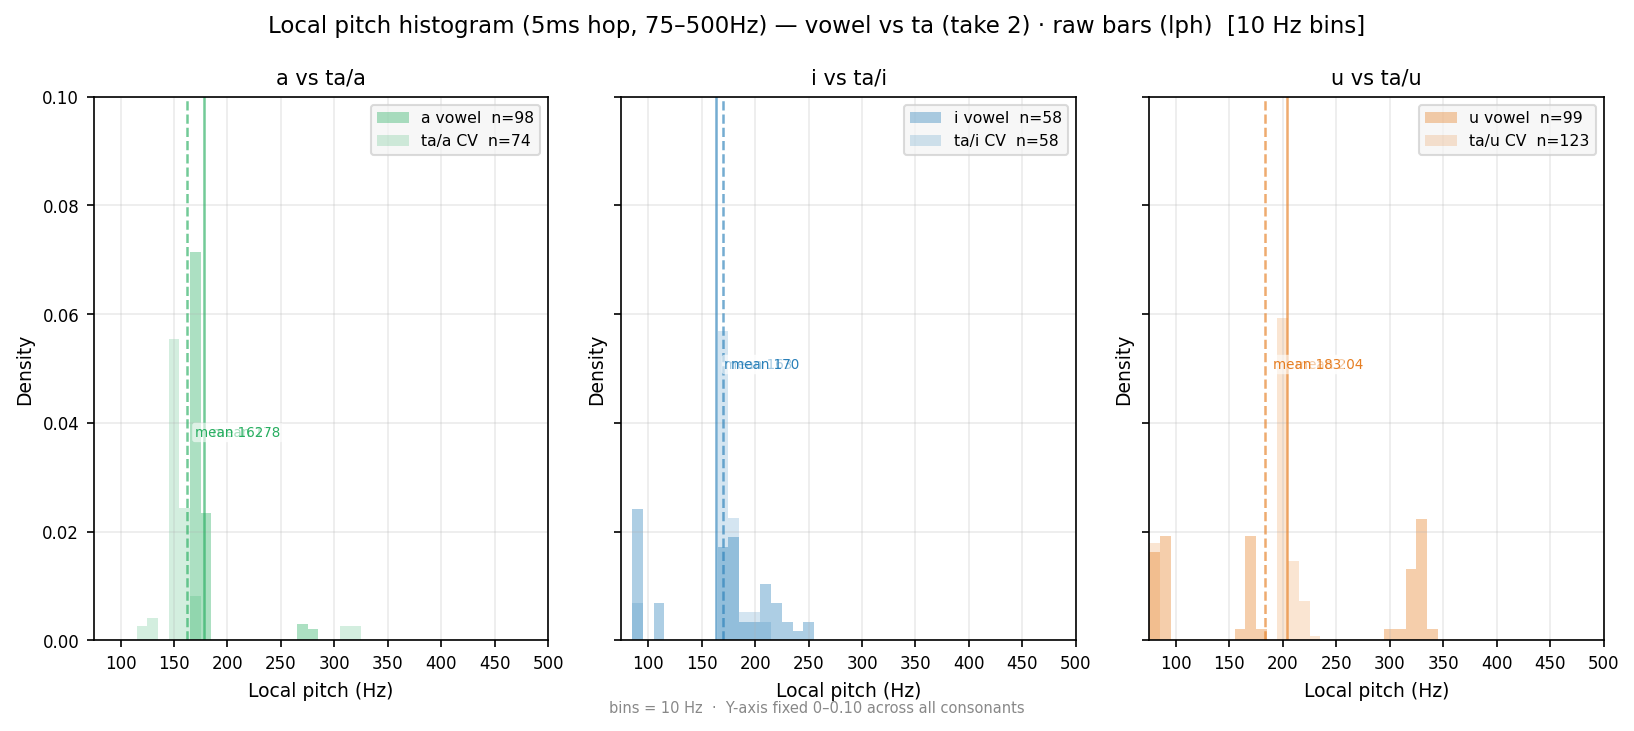
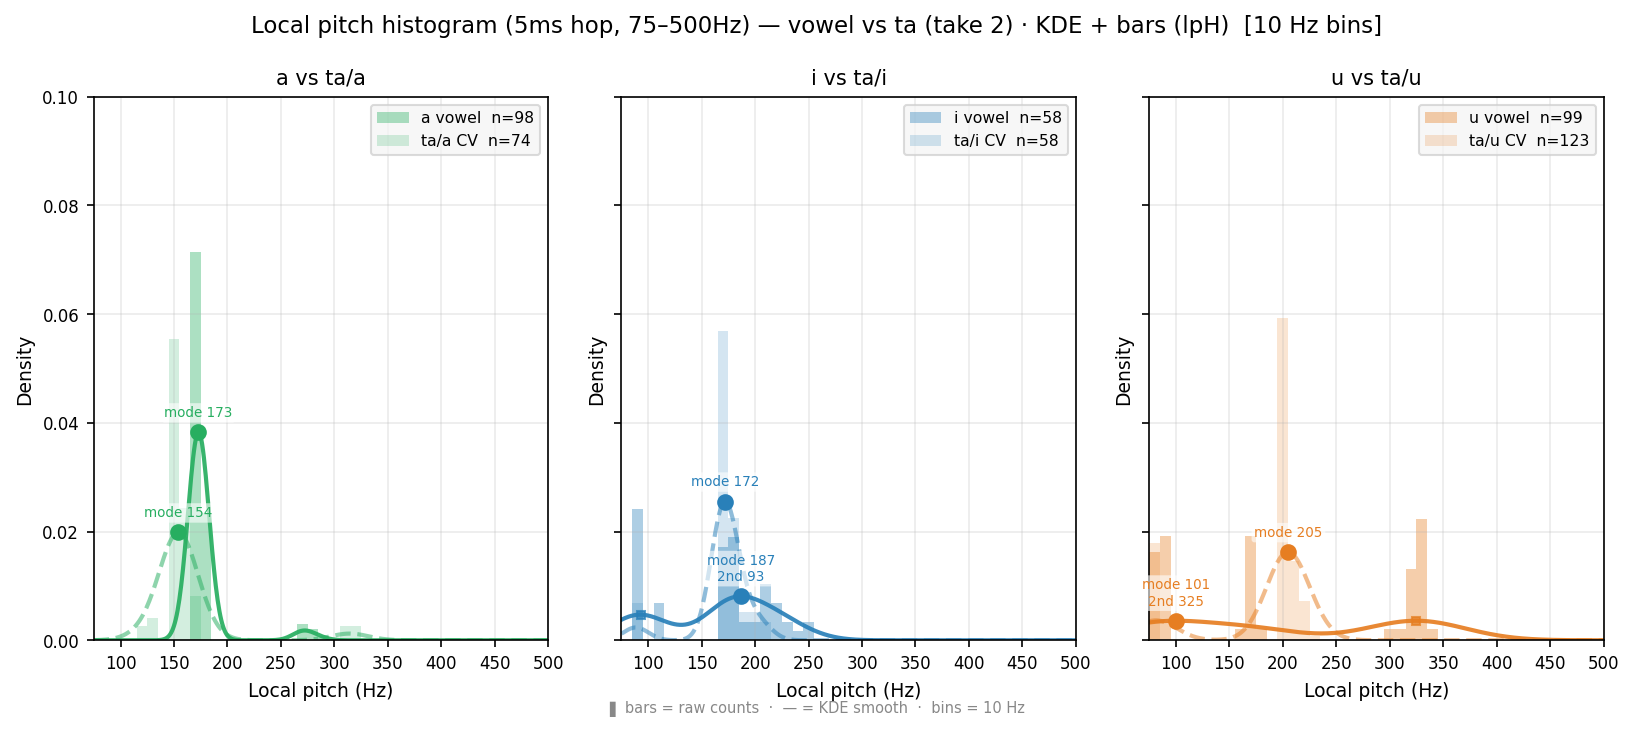
Local pitch (5ms hop, 75–500Hz) histogram — wider range than Pitch/F0 distribution (10ms, 75–300Hz). lpH = alpha bars + KDE smooth: readable peaks, secondary bump visible. lph = raw bars: unsmoothed, honest bin counts. Primary ● and secondary ■ peaks marked on KDE curve (lpH only). Wider X-axis (to 500Hz) may reveal F1 leakage for /i/ /u/ above 300Hz. Compare with Pitch/F0 distribution below for time-step and frequency-range effect.
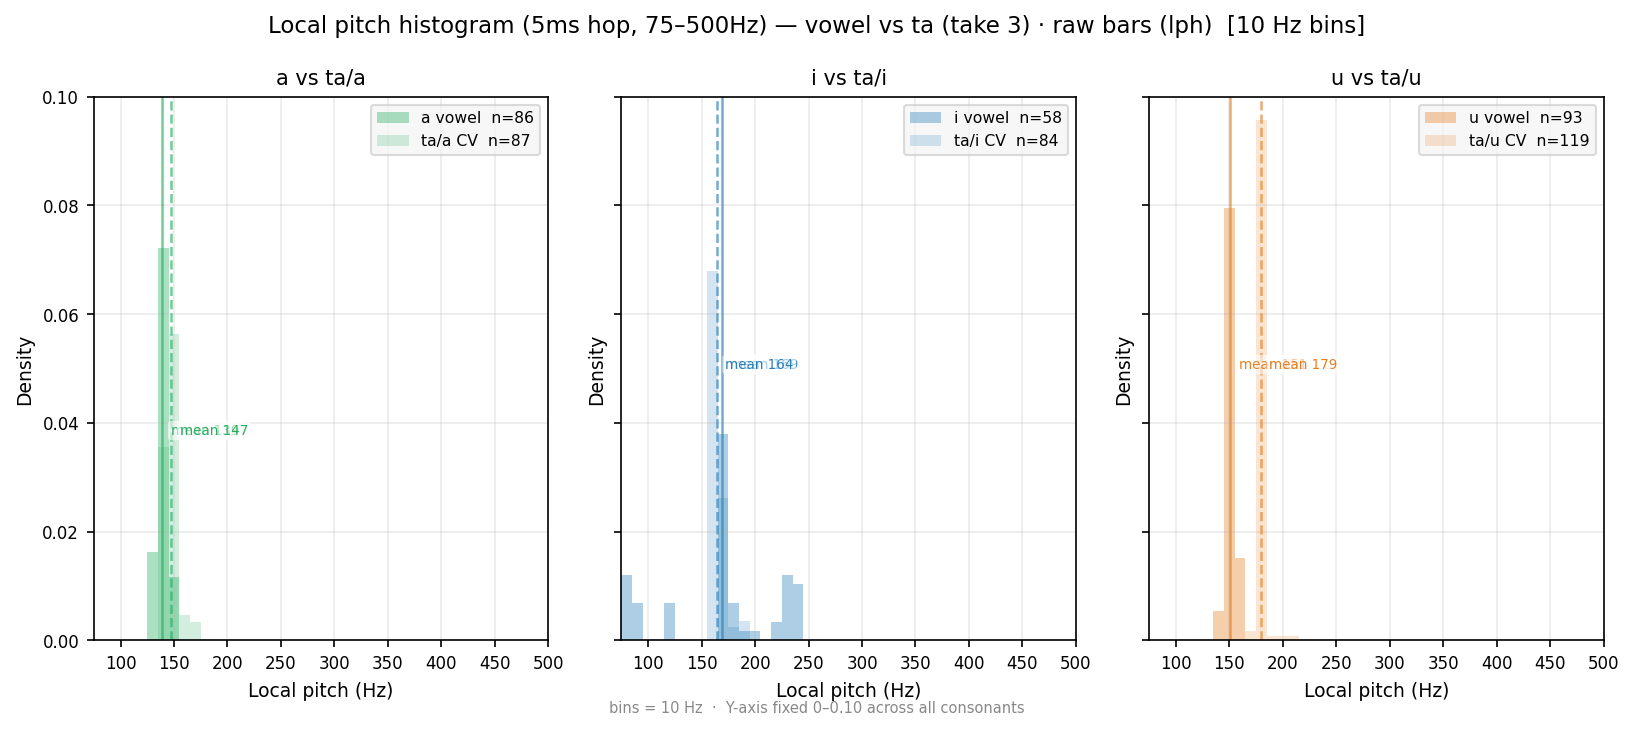
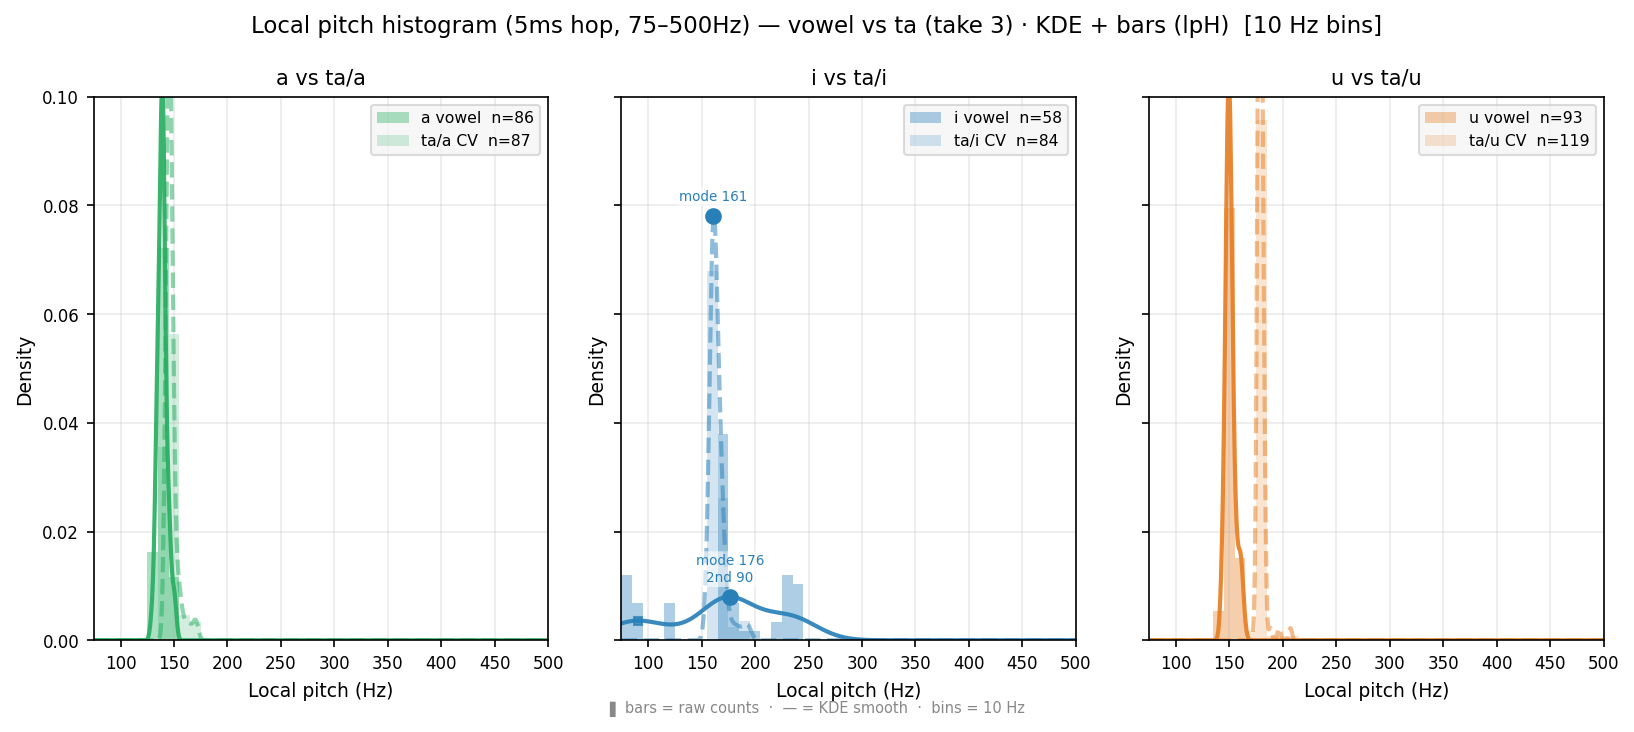
Local pitch (5ms hop, 75–500Hz) histogram — wider range than Pitch/F0 distribution (10ms, 75–300Hz). lpH = alpha bars + KDE smooth: readable peaks, secondary bump visible. lph = raw bars: unsmoothed, honest bin counts. Primary ● and secondary ■ peaks marked on KDE curve (lpH only). Wider X-axis (to 500Hz) may reveal F1 leakage for /i/ /u/ above 300Hz. Compare with Pitch/F0 distribution below for time-step and frequency-range effect.
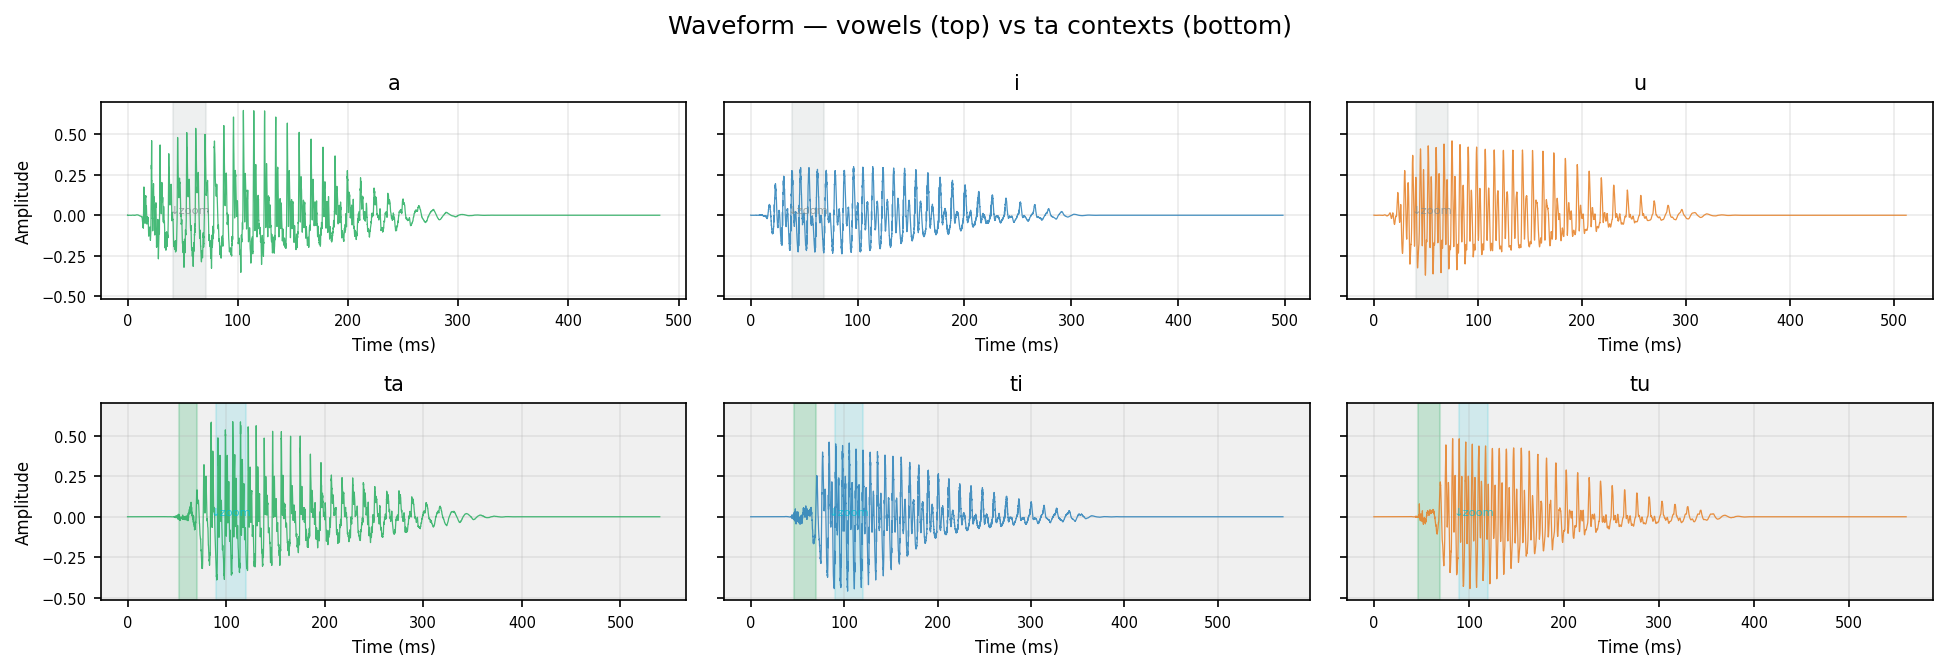
Green shading on CV waveforms = detected burst window (speech onset → first Praat-voiced frame).
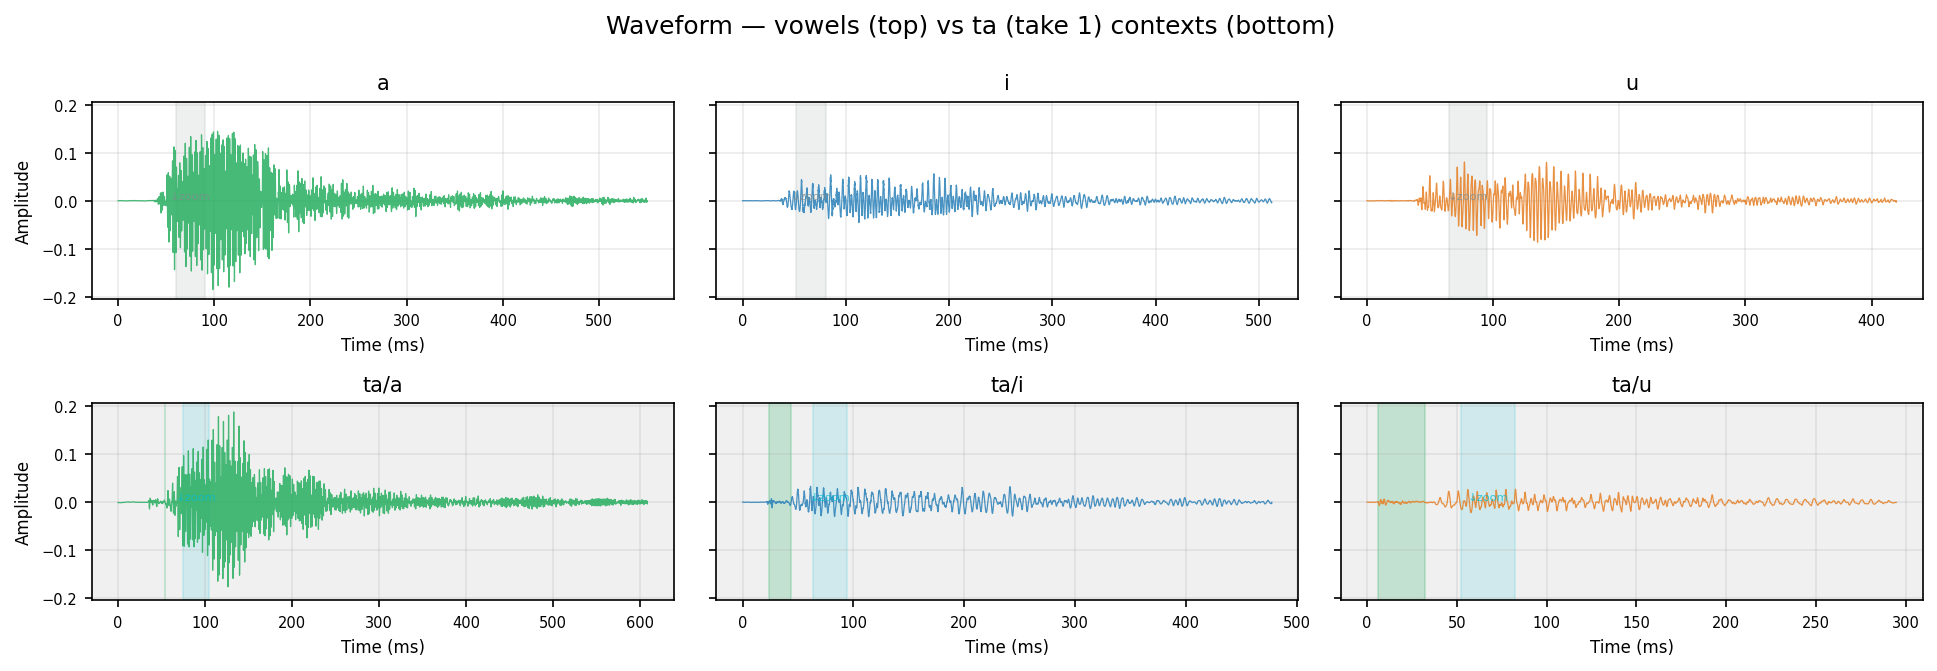
Human take 1
Green shading on CV waveforms = detected burst window (speech onset → first Praat-voiced frame).
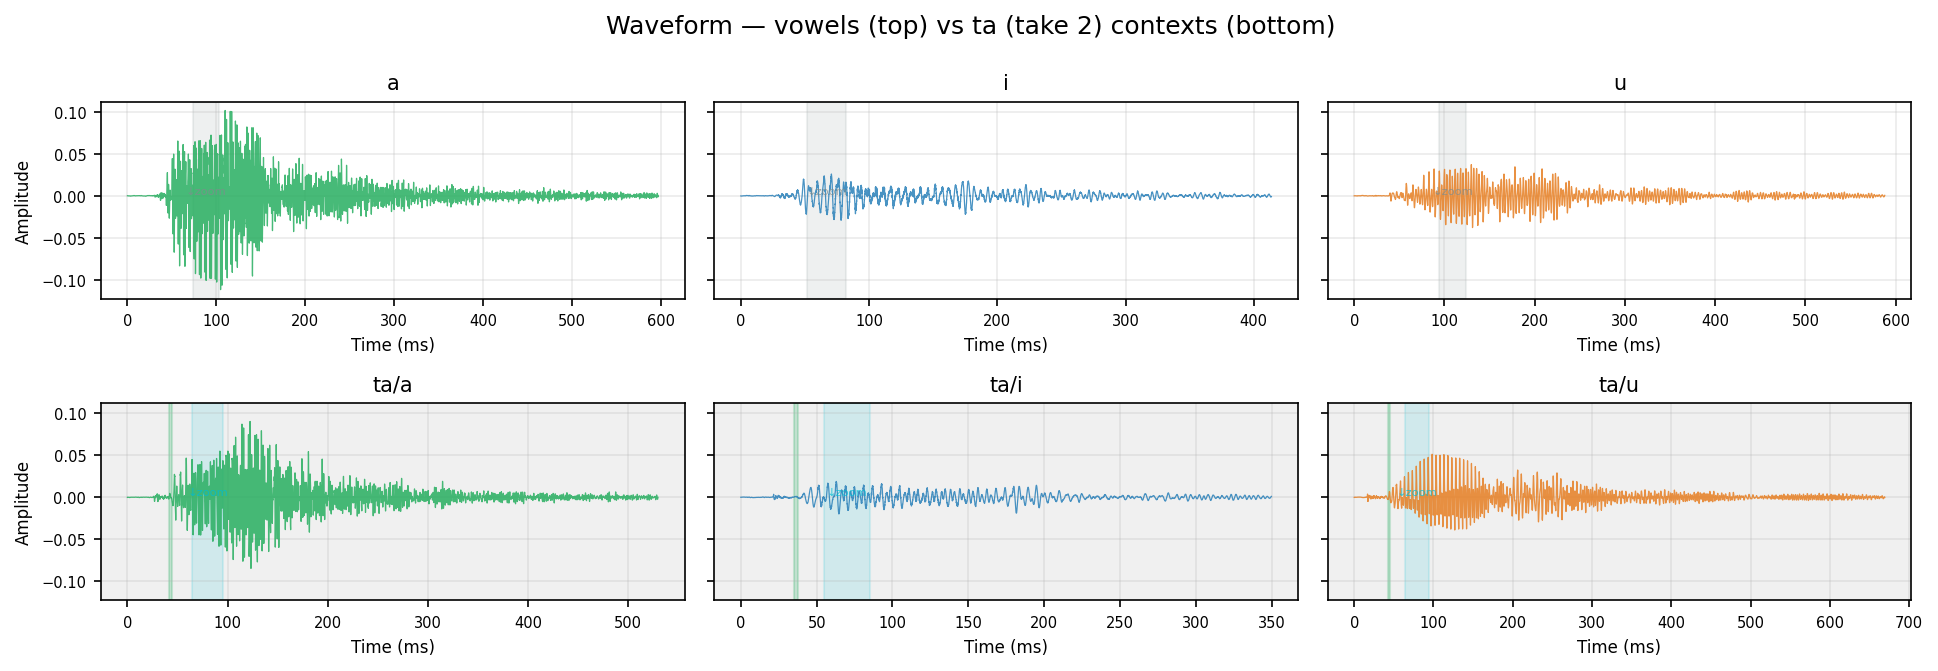
Human take 2
Green shading on CV waveforms = detected burst window (speech onset → first Praat-voiced frame).
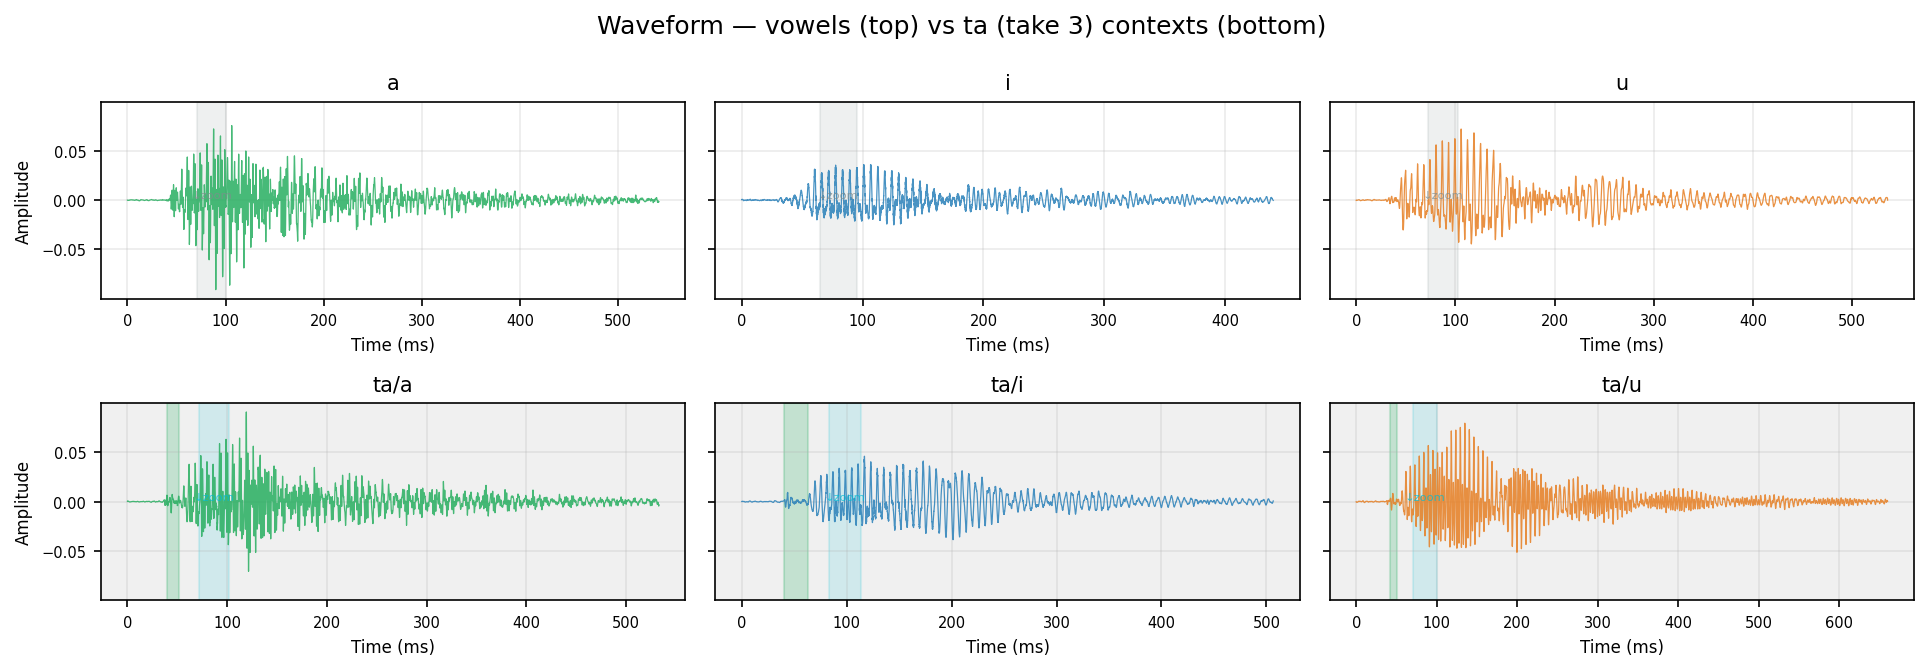
Human take 3
Green shading on CV waveforms = detected burst window (speech onset → first Praat-voiced frame).
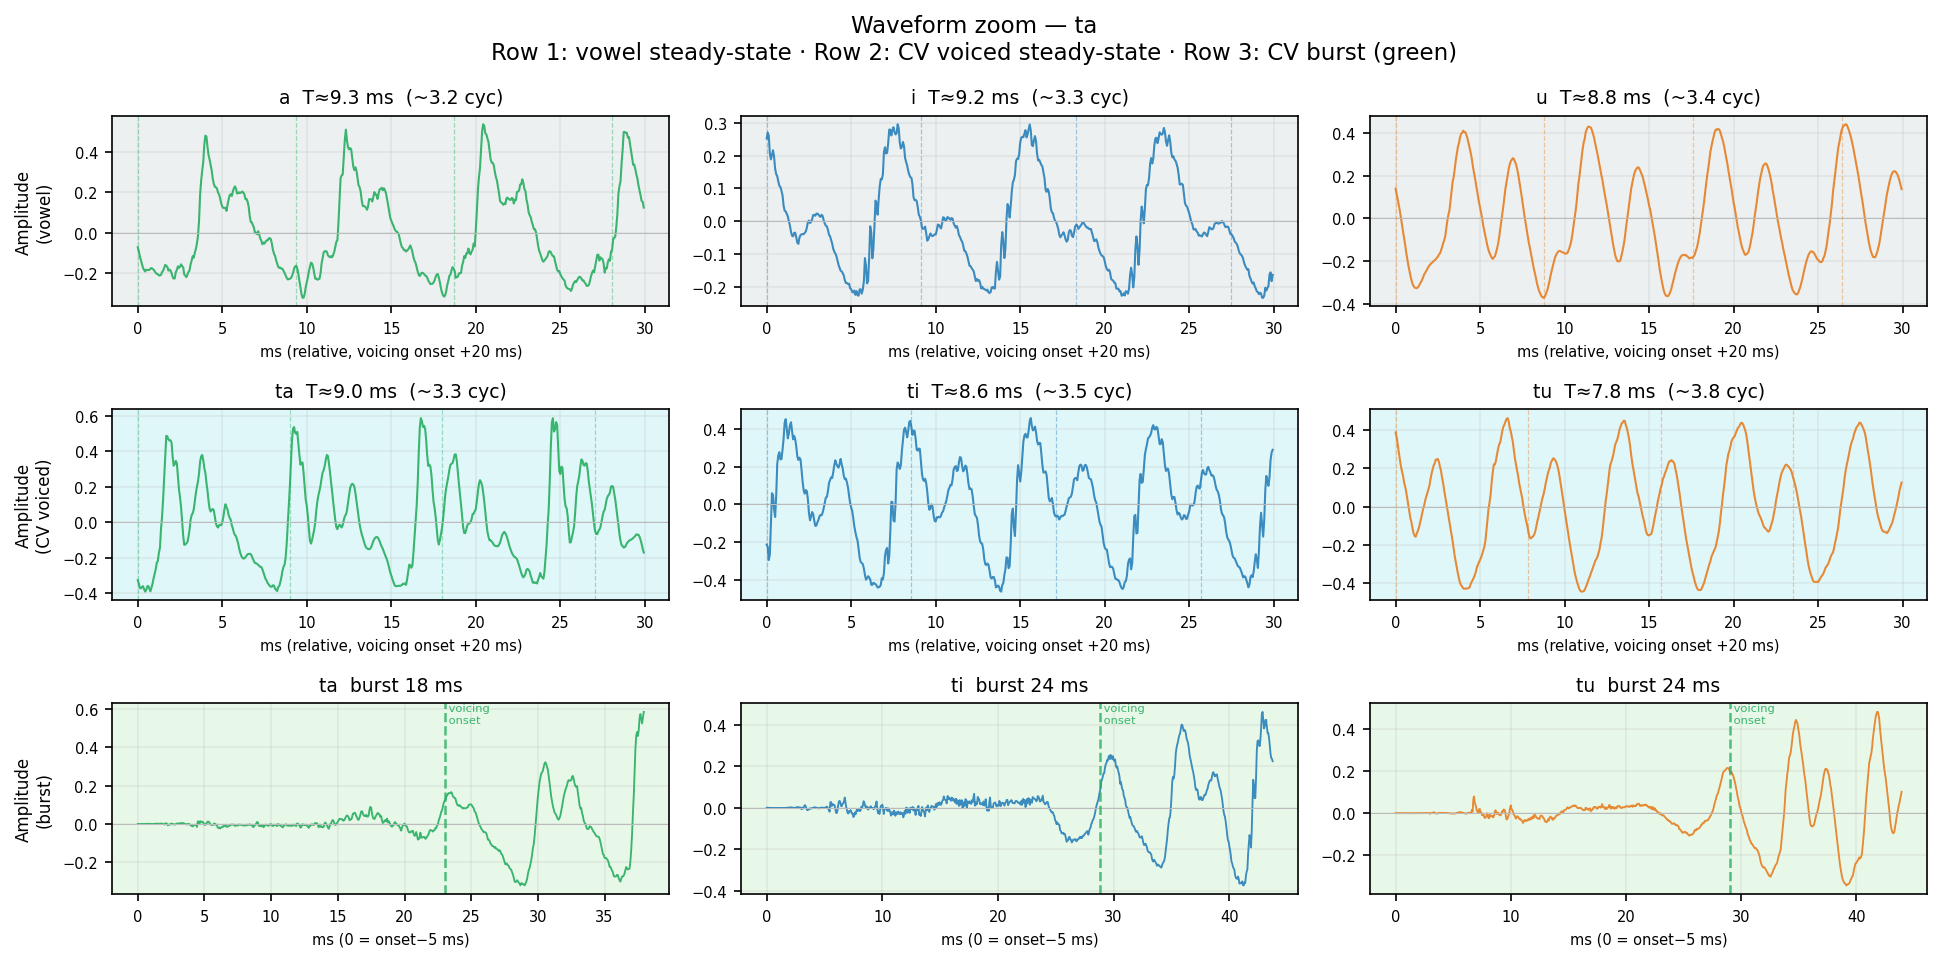
Row 1 (gray): Pure vowel steady-state — 30 ms, 20 ms after voicing onset. Row 2 (cyan): CV voiced steady-state — same window, shows vowel after consonant release. Row 3 (green): CV burst — aperiodic noise from stop release → transition to voicing (green dashed line = first voiced frame). Burst shape and duration differ by place of articulation. Dashed verticals in rows 1–2 = expected glottal period T = 1/F0. Waveform complexity = harmonic richness (pure sine = single harmonic; jagged = rich harmonics).
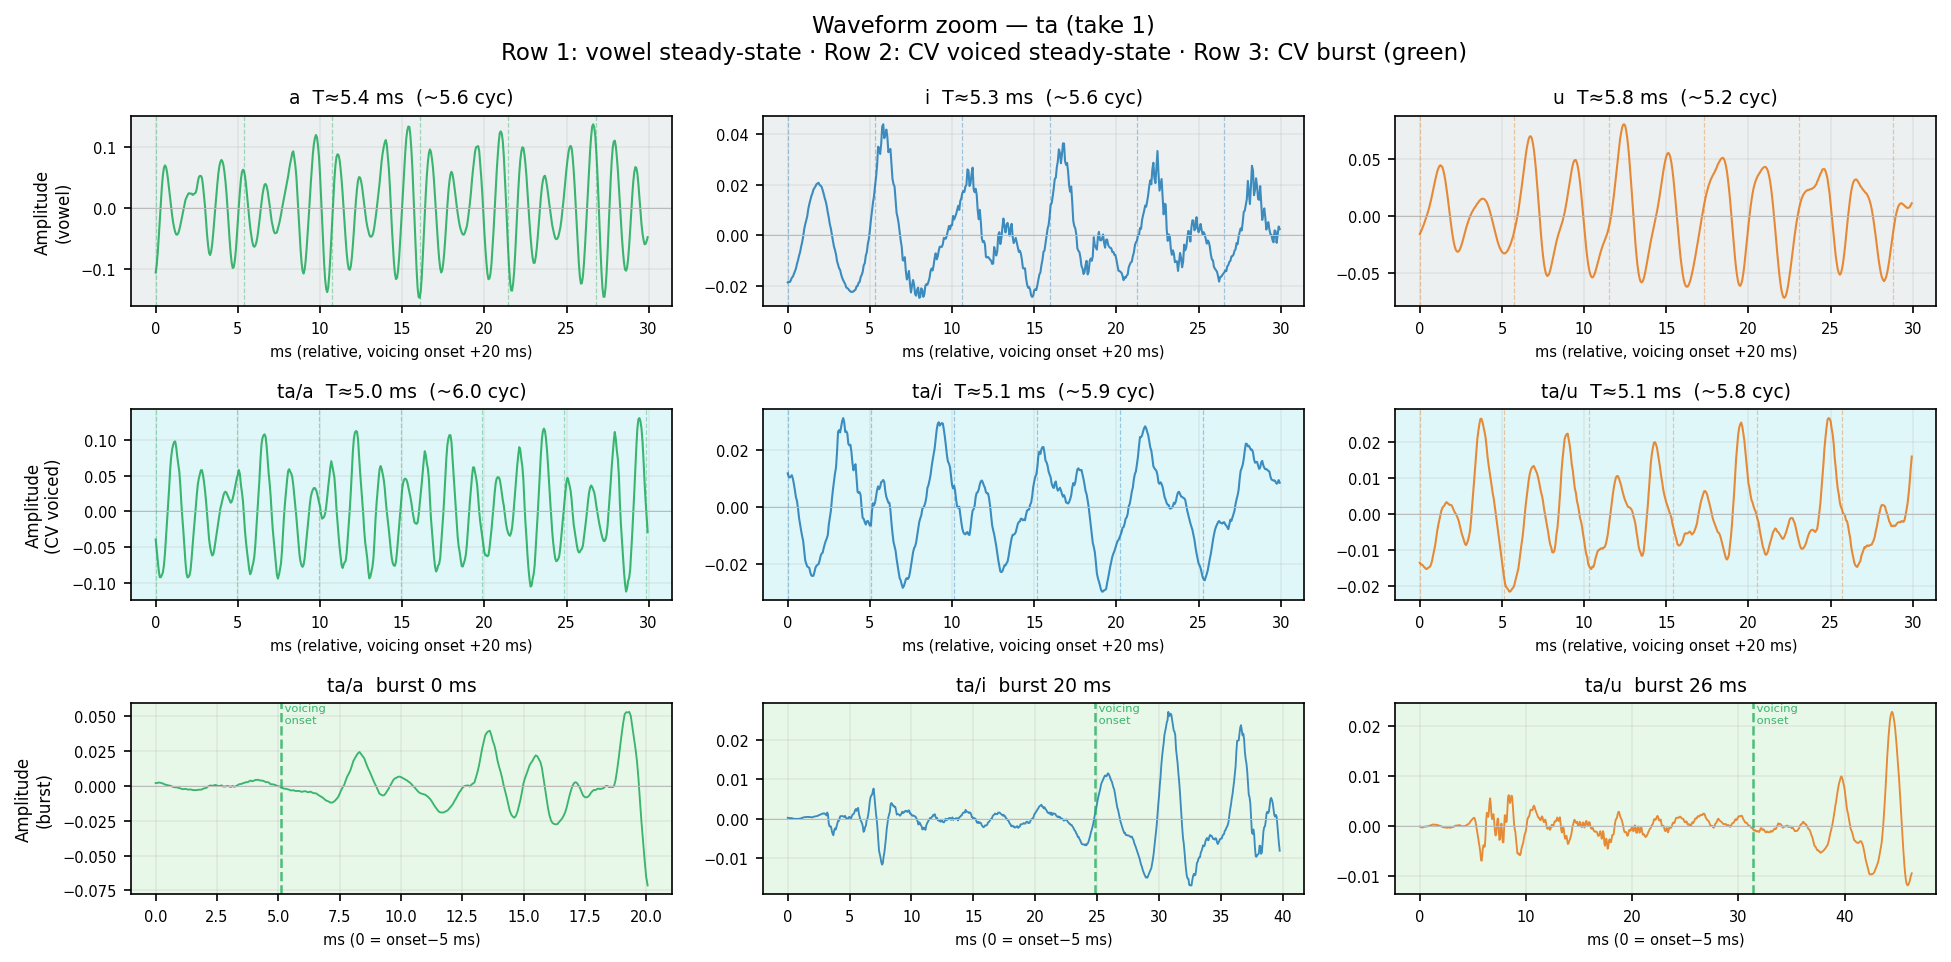
Human take 1
Row 1 (gray): Pure vowel steady-state — 30 ms, 20 ms after voicing onset. Row 2 (cyan): CV voiced steady-state — same window, shows vowel after consonant release. Row 3 (green): CV burst — aperiodic noise from stop release → transition to voicing (green dashed line = first voiced frame). Burst shape and duration differ by place of articulation. Dashed verticals in rows 1–2 = expected glottal period T = 1/F0. Waveform complexity = harmonic richness (pure sine = single harmonic; jagged = rich harmonics).
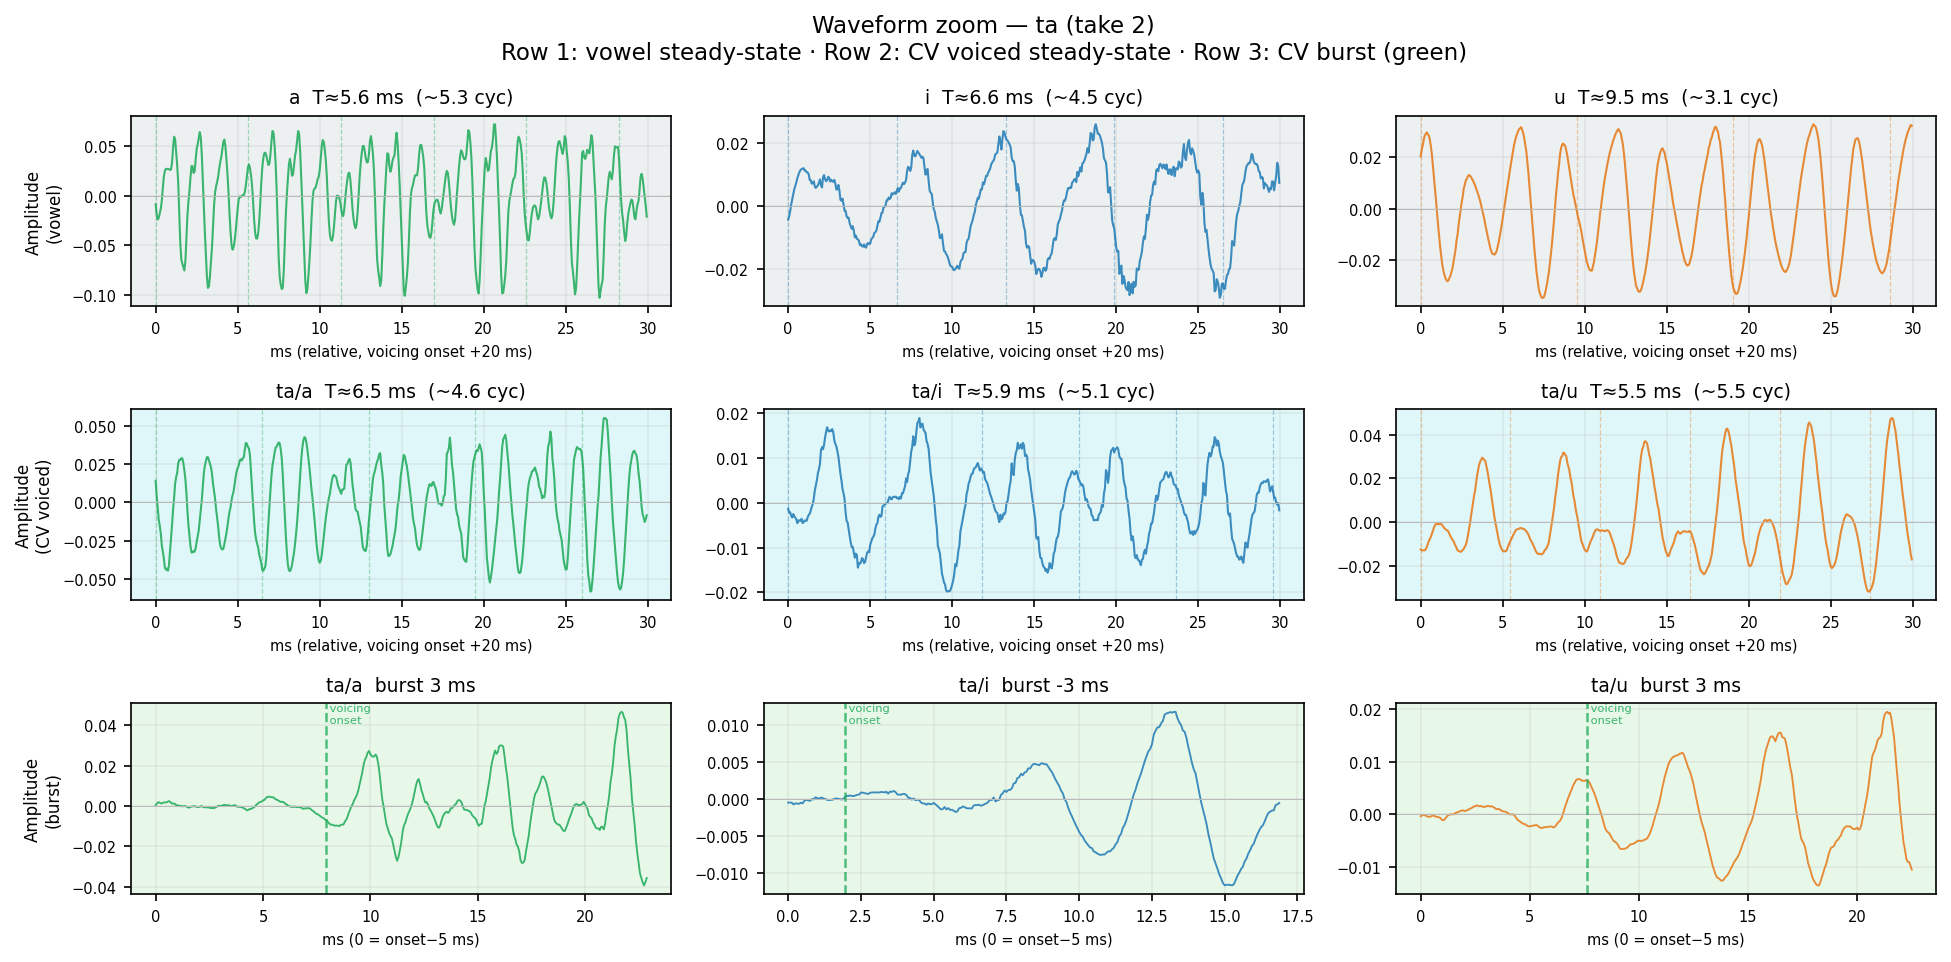
Human take 2
Row 1 (gray): Pure vowel steady-state — 30 ms, 20 ms after voicing onset. Row 2 (cyan): CV voiced steady-state — same window, shows vowel after consonant release. Row 3 (green): CV burst — aperiodic noise from stop release → transition to voicing (green dashed line = first voiced frame). Burst shape and duration differ by place of articulation. Dashed verticals in rows 1–2 = expected glottal period T = 1/F0. Waveform complexity = harmonic richness (pure sine = single harmonic; jagged = rich harmonics).
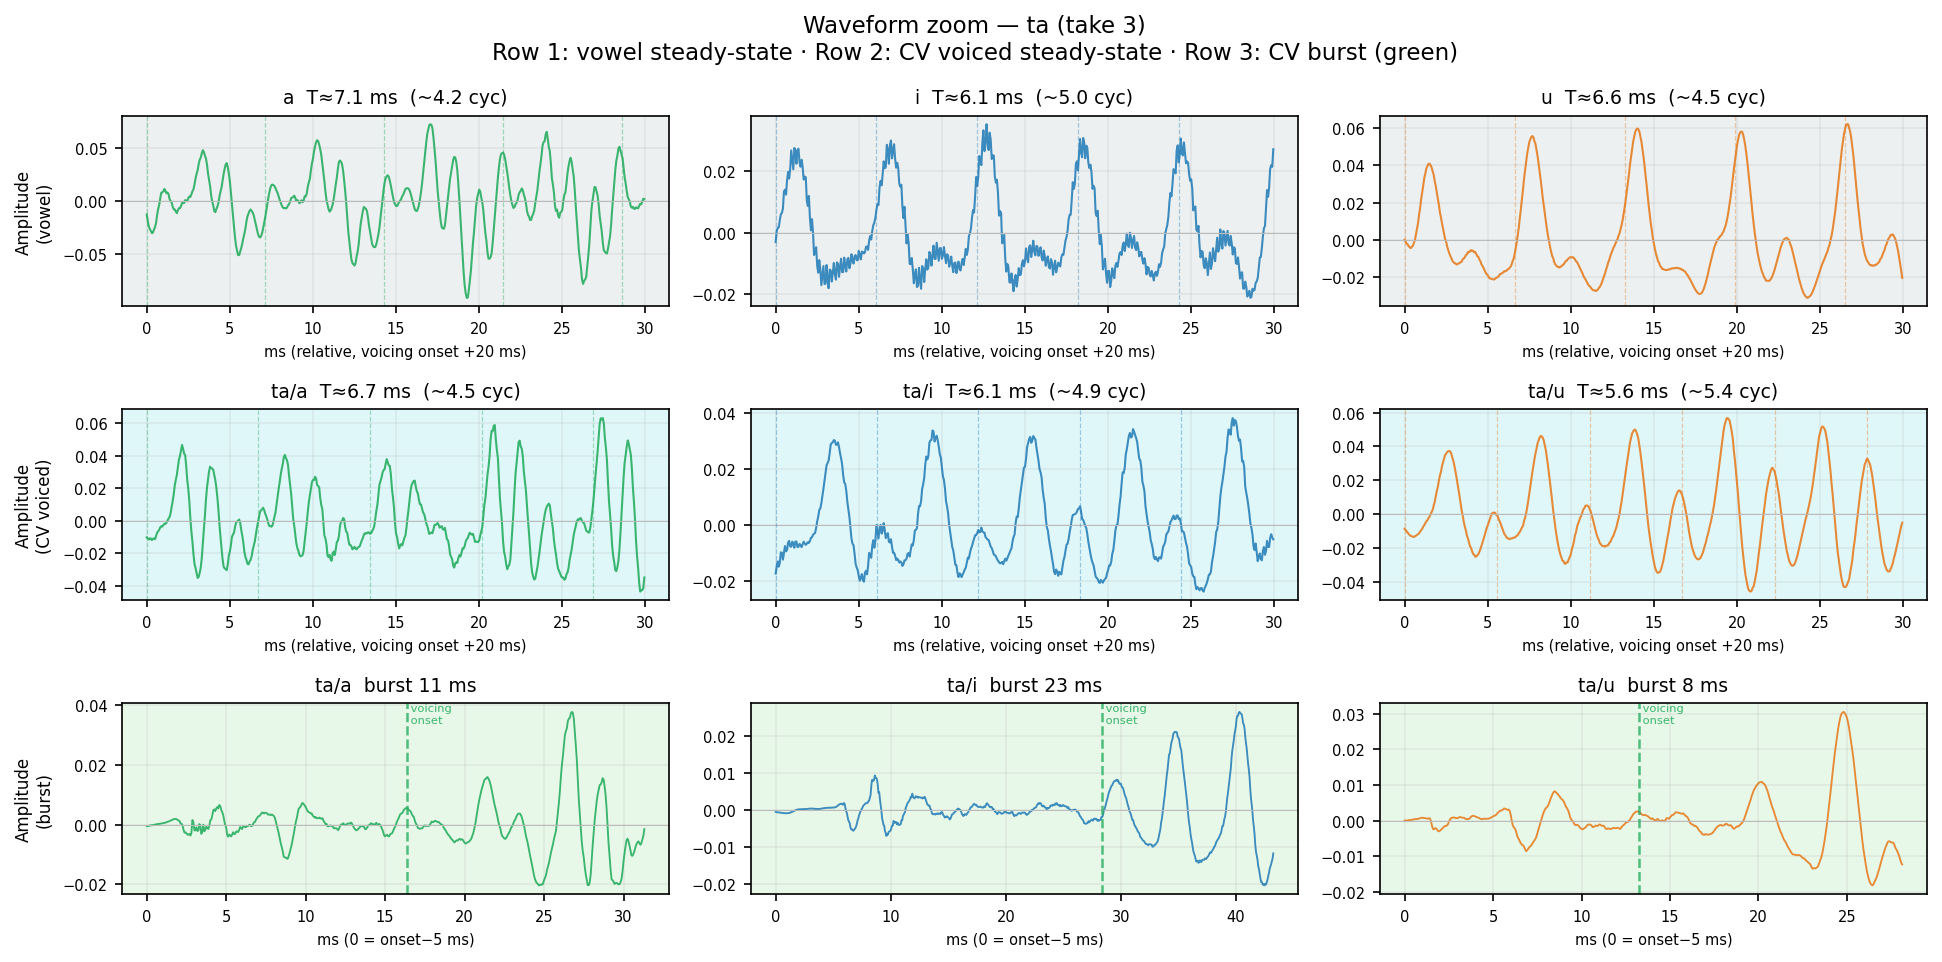
Human take 3
Row 1 (gray): Pure vowel steady-state — 30 ms, 20 ms after voicing onset. Row 2 (cyan): CV voiced steady-state — same window, shows vowel after consonant release. Row 3 (green): CV burst — aperiodic noise from stop release → transition to voicing (green dashed line = first voiced frame). Burst shape and duration differ by place of articulation. Dashed verticals in rows 1–2 = expected glottal period T = 1/F0. Waveform complexity = harmonic richness (pure sine = single harmonic; jagged = rich harmonics).
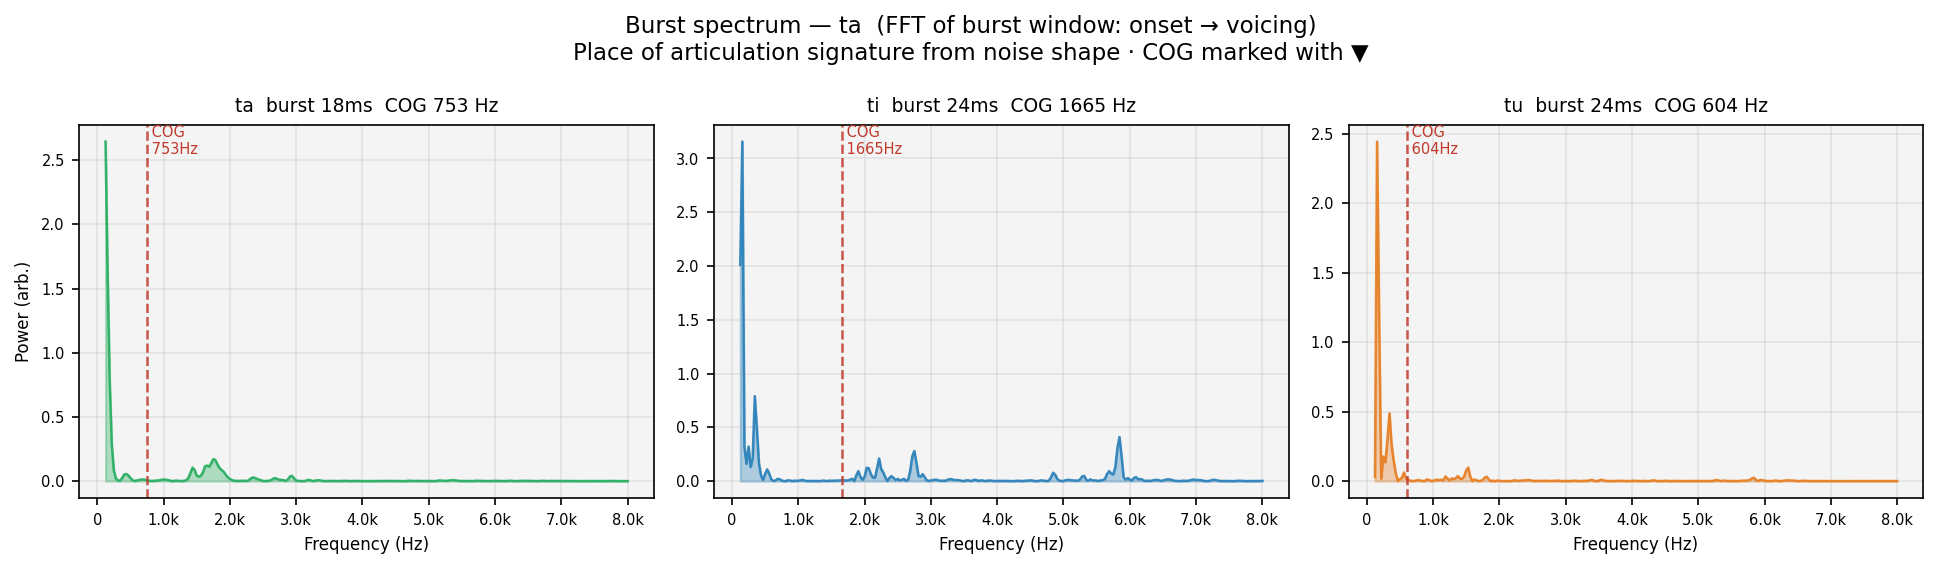
FFT of the aperiodic burst window (speech onset → first voiced frame) for each vowel context. Spectral centre of gravity (COG, red dashed) marks the dominant noise frequency — a place-of-articulation signature independent of the vowel. Velars peak mid-frequency (~1–2 kHz); dentals/alveolars peak high (>3 kHz); labials are spectrally flat. COG should be consistent across /a/i/u/ for the same consonant — vowel context should not change where the burst energy is.
Human take 1
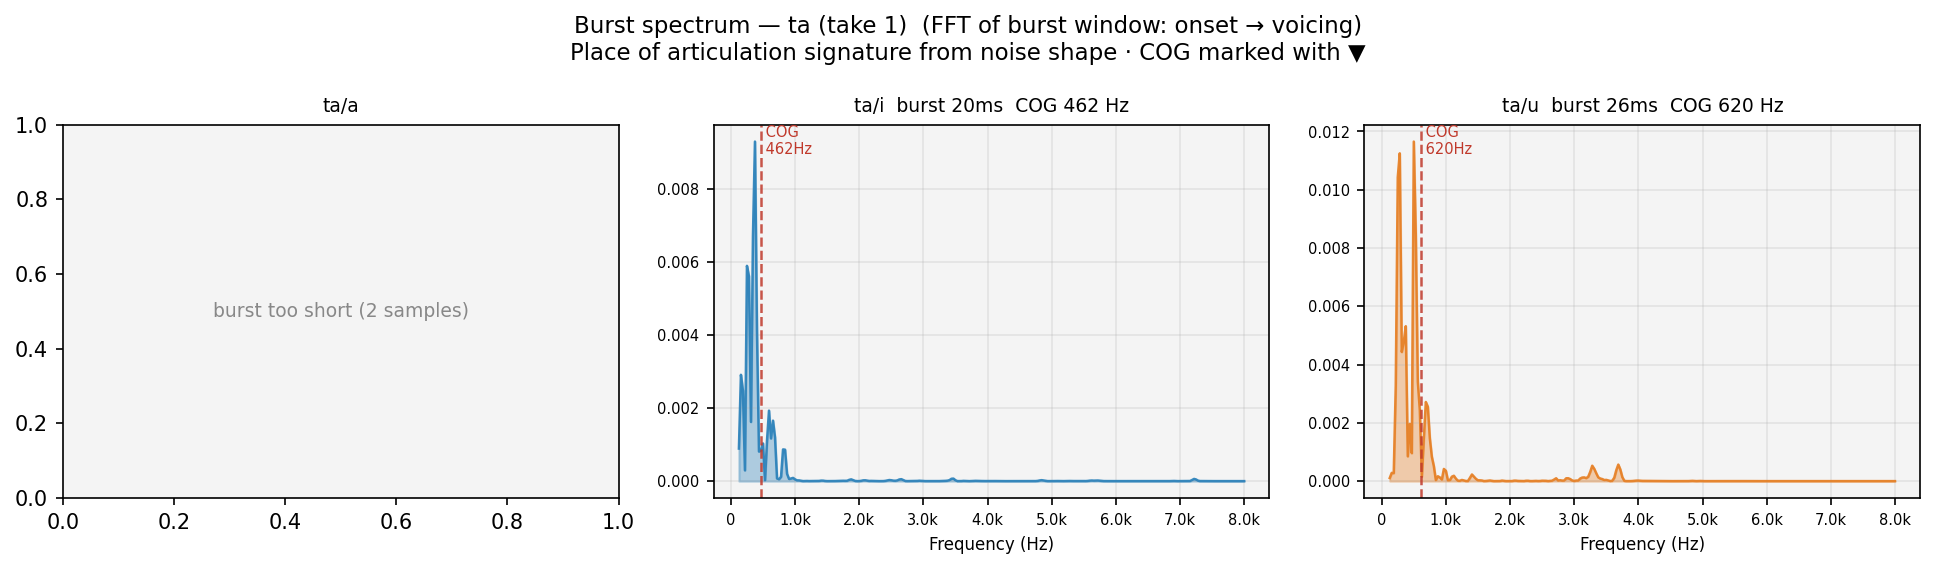
FFT of the aperiodic burst window (speech onset → first voiced frame) for each vowel context. Spectral centre of gravity (COG, red dashed) marks the dominant noise frequency — a place-of-articulation signature independent of the vowel. Velars peak mid-frequency (~1–2 kHz); dentals/alveolars peak high (>3 kHz); labials are spectrally flat. COG should be consistent across /a/i/u/ for the same consonant — vowel context should not change where the burst energy is.
Human take 2
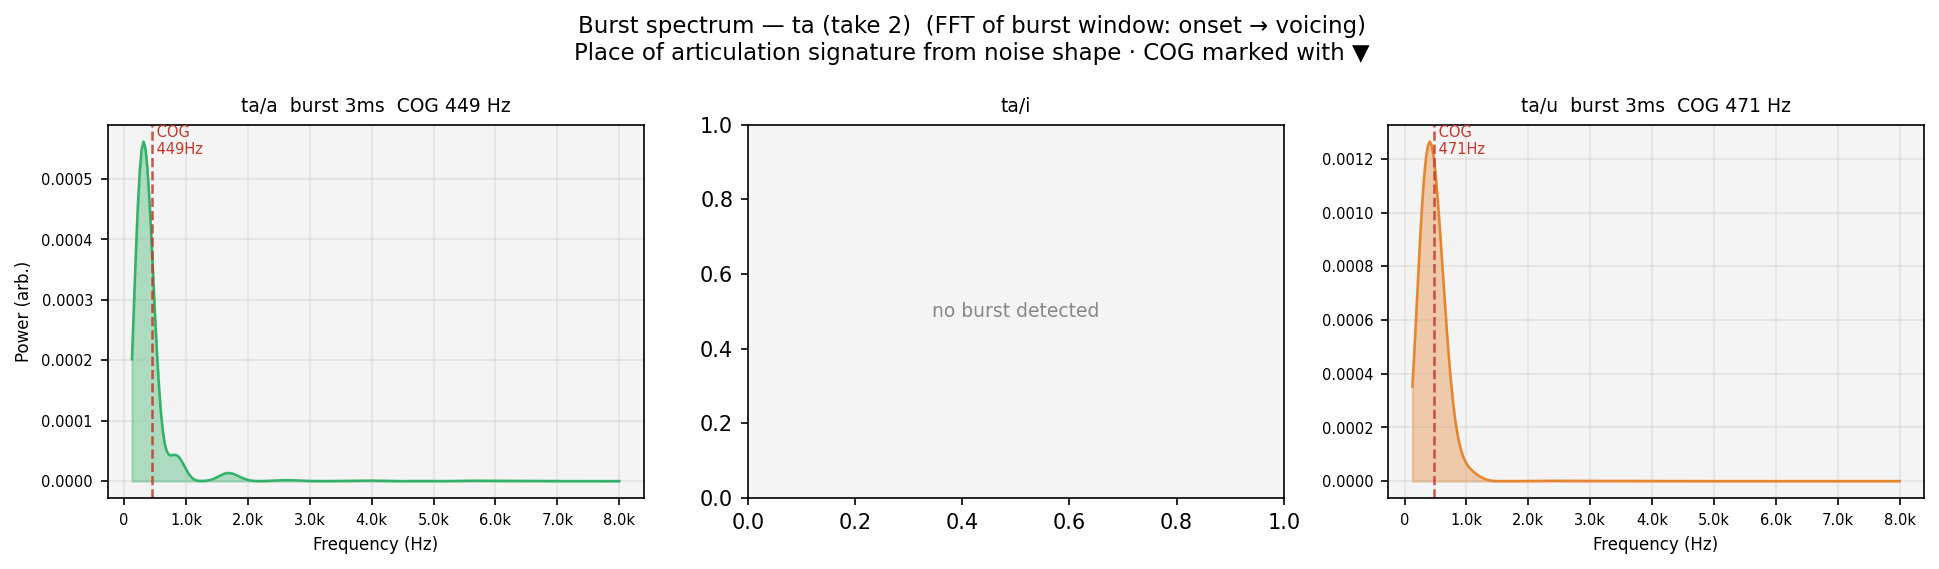
FFT of the aperiodic burst window (speech onset → first voiced frame) for each vowel context. Spectral centre of gravity (COG, red dashed) marks the dominant noise frequency — a place-of-articulation signature independent of the vowel. Velars peak mid-frequency (~1–2 kHz); dentals/alveolars peak high (>3 kHz); labials are spectrally flat. COG should be consistent across /a/i/u/ for the same consonant — vowel context should not change where the burst energy is.
Human take 3
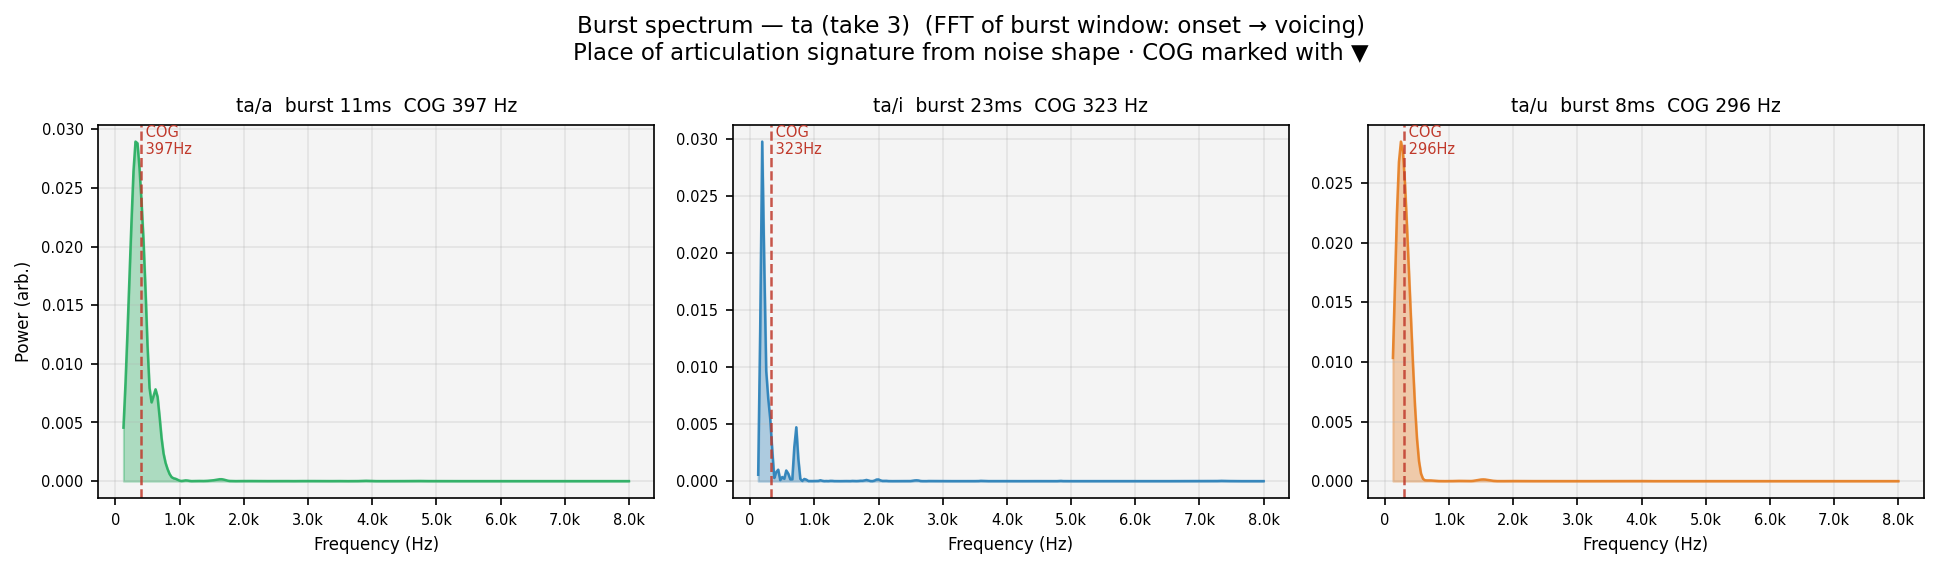
FFT of the aperiodic burst window (speech onset → first voiced frame) for each vowel context. Spectral centre of gravity (COG, red dashed) marks the dominant noise frequency — a place-of-articulation signature independent of the vowel. Velars peak mid-frequency (~1–2 kHz); dentals/alveolars peak high (>3 kHz); labials are spectrally flat. COG should be consistent across /a/i/u/ for the same consonant — vowel context should not change where the burst energy is.
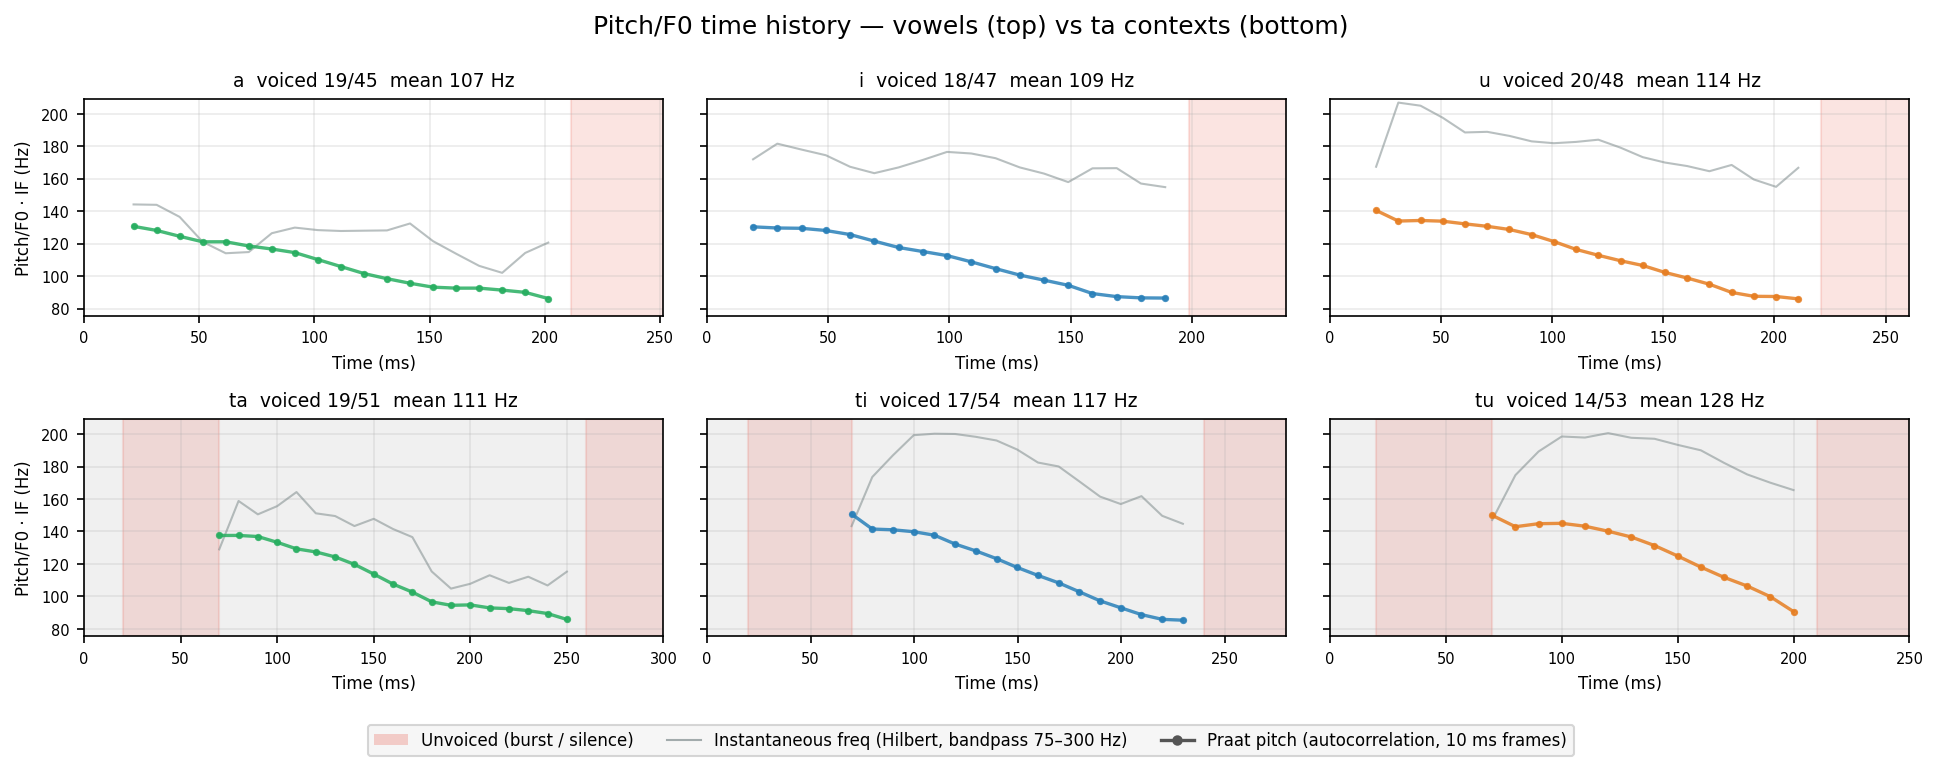
Colored dots = Praat pitch (autocorrelation, 10 ms frames). Gray line = instantaneous frequency (Hilbert transform on 75–300 Hz bandpass). Both show F0 region — IF is noisier; Praat smooths by choosing the most periodic candidate. Red shade = unvoiced (burst / silence).
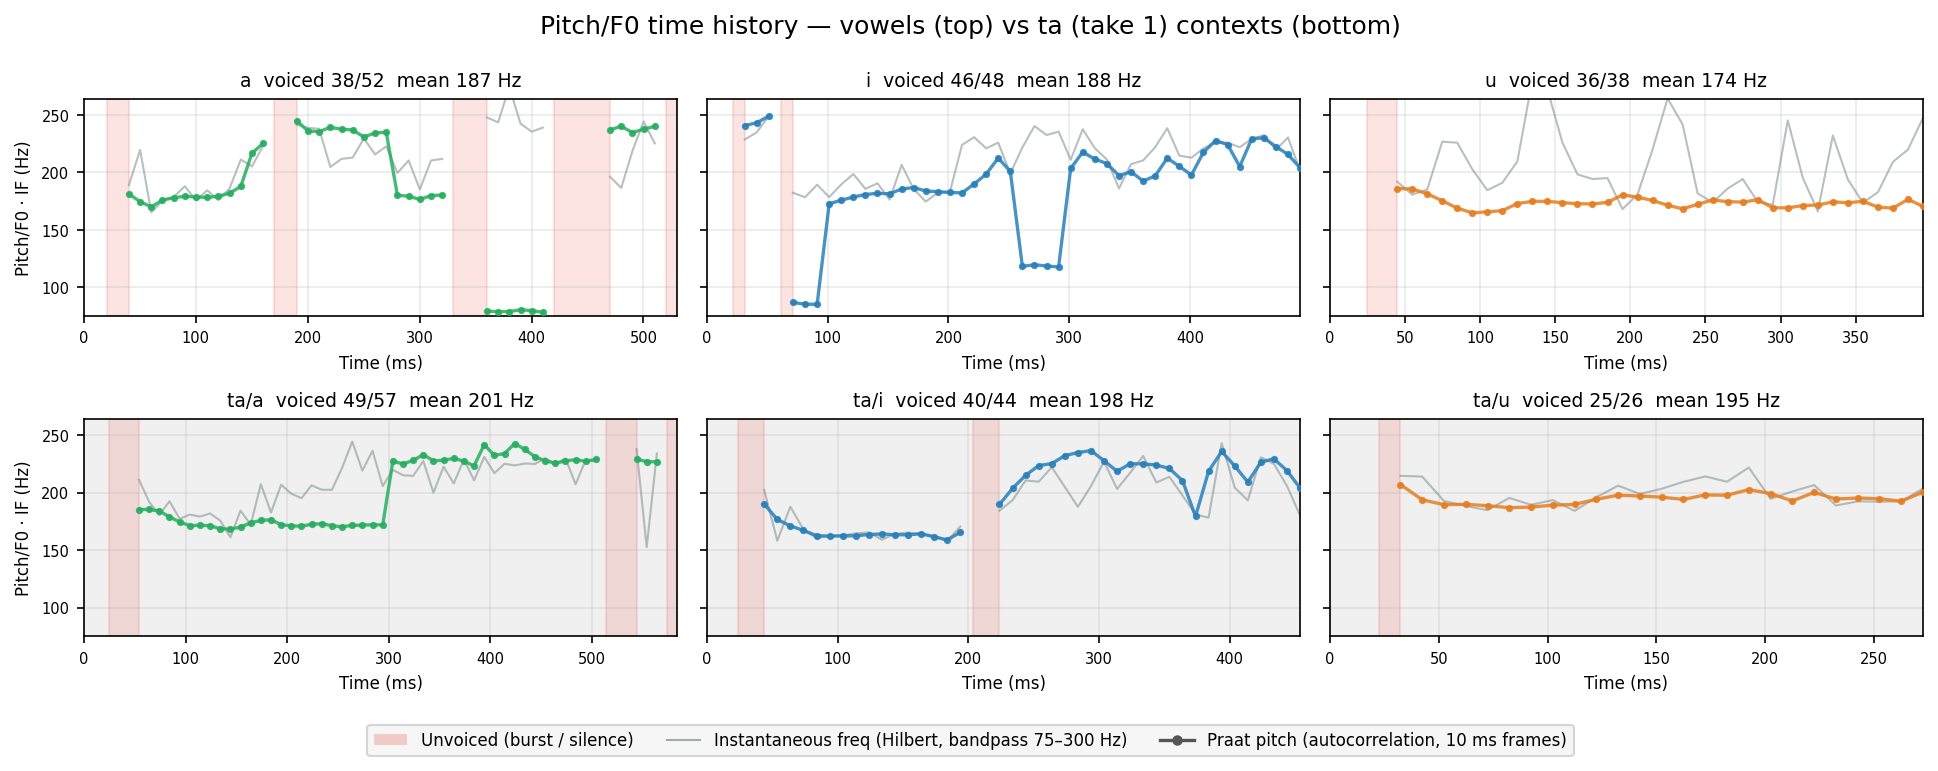
Human take 1
Colored dots = Praat pitch (autocorrelation, 10 ms frames). Gray line = instantaneous frequency (Hilbert transform on 75–300 Hz bandpass). Both show F0 region — IF is noisier; Praat smooths by choosing the most periodic candidate. Red shade = unvoiced (burst / silence).
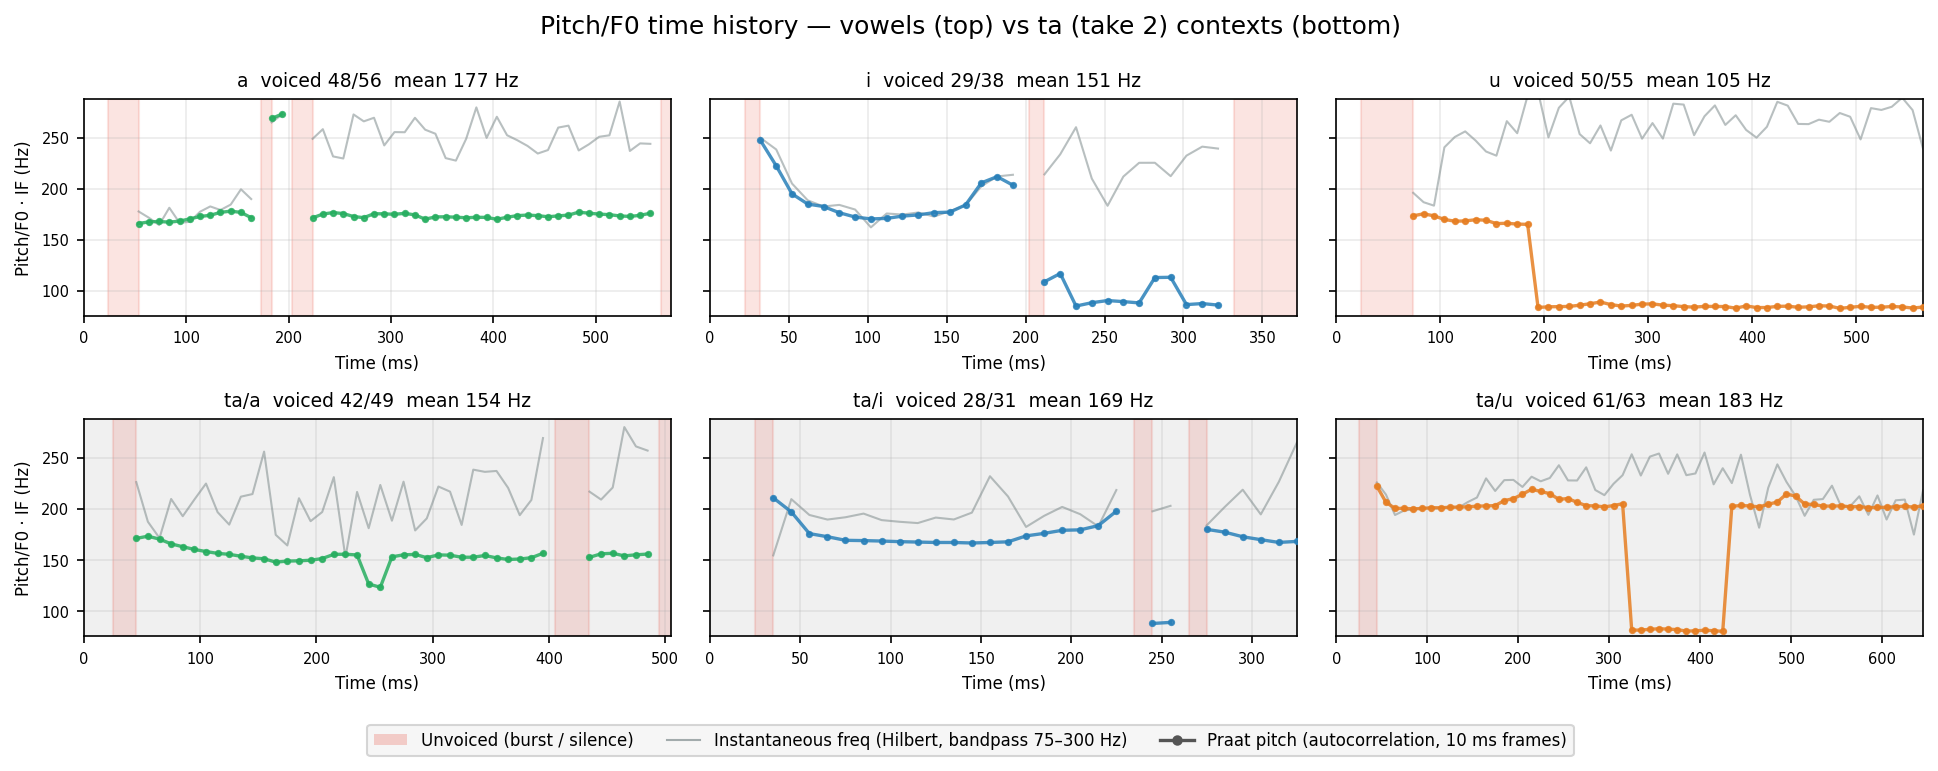
Human take 2
Colored dots = Praat pitch (autocorrelation, 10 ms frames). Gray line = instantaneous frequency (Hilbert transform on 75–300 Hz bandpass). Both show F0 region — IF is noisier; Praat smooths by choosing the most periodic candidate. Red shade = unvoiced (burst / silence).
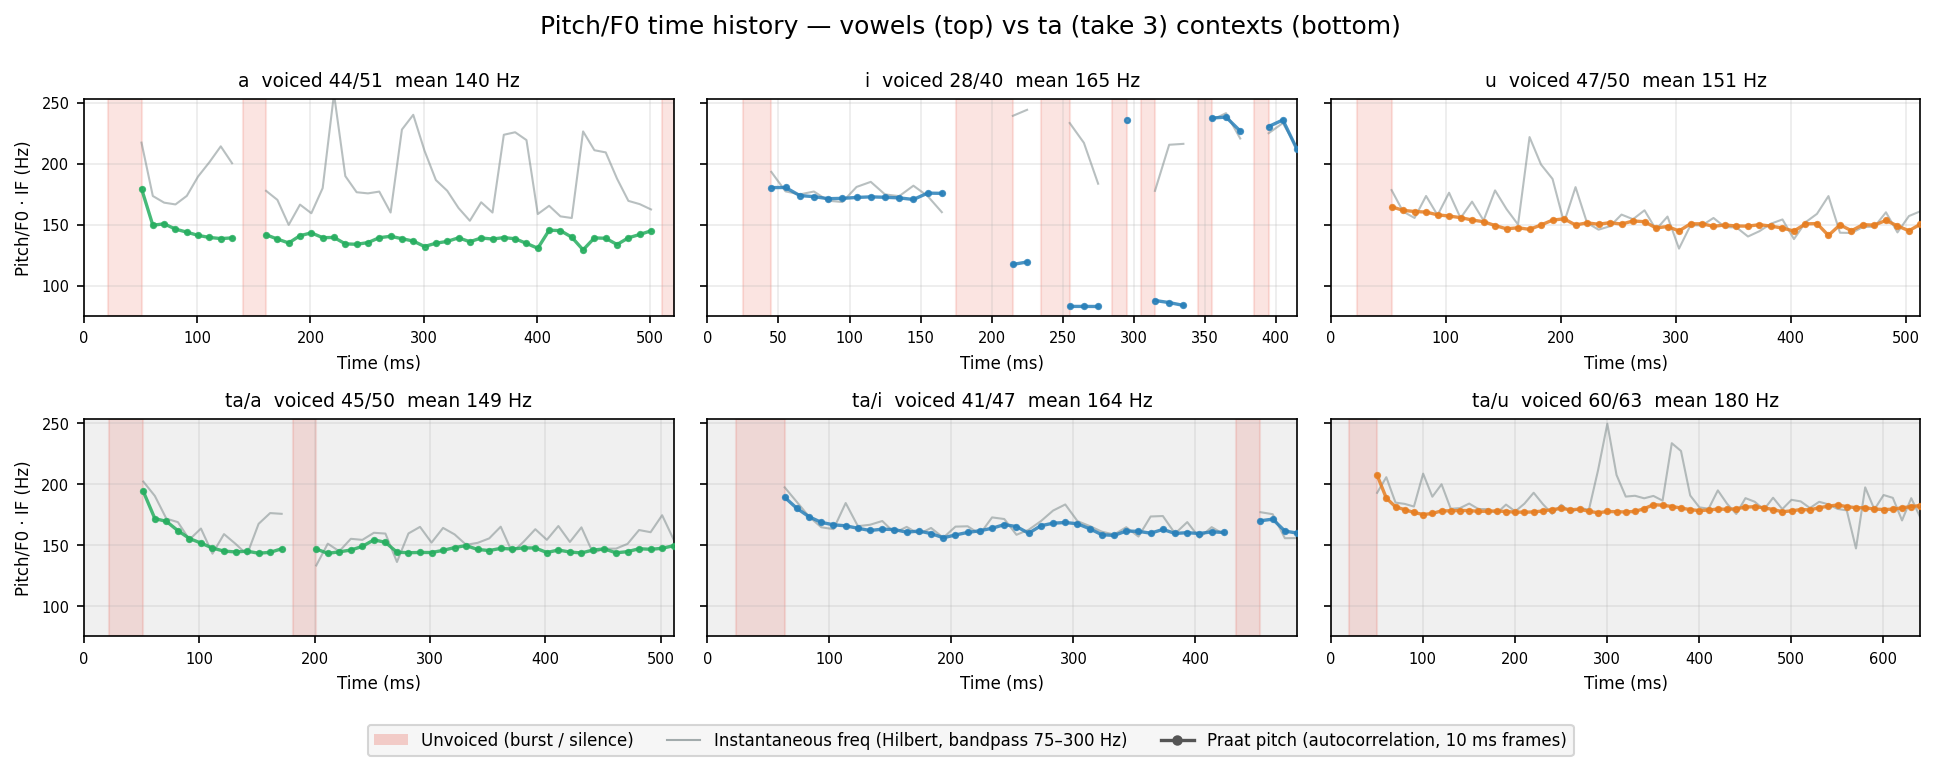
Human take 3
Colored dots = Praat pitch (autocorrelation, 10 ms frames). Gray line = instantaneous frequency (Hilbert transform on 75–300 Hz bandpass). Both show F0 region — IF is noisier; Praat smooths by choosing the most periodic candidate. Red shade = unvoiced (burst / silence).
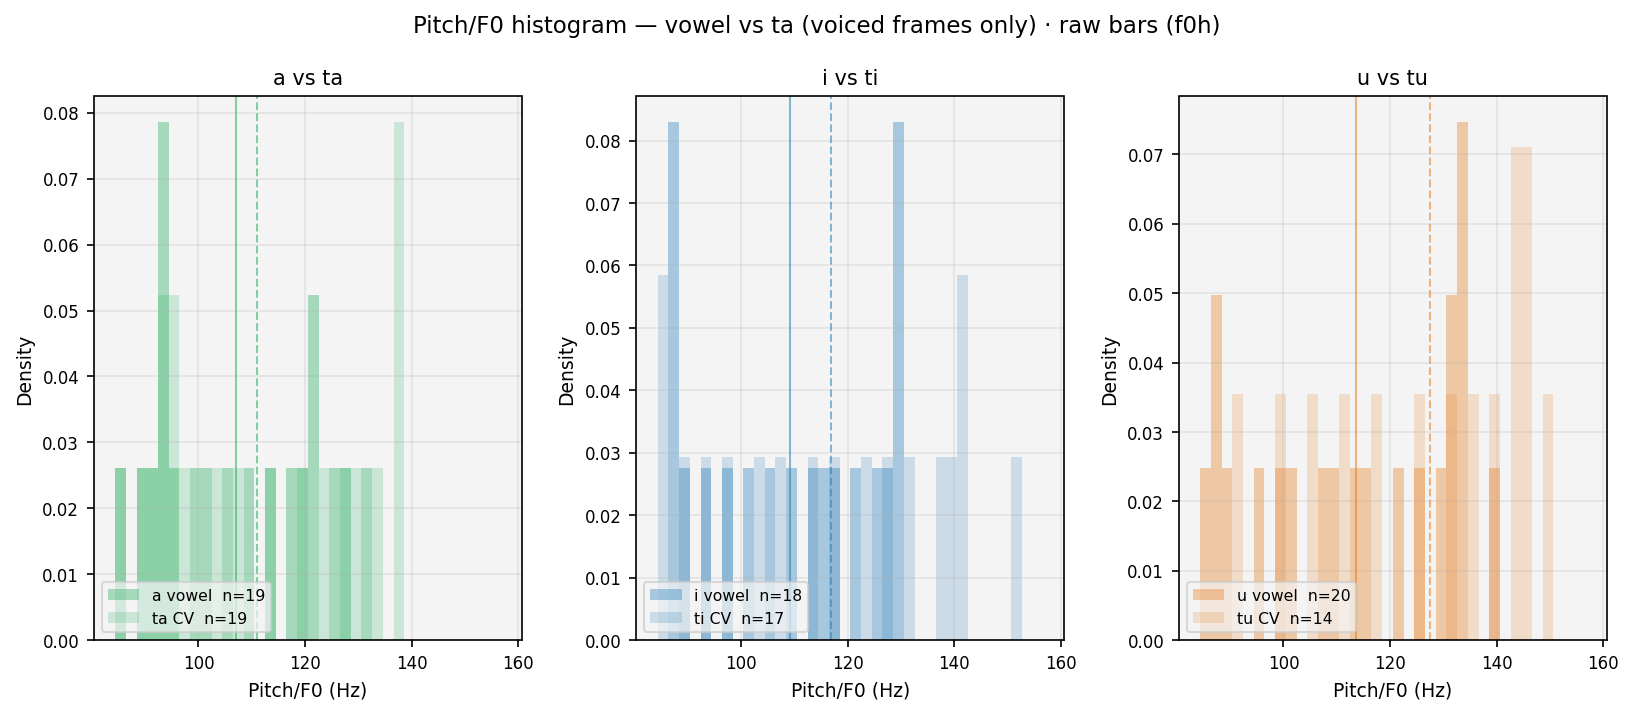
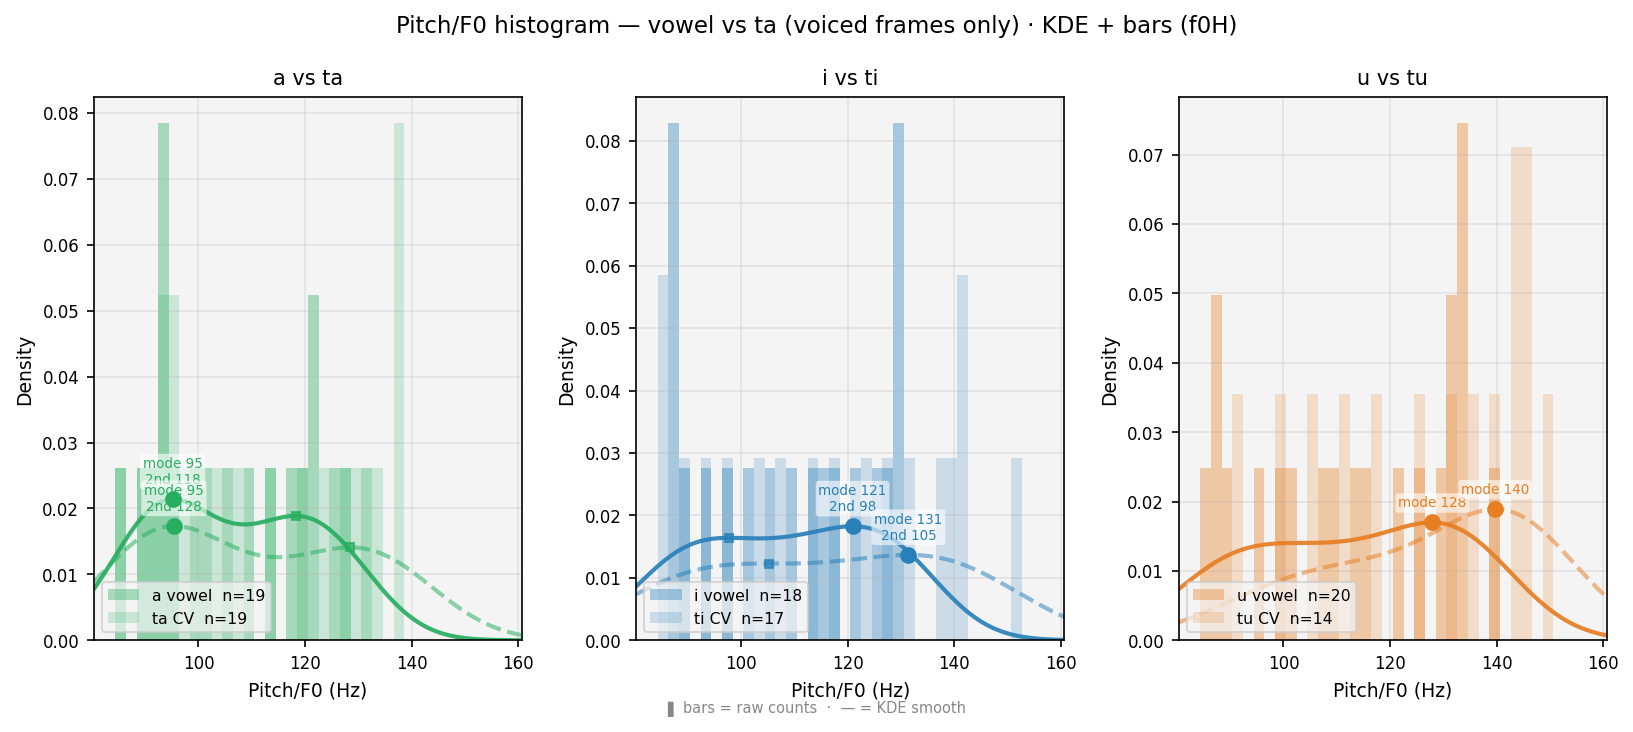
Smoothed histogram (each curve = bars drawn as a continuous line to avoid clutter from overlapping bars). Solid = vowel · Dashed = CV · voiced frames only. ● = primary peak (mode, most frequent pitch). ■ = secondary peak (onset elevation, smaller square). Thin verticals = means. Burst frames absent: voiceless stops produce no vocal-cord vibration — Praat returns NaN, so those frames never enter this plot.
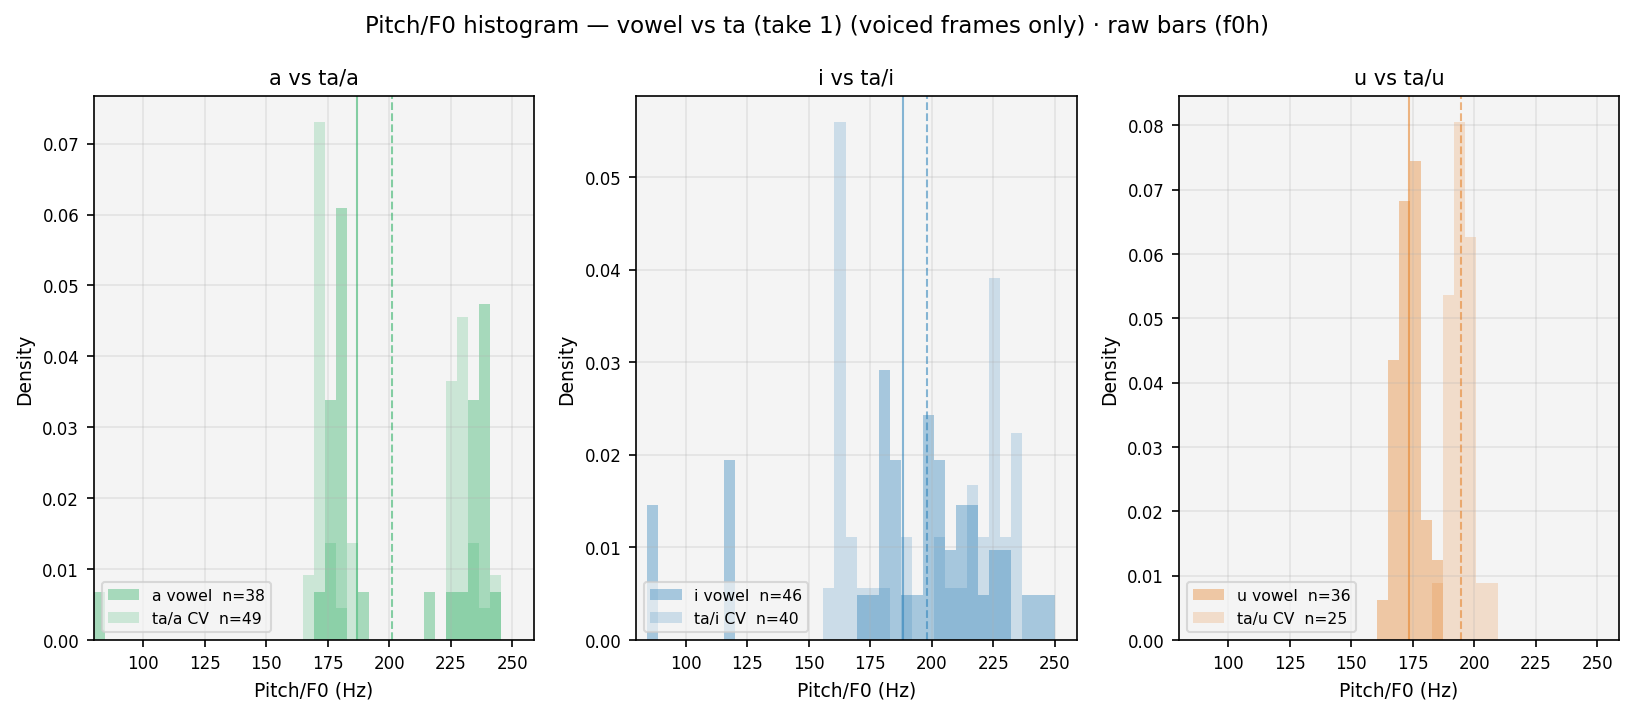
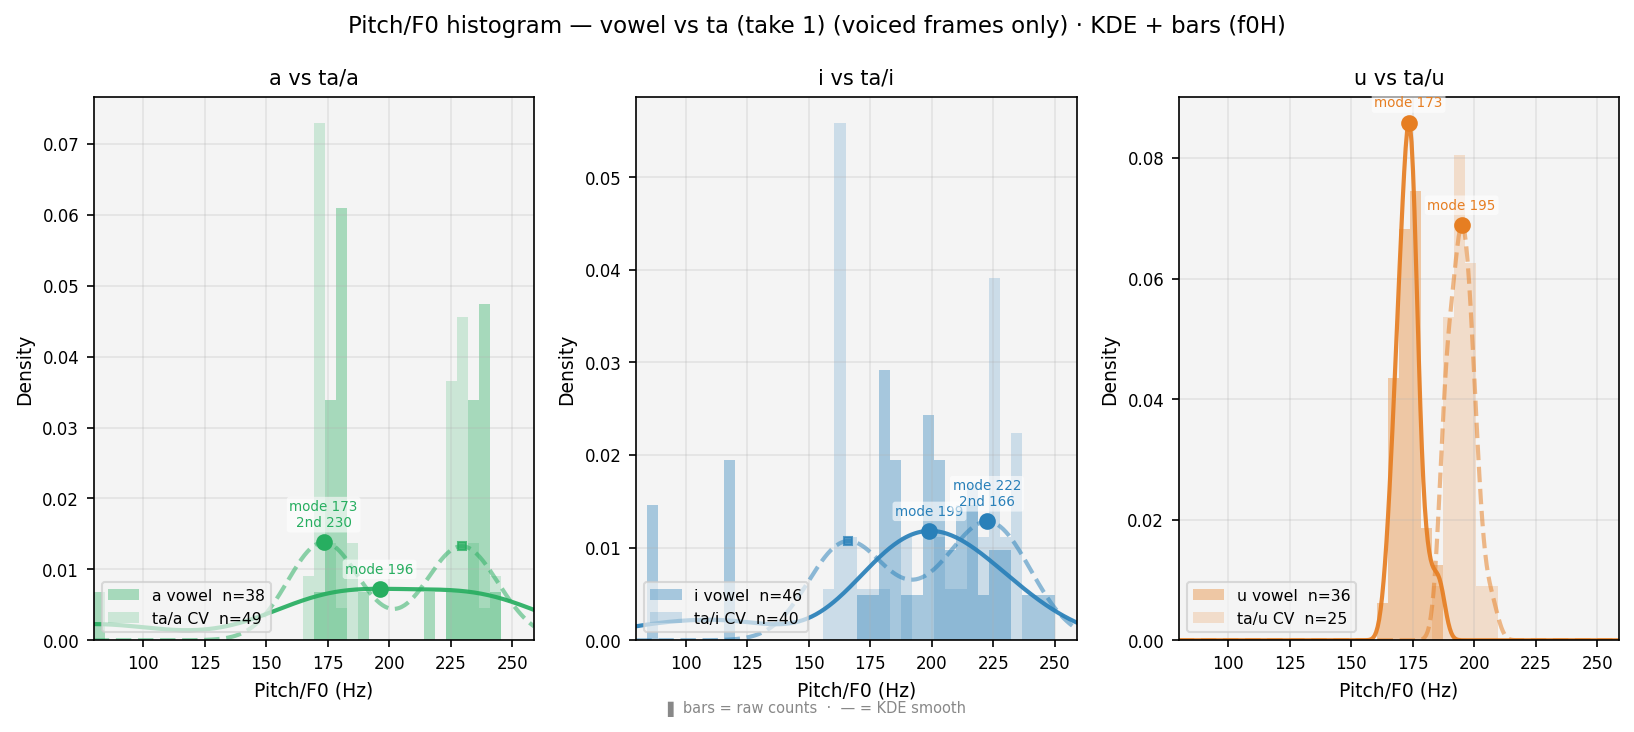
Smoothed histogram (each curve = bars drawn as a continuous line to avoid clutter from overlapping bars). Solid = vowel · Dashed = CV · voiced frames only. ● = primary peak (mode, most frequent pitch). ■ = secondary peak (onset elevation, smaller square). Thin verticals = means. Burst frames absent: voiceless stops produce no vocal-cord vibration — Praat returns NaN, so those frames never enter this plot.
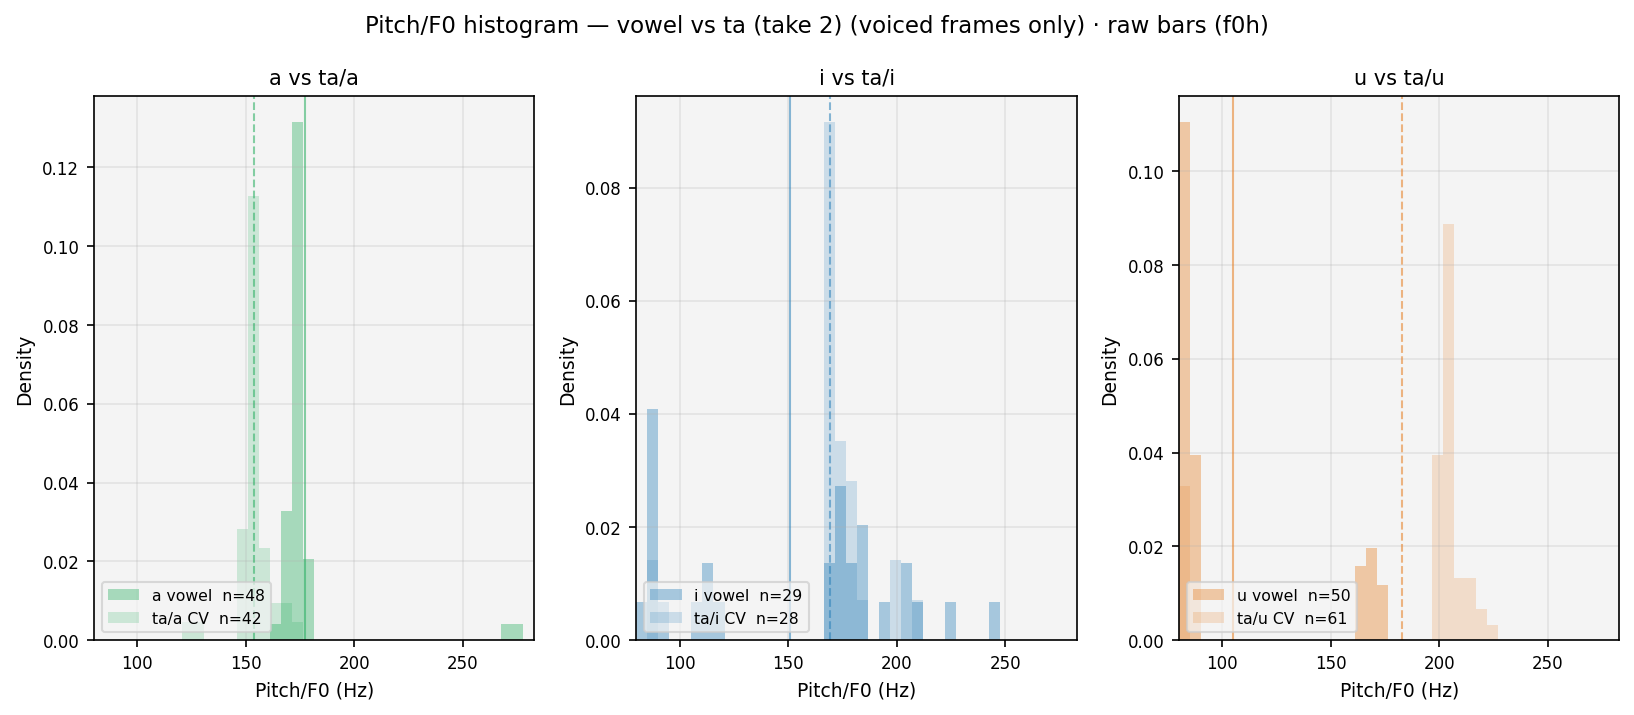
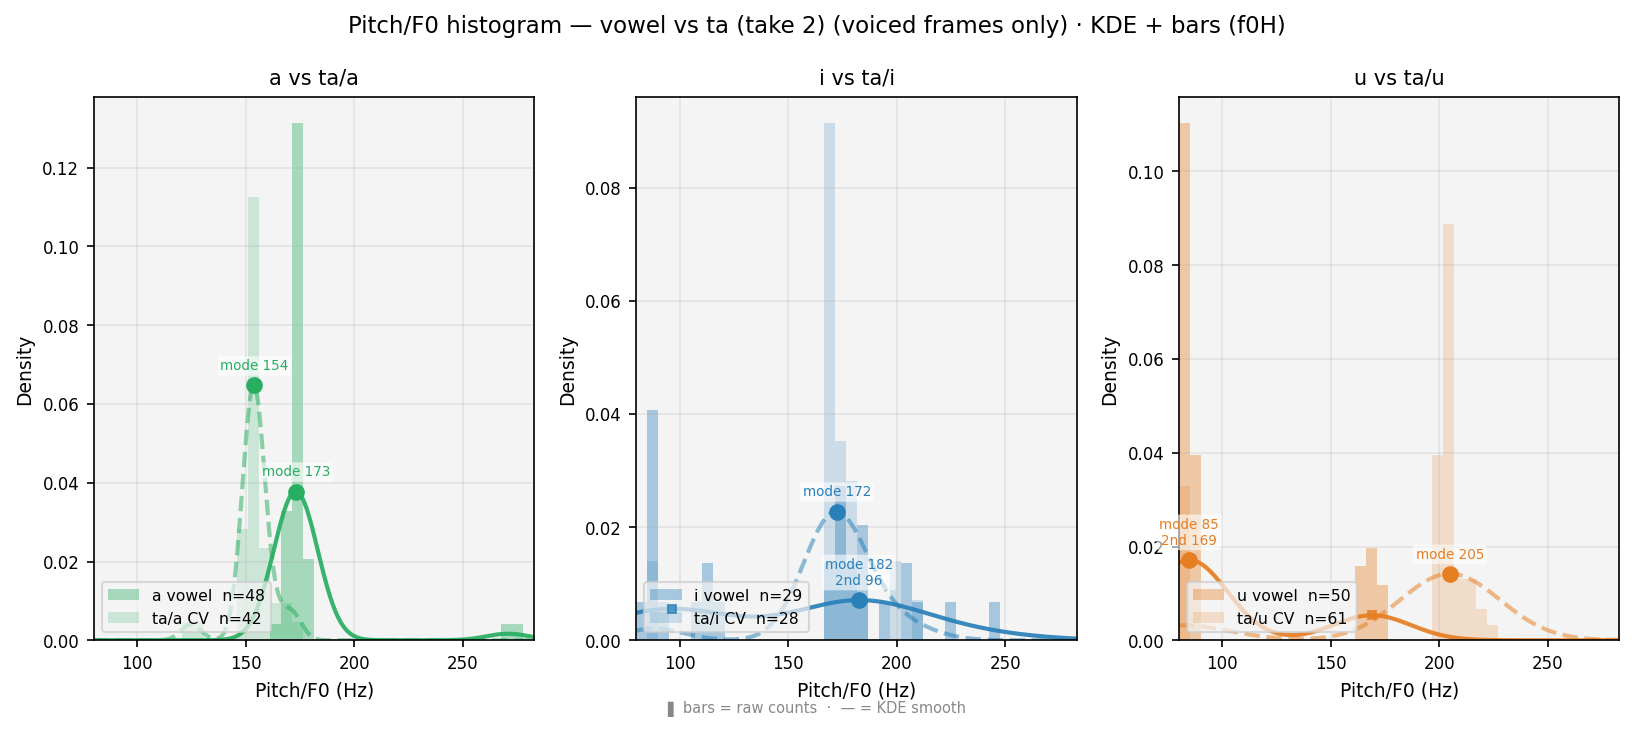
Smoothed histogram (each curve = bars drawn as a continuous line to avoid clutter from overlapping bars). Solid = vowel · Dashed = CV · voiced frames only. ● = primary peak (mode, most frequent pitch). ■ = secondary peak (onset elevation, smaller square). Thin verticals = means. Burst frames absent: voiceless stops produce no vocal-cord vibration — Praat returns NaN, so those frames never enter this plot.
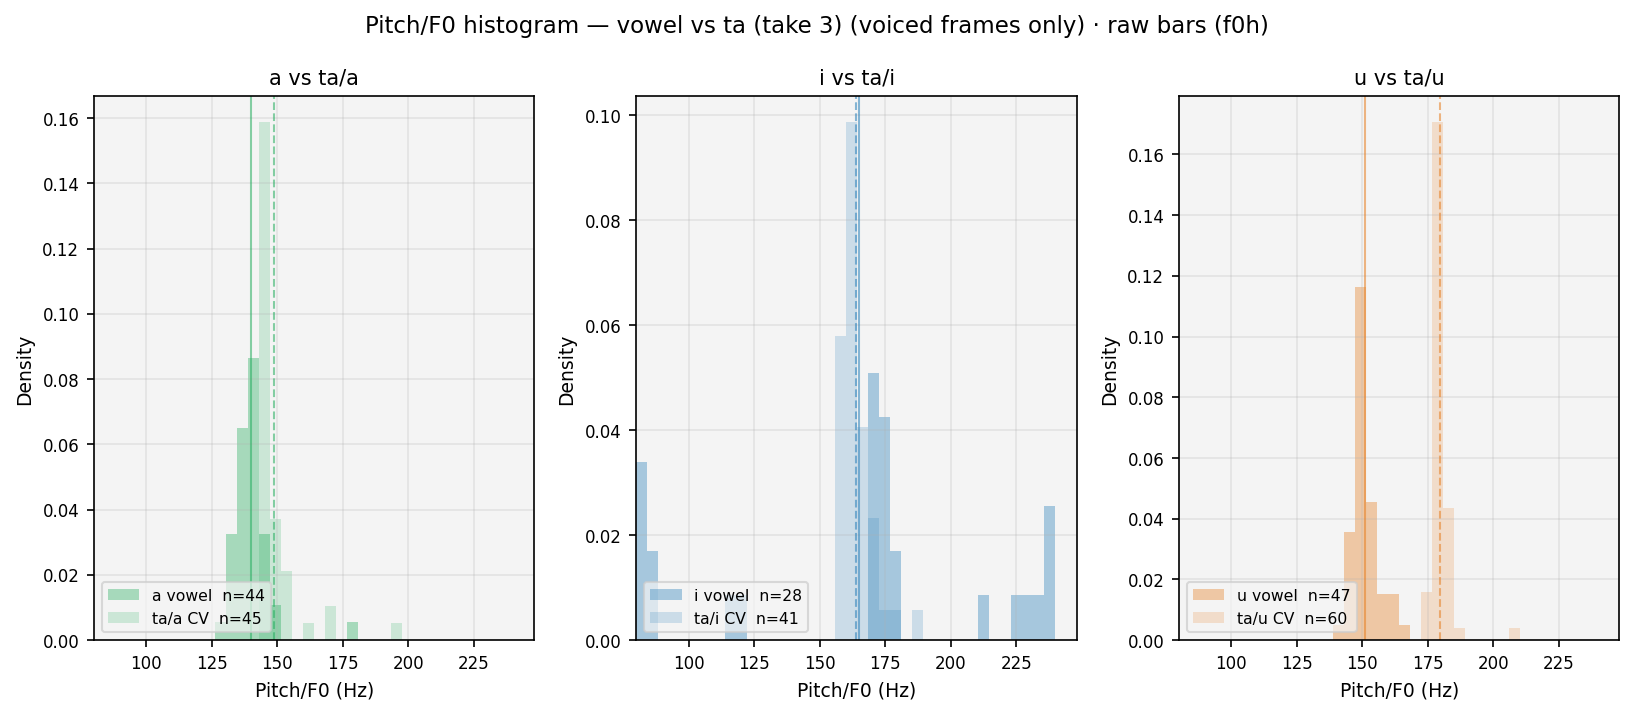
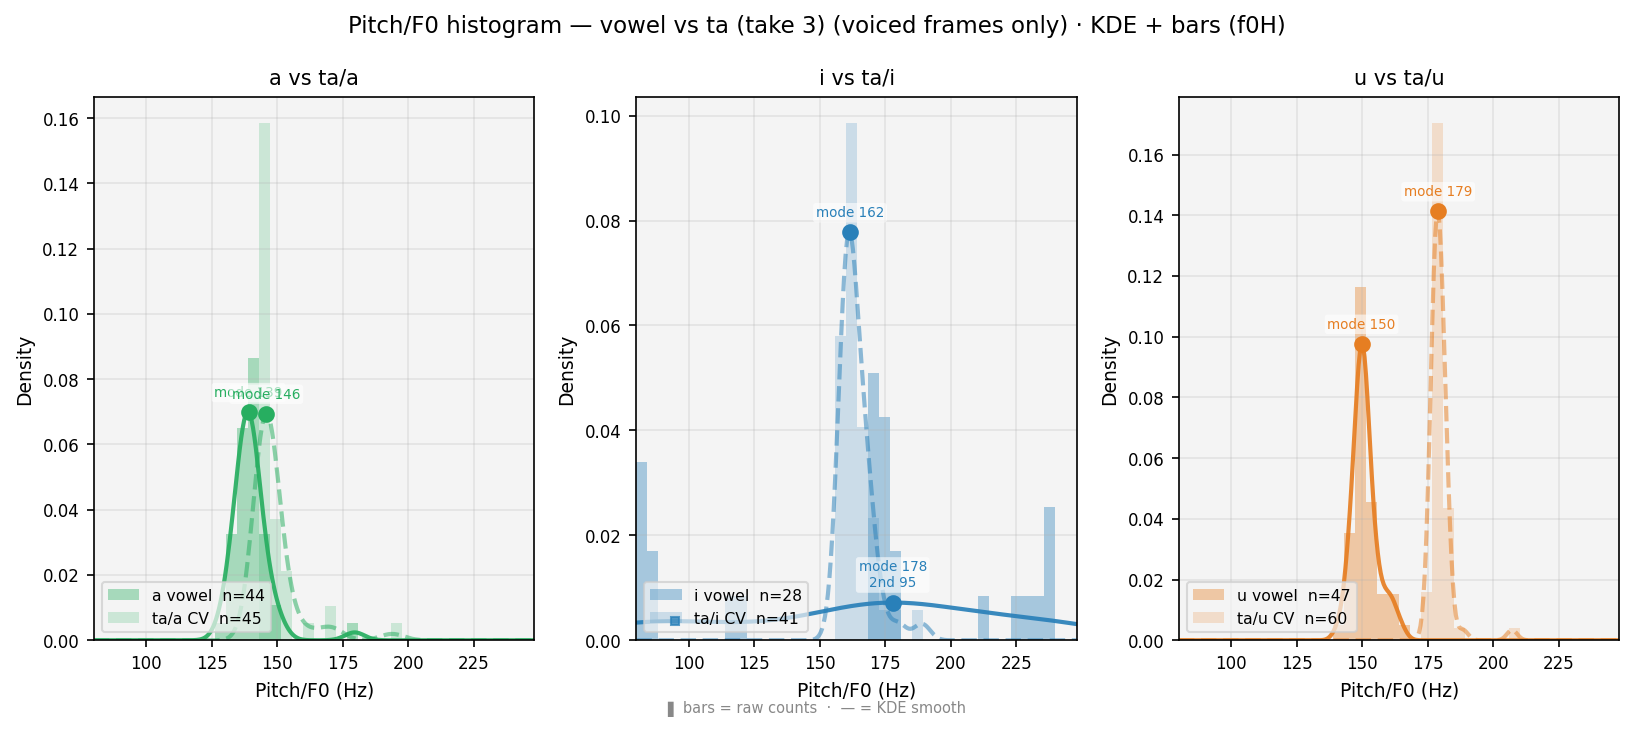
Smoothed histogram (each curve = bars drawn as a continuous line to avoid clutter from overlapping bars). Solid = vowel · Dashed = CV · voiced frames only. ● = primary peak (mode, most frequent pitch). ■ = secondary peak (onset elevation, smaller square). Thin verticals = means. Burst frames absent: voiceless stops produce no vocal-cord vibration — Praat returns NaN, so those frames never enter this plot.
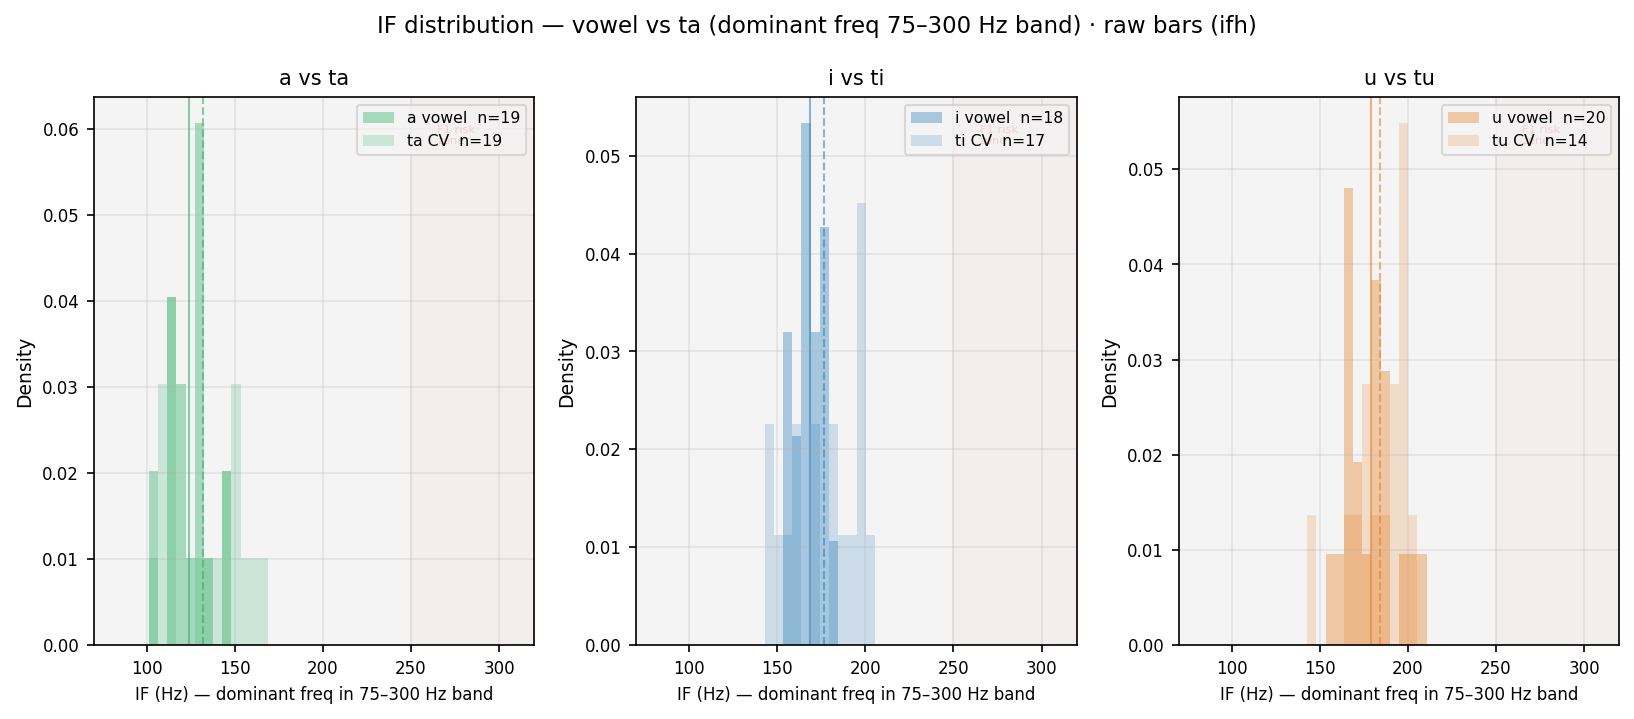
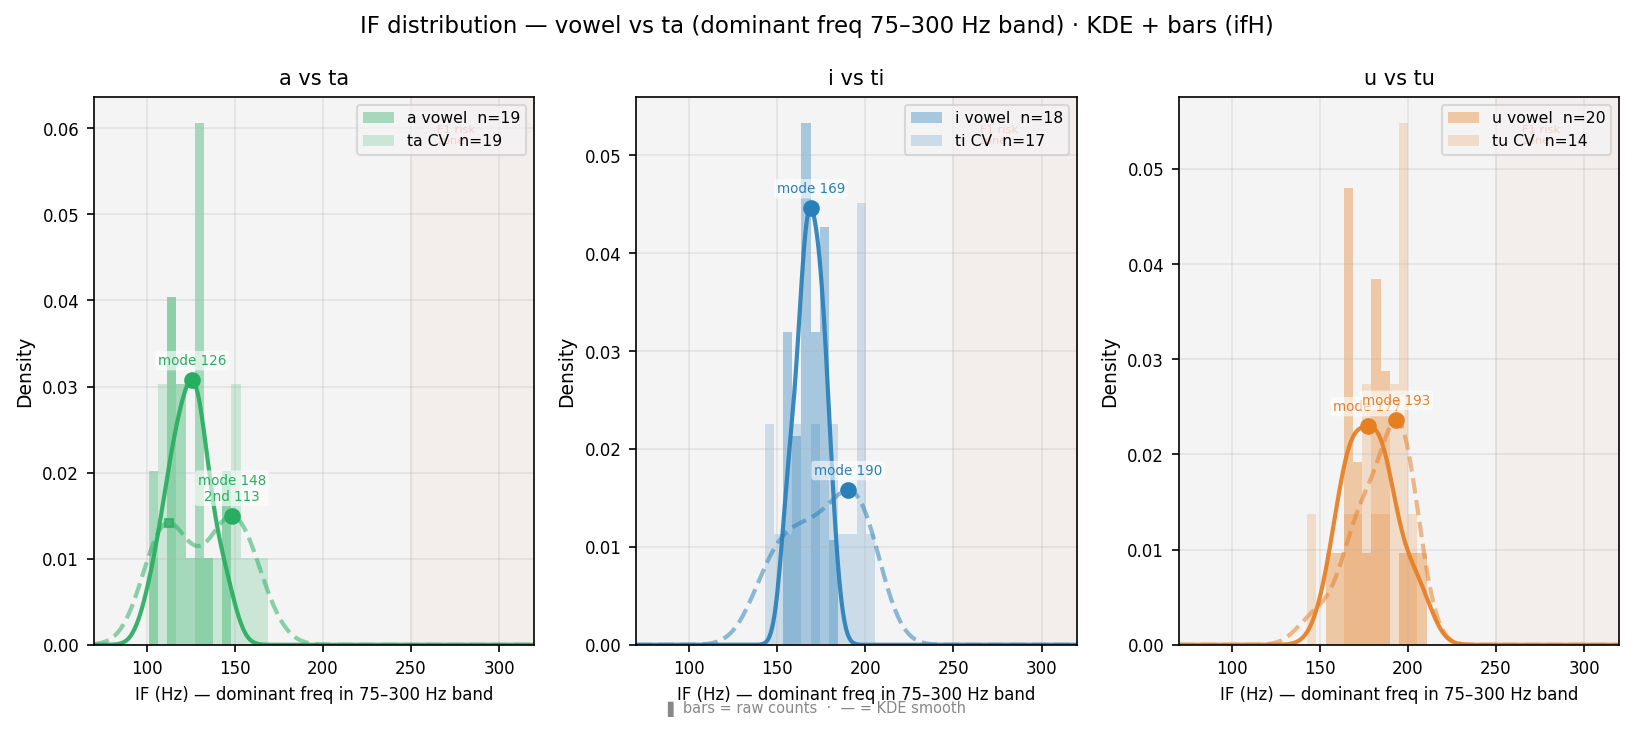
Distribution of instantaneous frequency (Hilbert transform, bandpass 75–300 Hz) at Praat frame rate. For /a/ (F1~800 Hz, outside band): IF tracks F0 — histogram aligns with Praat pitch histogram. For /i/ /u/ (F1~280–300 Hz, inside band): IF may track F1 — red-shaded zone marks this risk. Comparison of vowel vs CV curves shows coarticulation effect on dominant bandpass frequency. ● primary peak · ■ secondary peak.
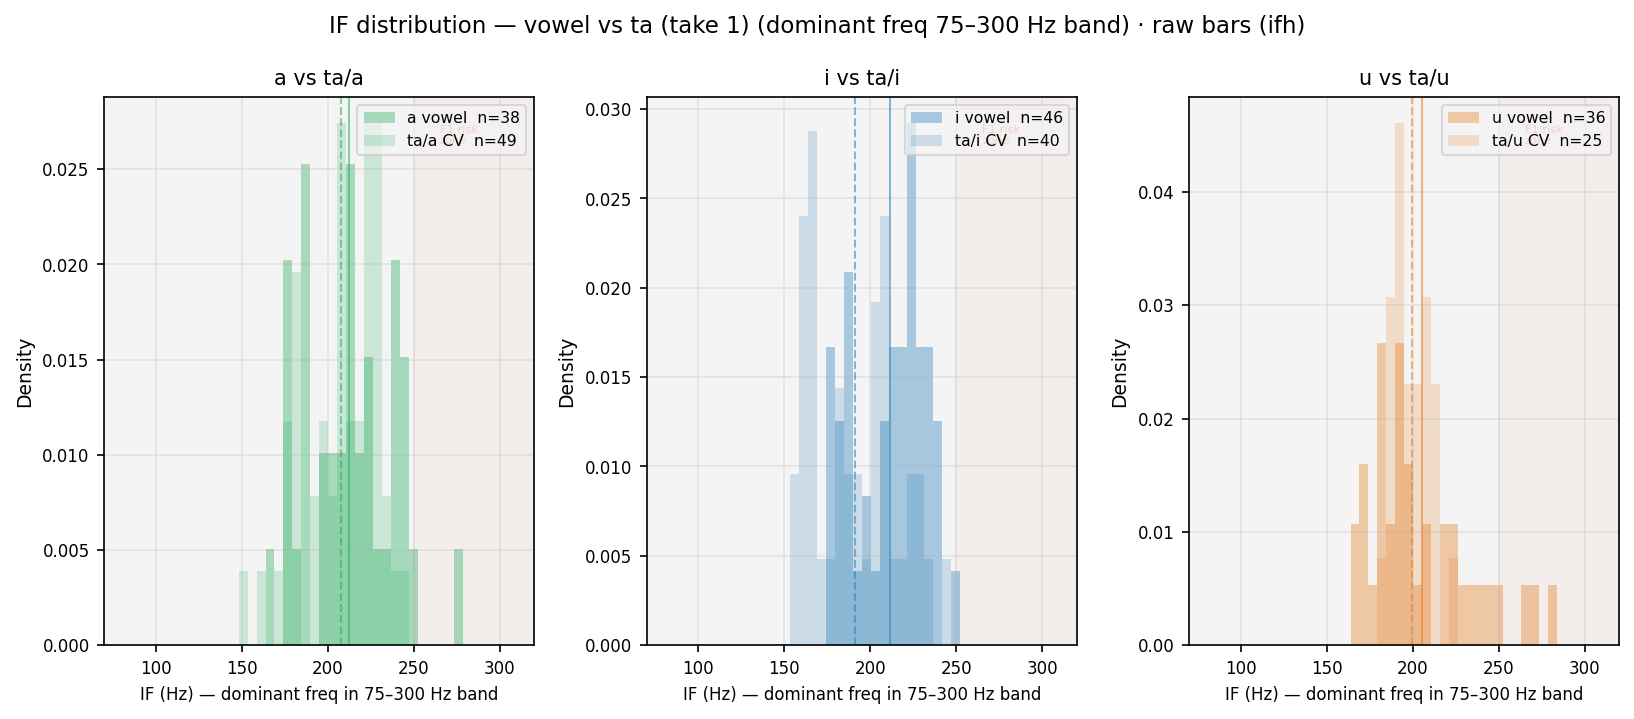
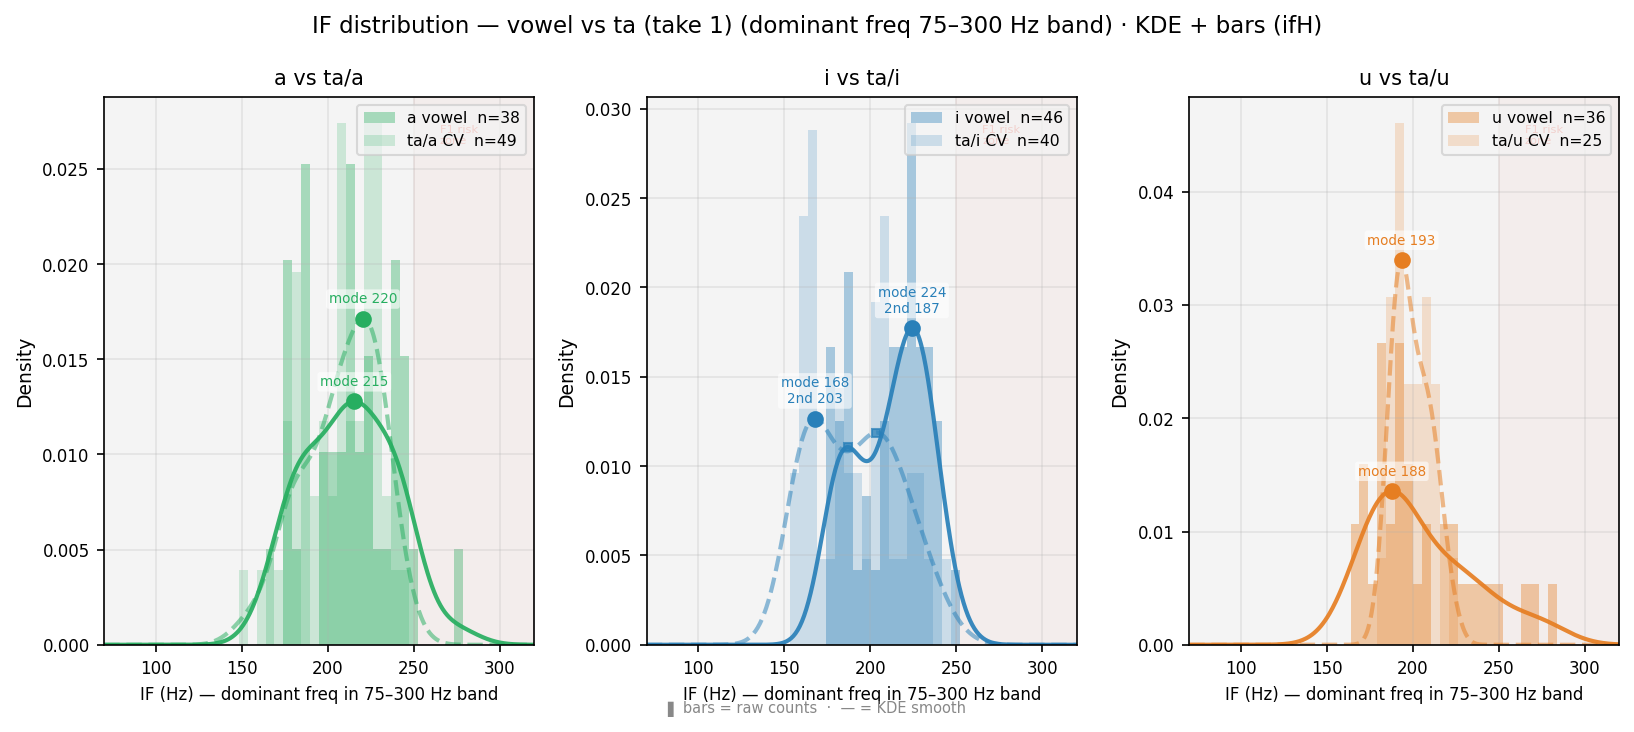
Distribution of instantaneous frequency (Hilbert transform, bandpass 75–300 Hz) at Praat frame rate. For /a/ (F1~800 Hz, outside band): IF tracks F0 — histogram aligns with Praat pitch histogram. For /i/ /u/ (F1~280–300 Hz, inside band): IF may track F1 — red-shaded zone marks this risk. Comparison of vowel vs CV curves shows coarticulation effect on dominant bandpass frequency. ● primary peak · ■ secondary peak.
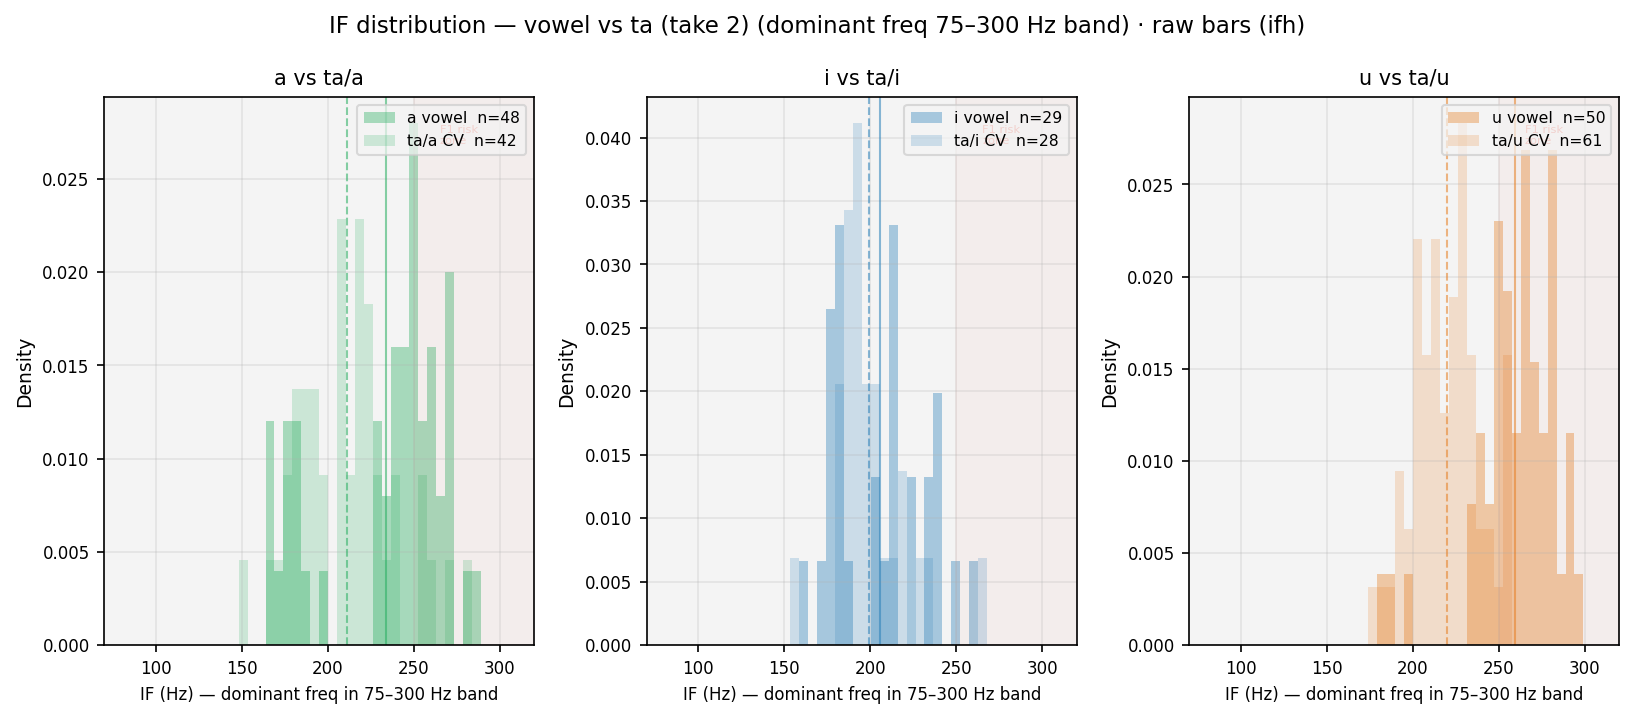
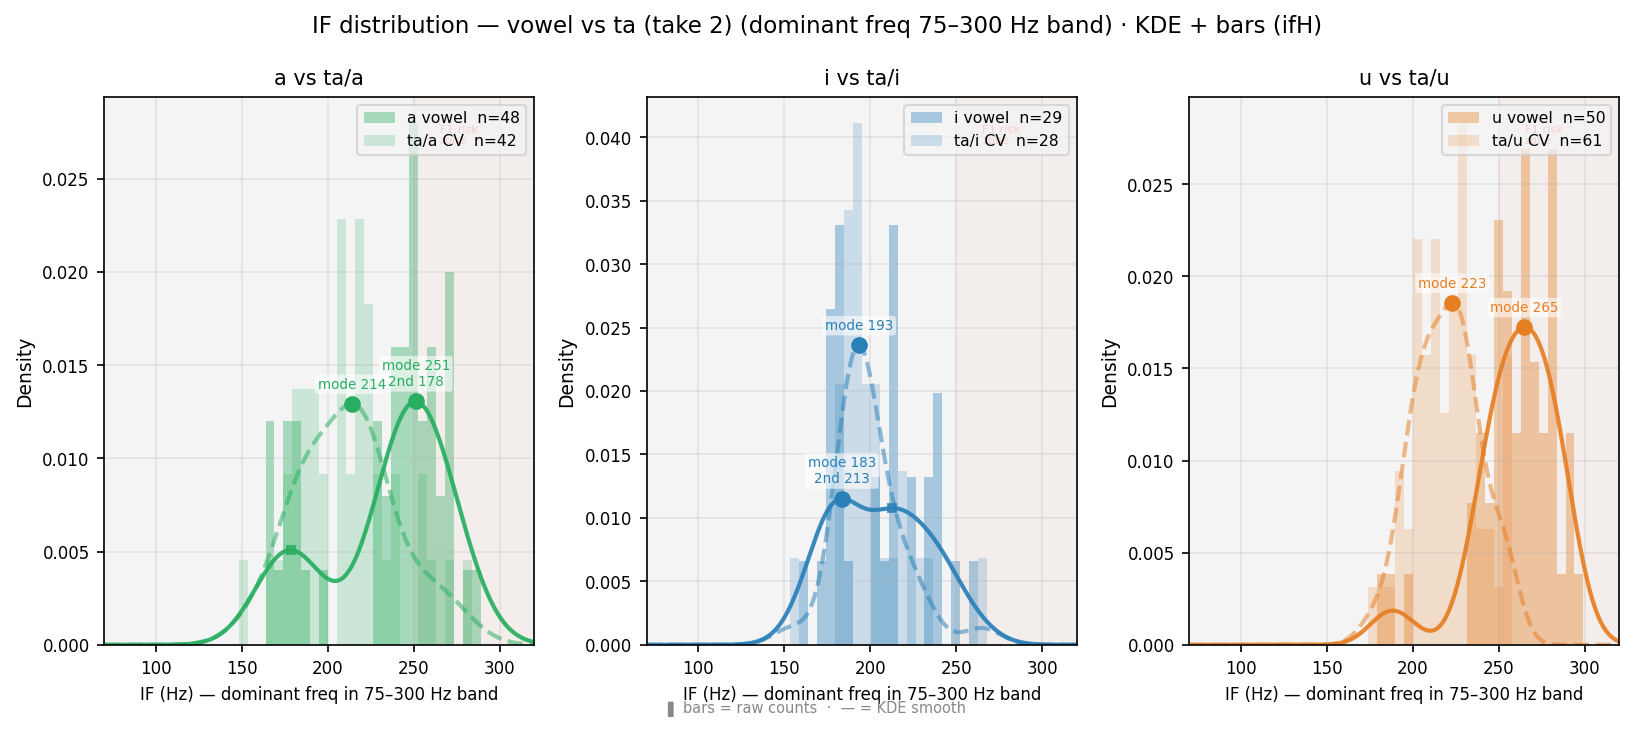
Distribution of instantaneous frequency (Hilbert transform, bandpass 75–300 Hz) at Praat frame rate. For /a/ (F1~800 Hz, outside band): IF tracks F0 — histogram aligns with Praat pitch histogram. For /i/ /u/ (F1~280–300 Hz, inside band): IF may track F1 — red-shaded zone marks this risk. Comparison of vowel vs CV curves shows coarticulation effect on dominant bandpass frequency. ● primary peak · ■ secondary peak.
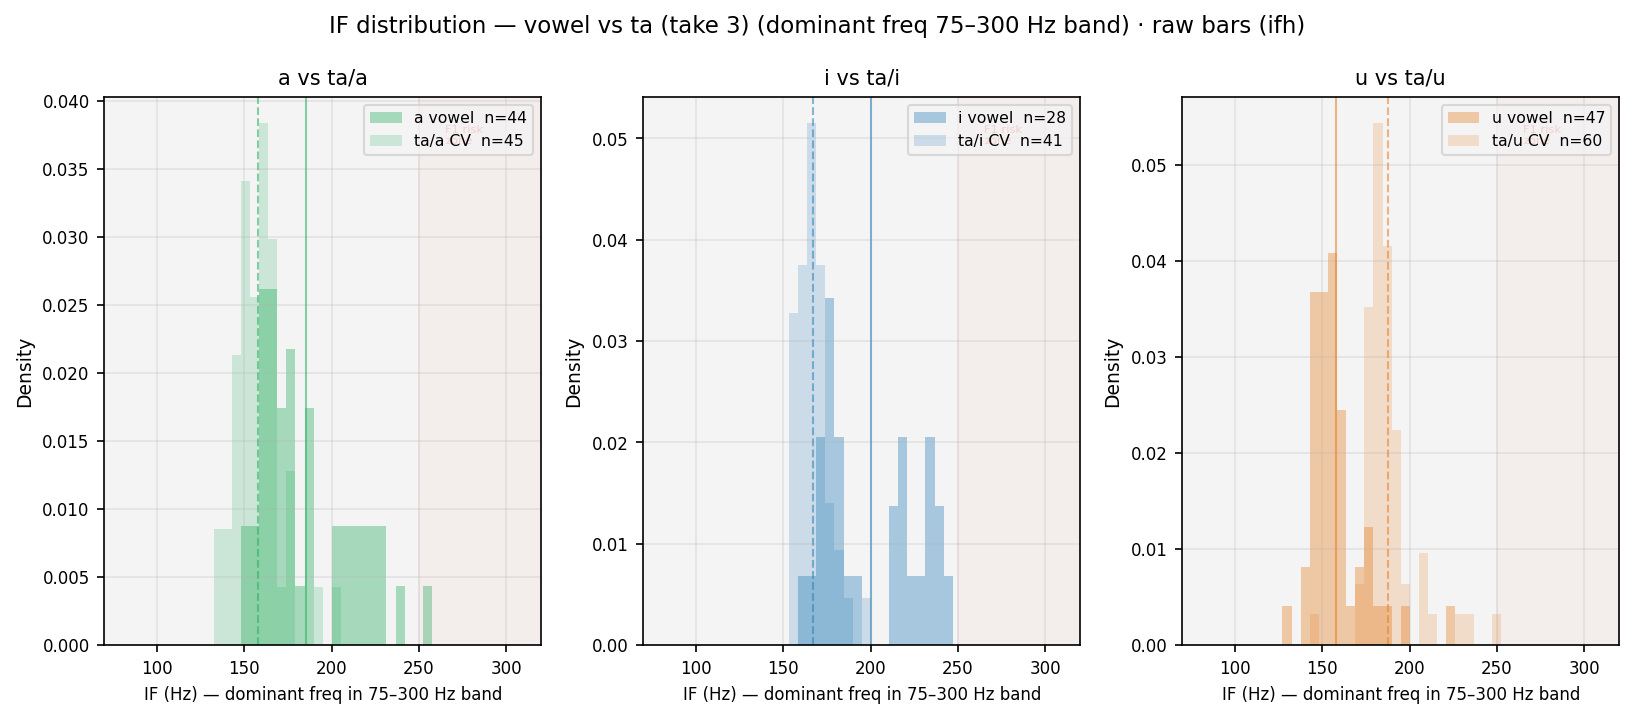
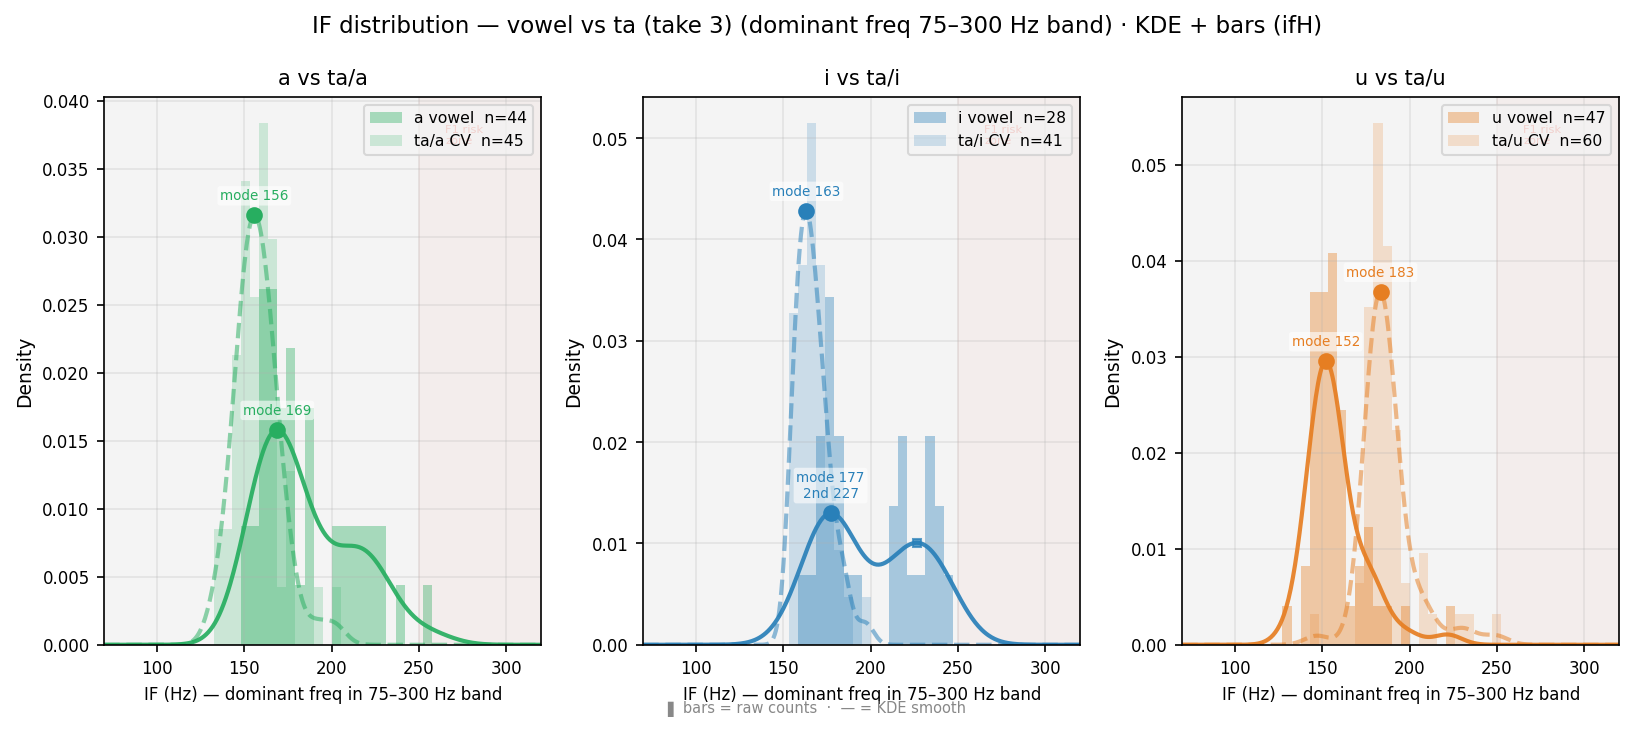
Distribution of instantaneous frequency (Hilbert transform, bandpass 75–300 Hz) at Praat frame rate. For /a/ (F1~800 Hz, outside band): IF tracks F0 — histogram aligns with Praat pitch histogram. For /i/ /u/ (F1~280–300 Hz, inside band): IF may track F1 — red-shaded zone marks this risk. Comparison of vowel vs CV curves shows coarticulation effect on dominant bandpass frequency. ● primary peak · ■ secondary peak.
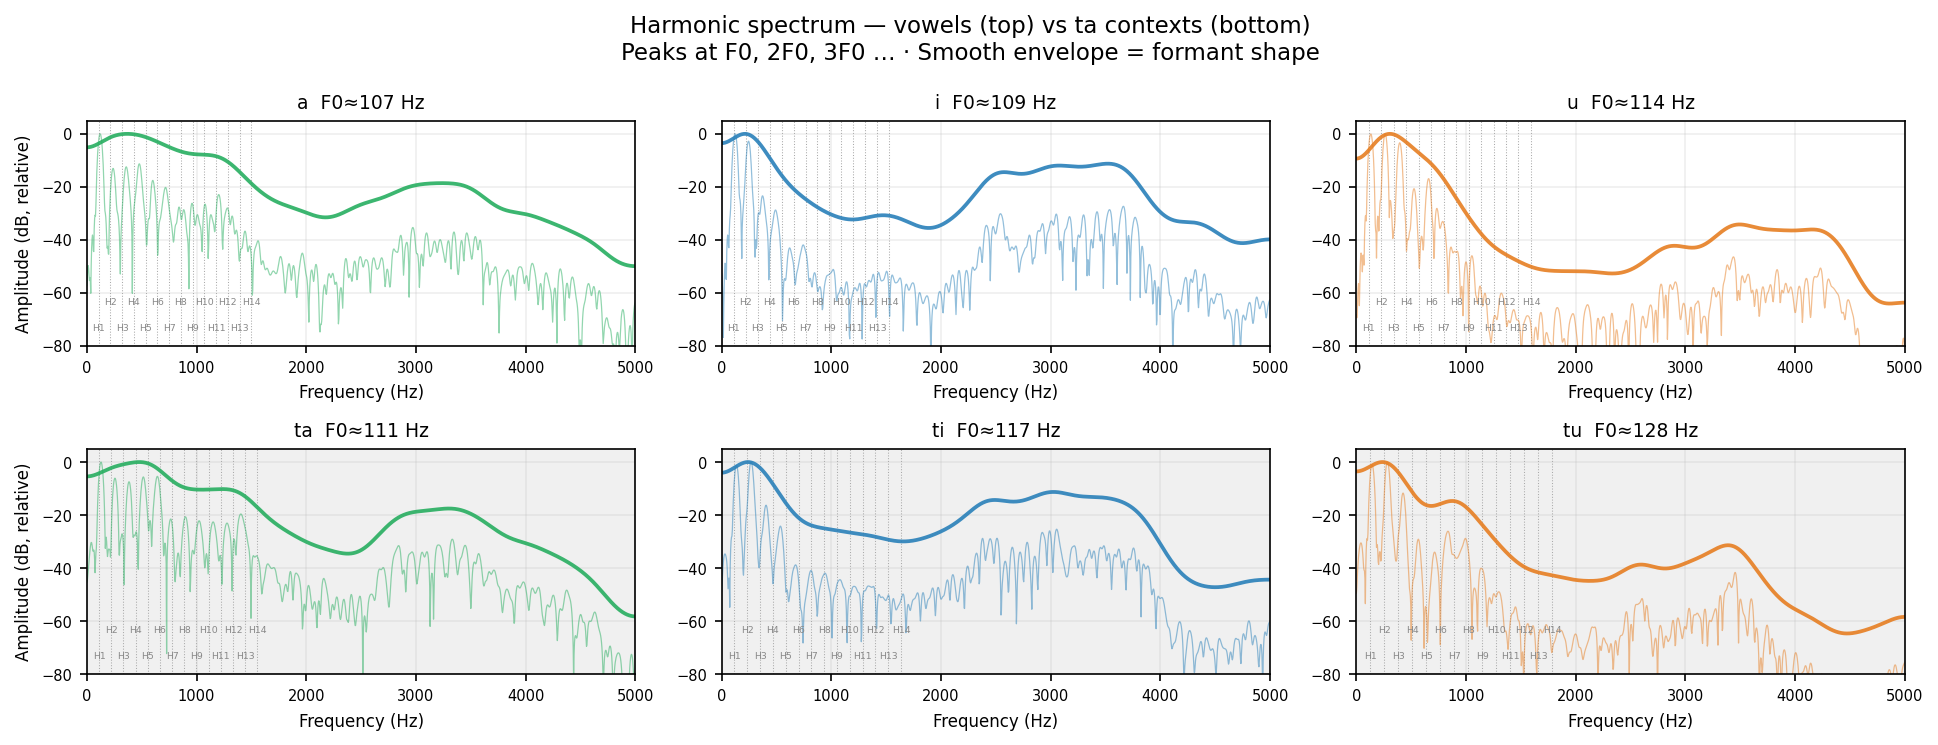
Plain reading: A vowel is a mixture of tones all sounding together. The lowest tone is the fundamental (H1 ≈ F0, ~100 Hz for this voice). The voice also produces tones at exactly 2×, 3×, 4× that frequency — these are harmonics (H2, H3, …). The shape of the mouth amplifies some harmonics more than others; those amplified regions appear as bumps in the smooth envelope — those are the formants (F1 F2 F3). Changing the vowel (अ → इ → उ) reshapes the mouth and shifts the envelope bumps while keeping the comb spacing (F0) the same. Technical: FFT of 50 ms steady-state (20–70 ms after voicing onset). Thin line = raw spectrum · bold line = Gaussian-smoothed spectral envelope (~150 Hz width). Dotted verticals = expected harmonics at n×F0. Y-axis normalised to 0 dB at peak.
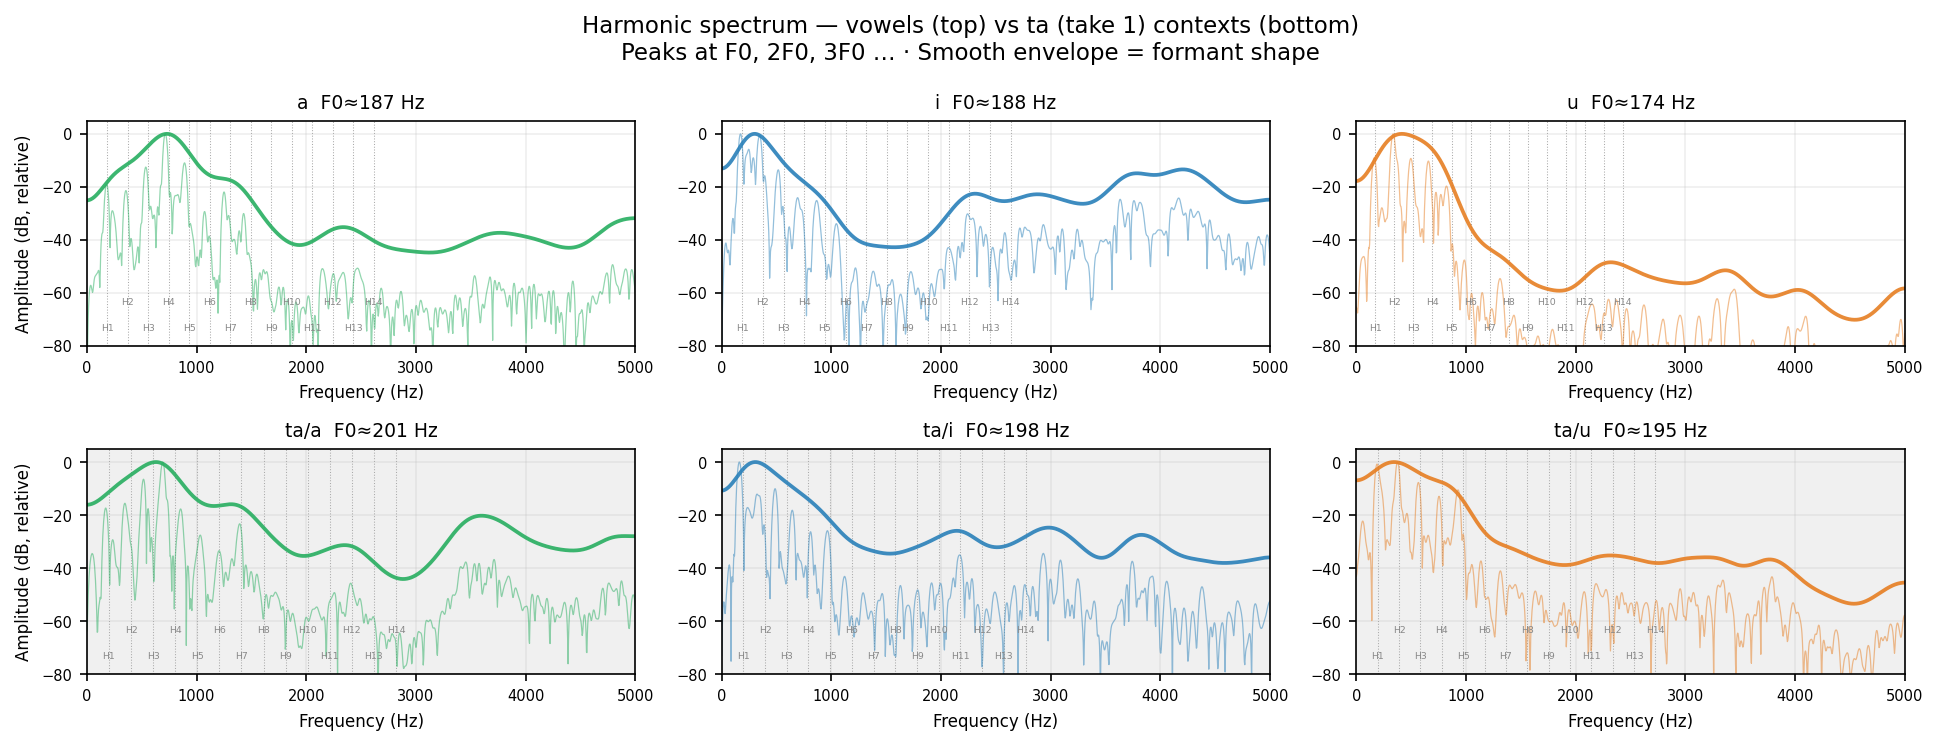
Human take 1
Plain reading: A vowel is a mixture of tones all sounding together. The lowest tone is the fundamental (H1 ≈ F0, ~100 Hz for this voice). The voice also produces tones at exactly 2×, 3×, 4× that frequency — these are harmonics (H2, H3, …). The shape of the mouth amplifies some harmonics more than others; those amplified regions appear as bumps in the smooth envelope — those are the formants (F1 F2 F3). Changing the vowel (अ → इ → उ) reshapes the mouth and shifts the envelope bumps while keeping the comb spacing (F0) the same. Technical: FFT of 50 ms steady-state (20–70 ms after voicing onset). Thin line = raw spectrum · bold line = Gaussian-smoothed spectral envelope (~150 Hz width). Dotted verticals = expected harmonics at n×F0. Y-axis normalised to 0 dB at peak.
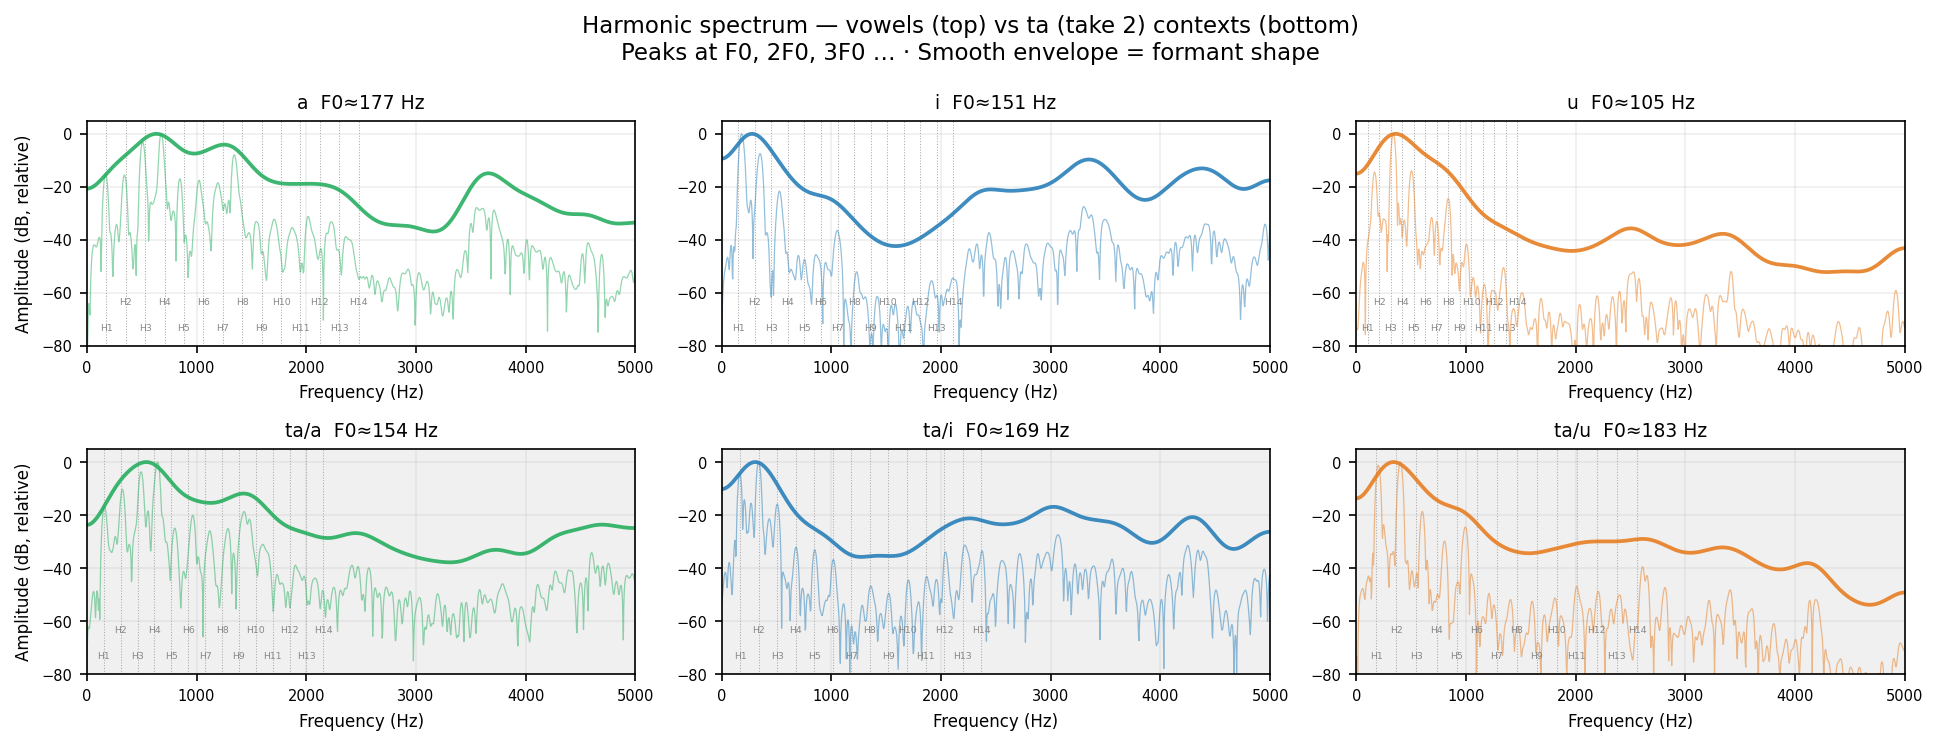
Human take 2
Plain reading: A vowel is a mixture of tones all sounding together. The lowest tone is the fundamental (H1 ≈ F0, ~100 Hz for this voice). The voice also produces tones at exactly 2×, 3×, 4× that frequency — these are harmonics (H2, H3, …). The shape of the mouth amplifies some harmonics more than others; those amplified regions appear as bumps in the smooth envelope — those are the formants (F1 F2 F3). Changing the vowel (अ → इ → उ) reshapes the mouth and shifts the envelope bumps while keeping the comb spacing (F0) the same. Technical: FFT of 50 ms steady-state (20–70 ms after voicing onset). Thin line = raw spectrum · bold line = Gaussian-smoothed spectral envelope (~150 Hz width). Dotted verticals = expected harmonics at n×F0. Y-axis normalised to 0 dB at peak.
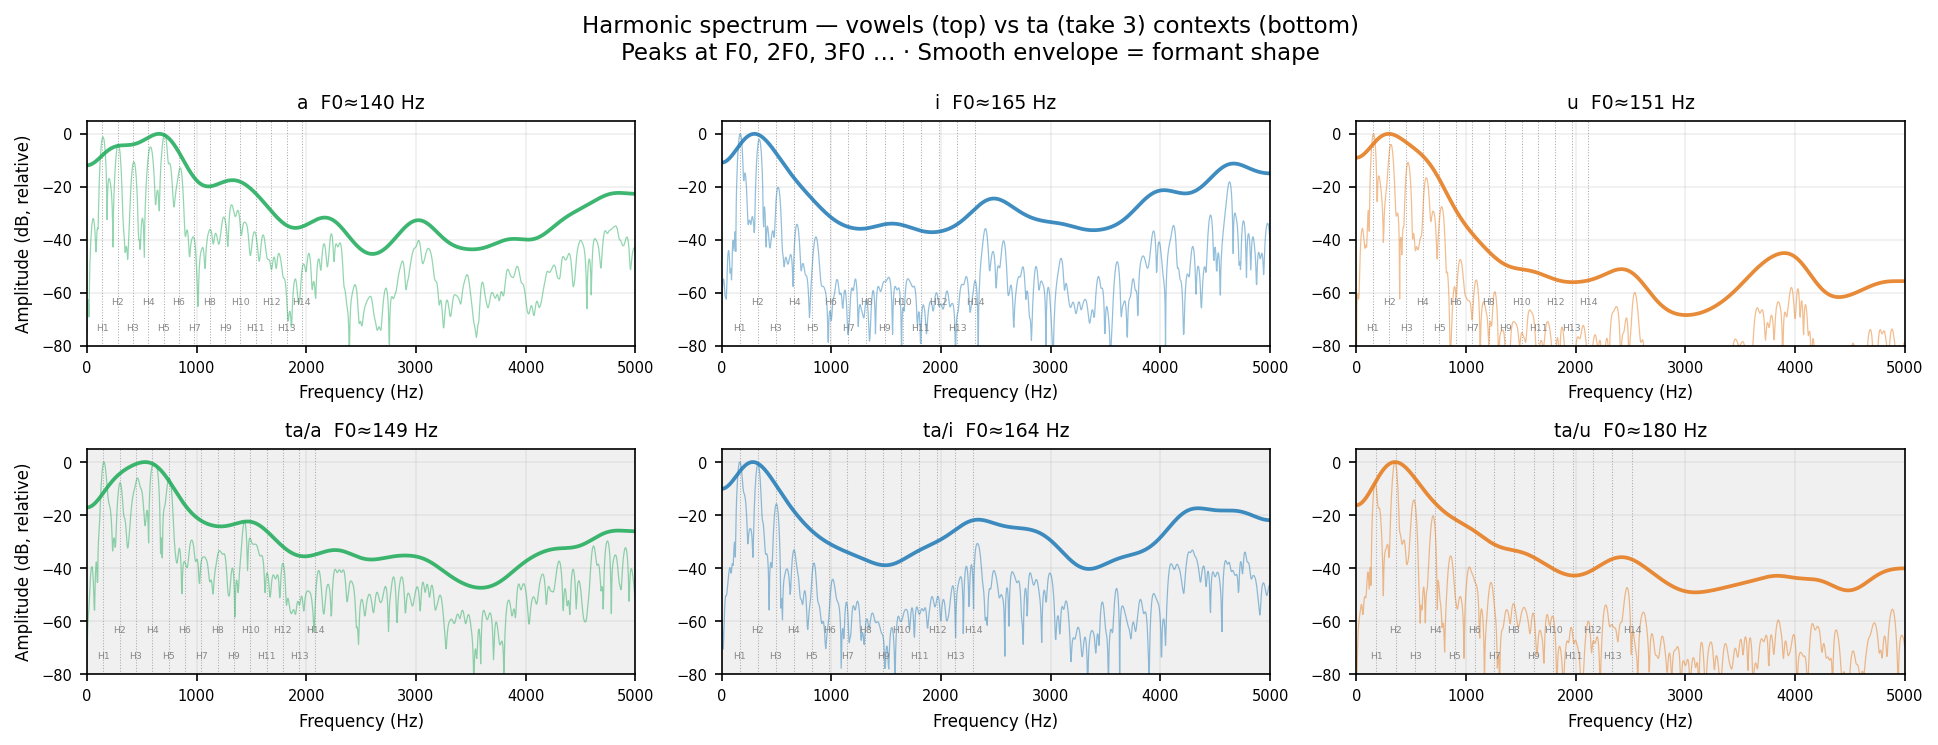
Human take 3
Plain reading: A vowel is a mixture of tones all sounding together. The lowest tone is the fundamental (H1 ≈ F0, ~100 Hz for this voice). The voice also produces tones at exactly 2×, 3×, 4× that frequency — these are harmonics (H2, H3, …). The shape of the mouth amplifies some harmonics more than others; those amplified regions appear as bumps in the smooth envelope — those are the formants (F1 F2 F3). Changing the vowel (अ → इ → उ) reshapes the mouth and shifts the envelope bumps while keeping the comb spacing (F0) the same. Technical: FFT of 50 ms steady-state (20–70 ms after voicing onset). Thin line = raw spectrum · bold line = Gaussian-smoothed spectral envelope (~150 Hz width). Dotted verticals = expected harmonics at n×F0. Y-axis normalised to 0 dB at peak.
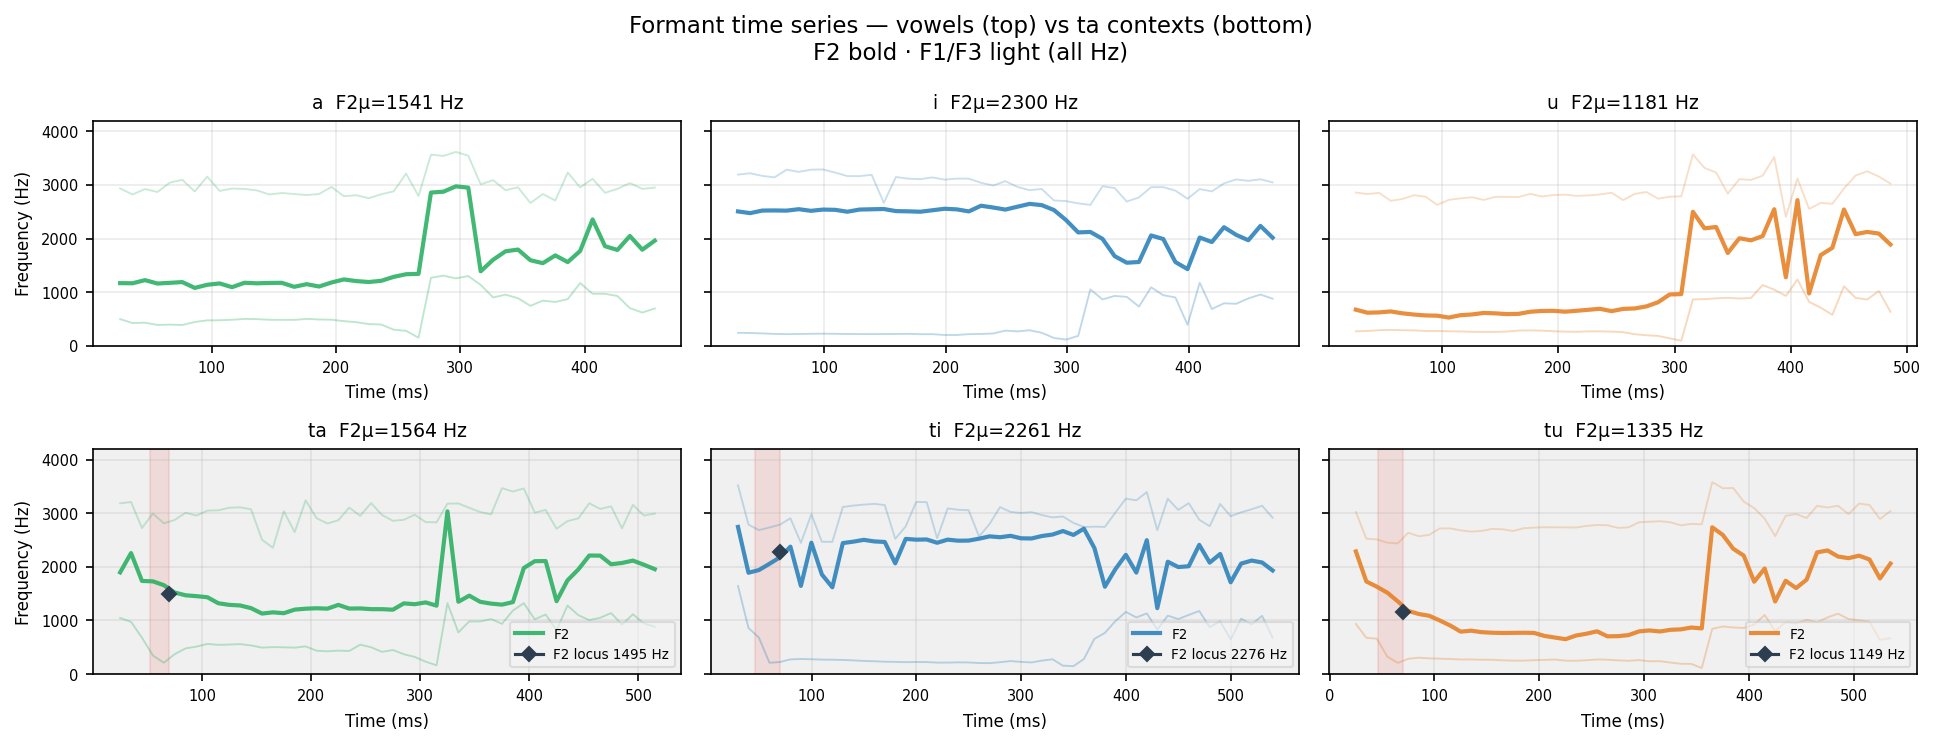
F2 bold · F1/F3 light (alpha). ◆ = F2 locus (F2 at voicing onset = place of articulation marker). Red shade = burst window.
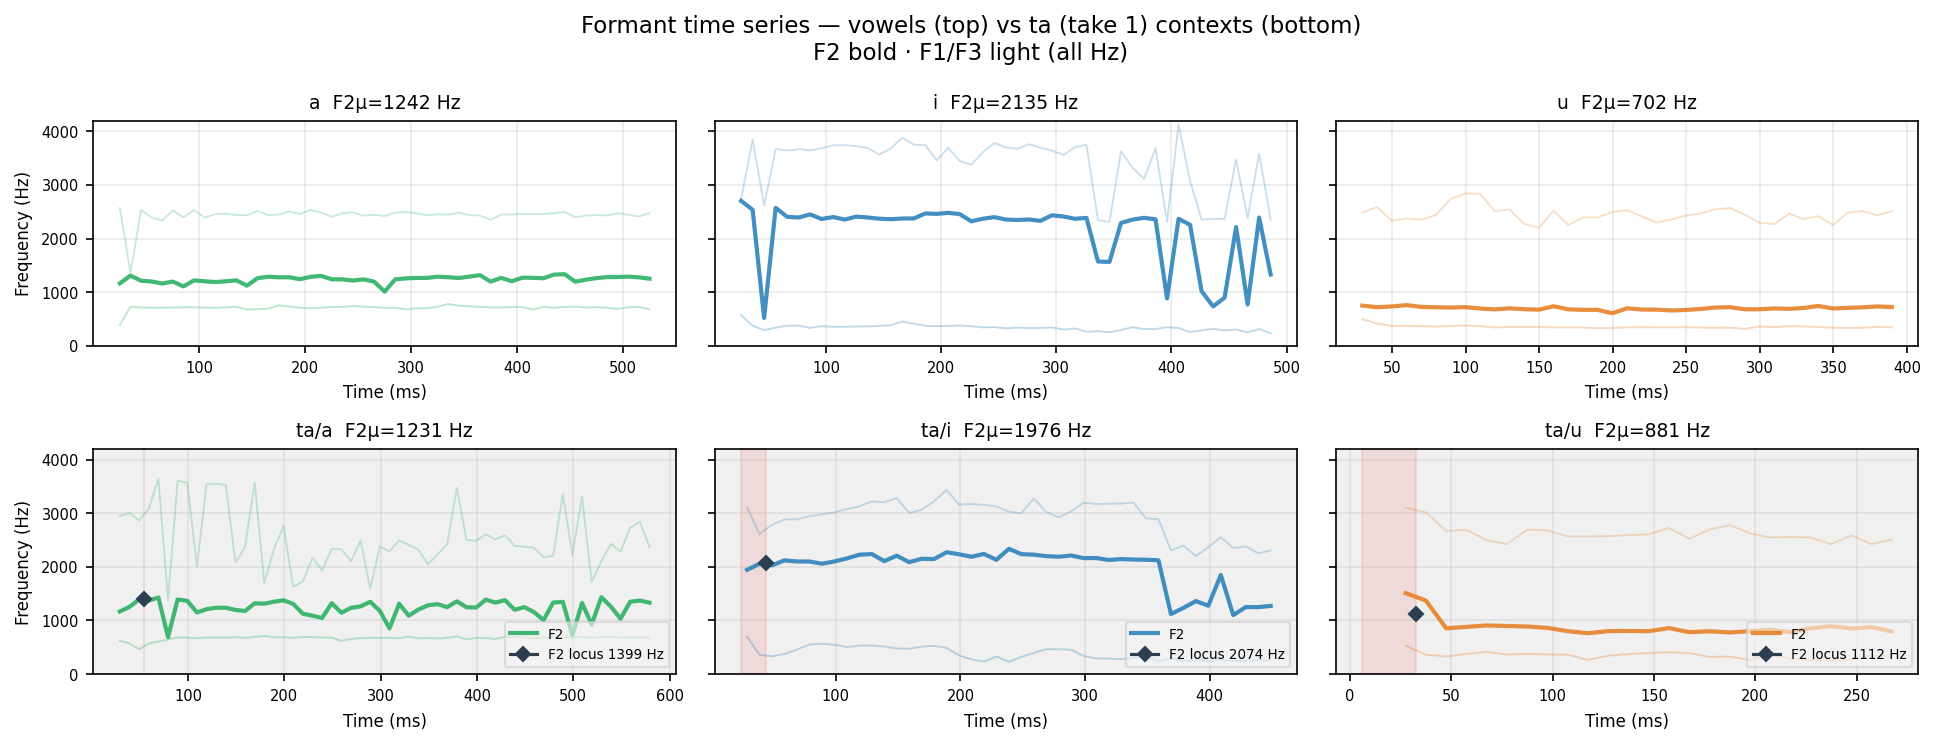
Human take 1
F2 bold · F1/F3 light (alpha). ◆ = F2 locus (F2 at voicing onset = place of articulation marker). Red shade = burst window.
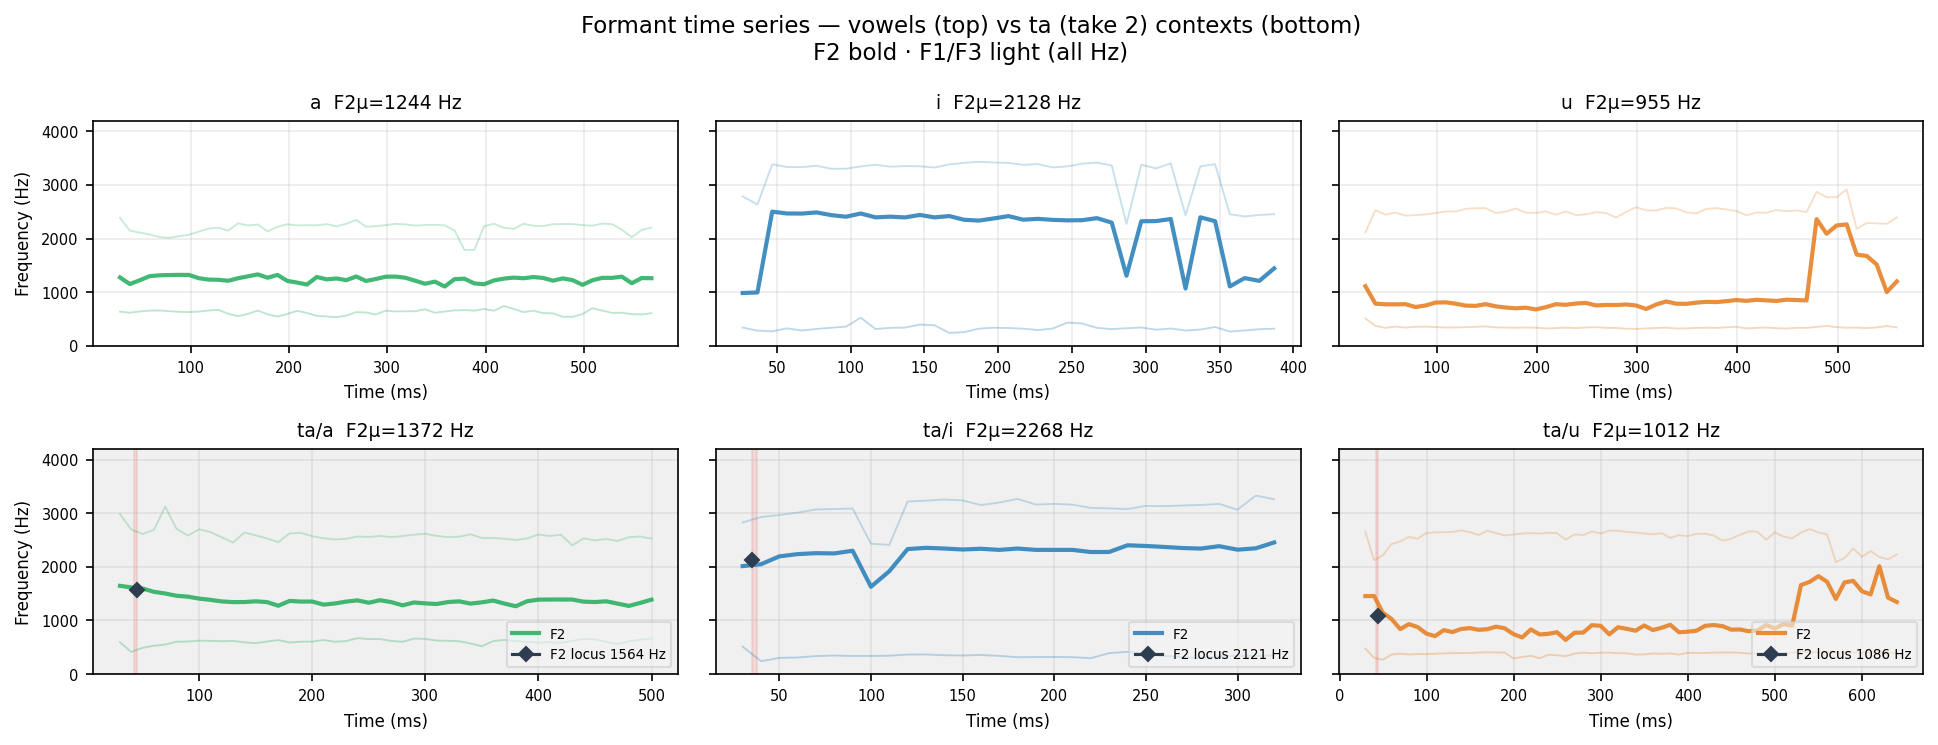
Human take 2
F2 bold · F1/F3 light (alpha). ◆ = F2 locus (F2 at voicing onset = place of articulation marker). Red shade = burst window.
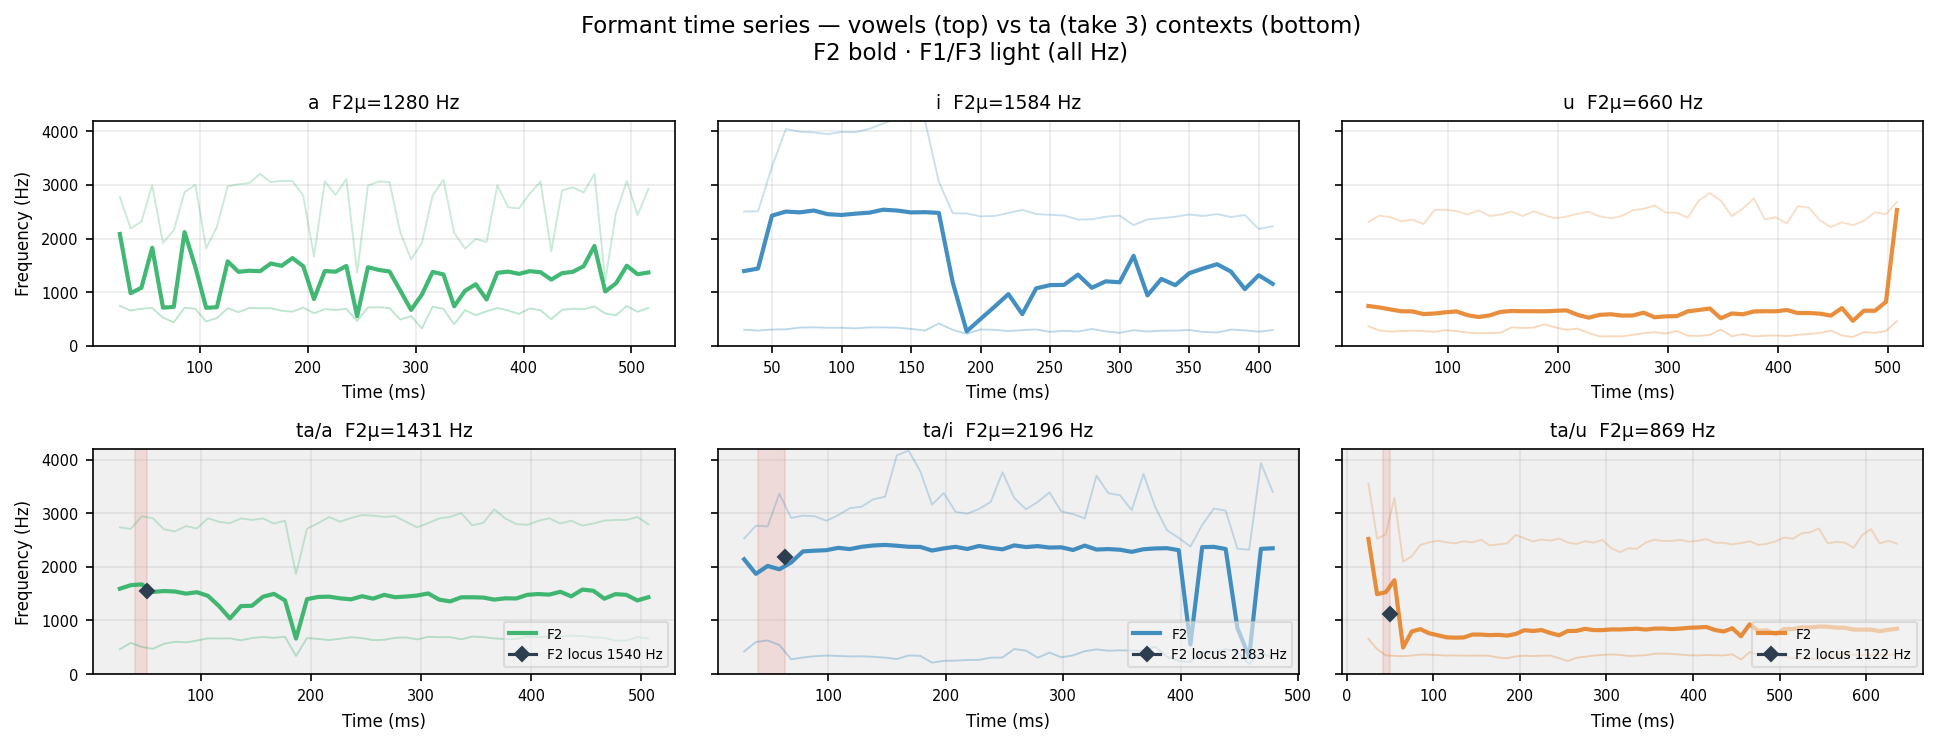
Human take 3
F2 bold · F1/F3 light (alpha). ◆ = F2 locus (F2 at voicing onset = place of articulation marker). Red shade = burst window.
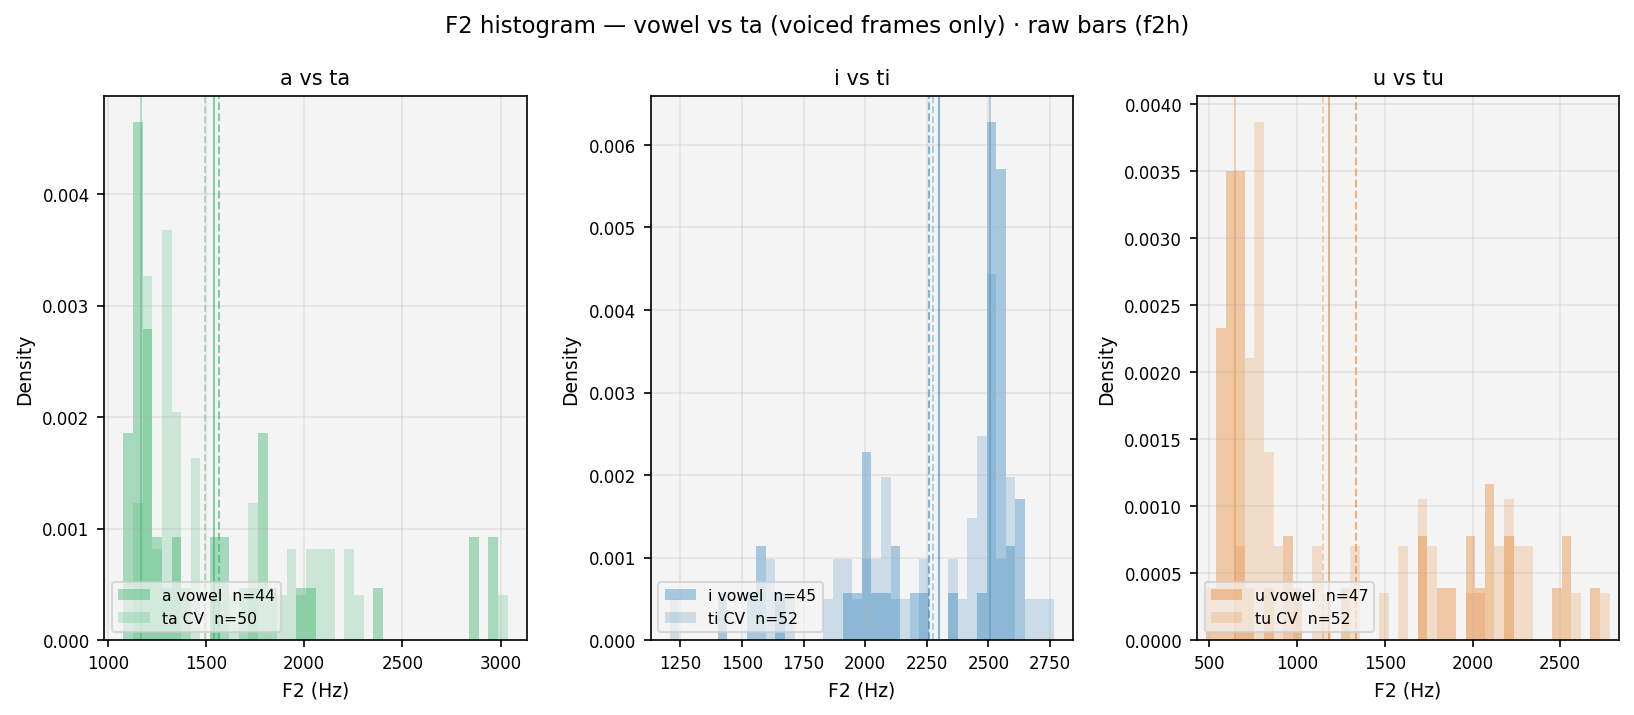
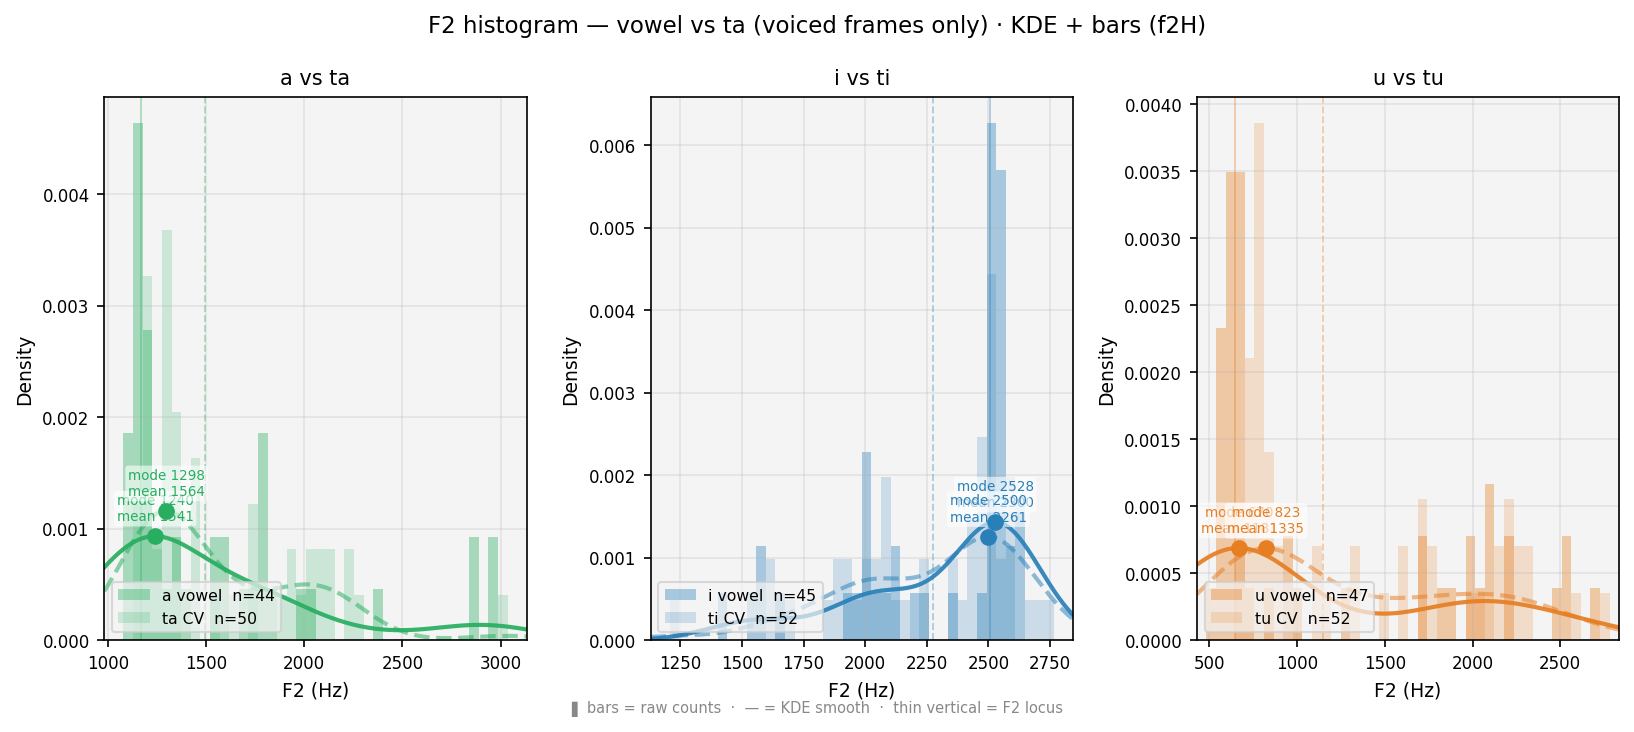
F2 smoothed histogram — vowel (solid) vs CV (dashed). ● = primary peak (mode, most frequent F2). ■ = secondary peak (smaller square). Thin verticals = F2 locus (F2 at voicing onset). Shift between curves = coarticulation. Locus stability across a/i/u contexts characterises the consonant.
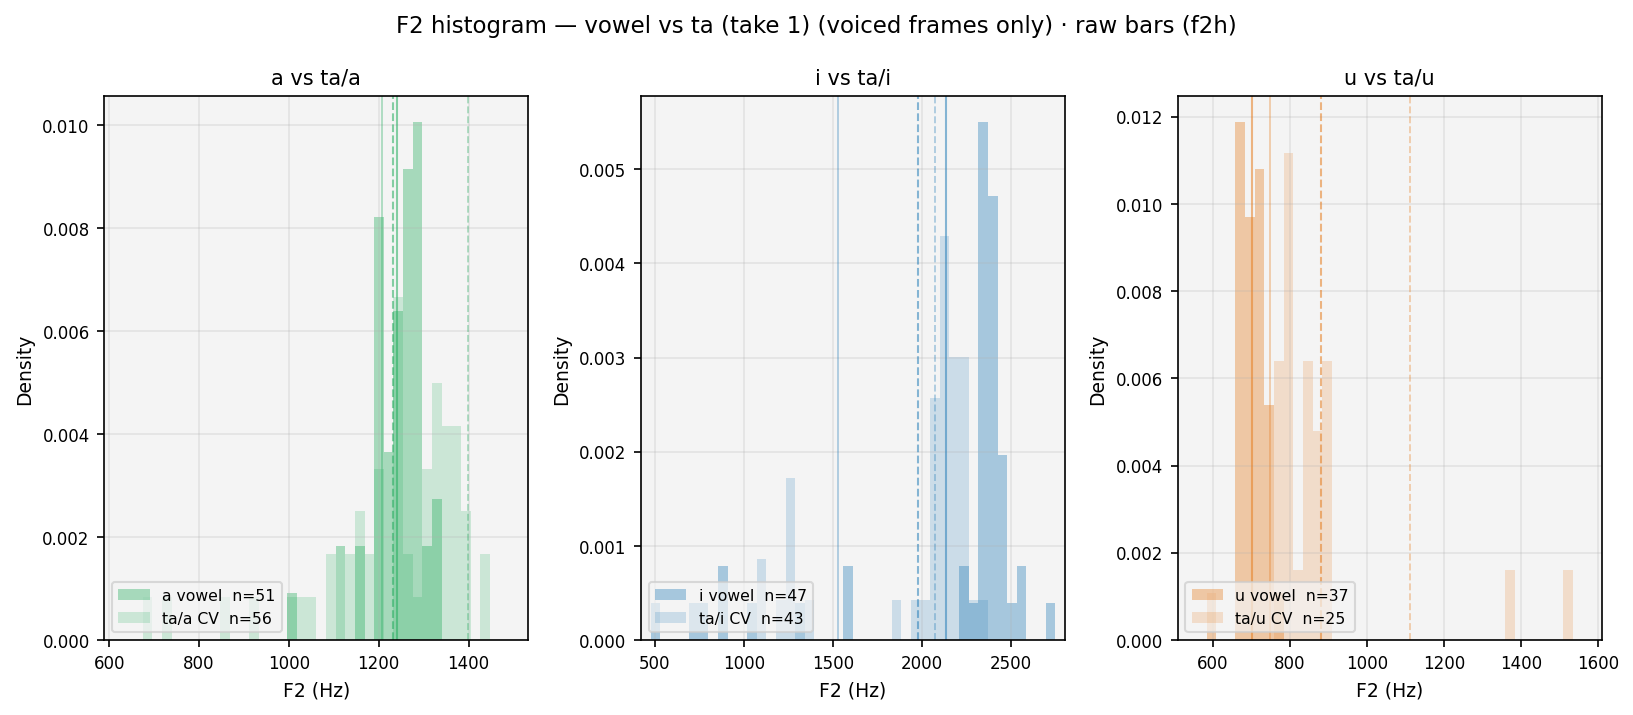
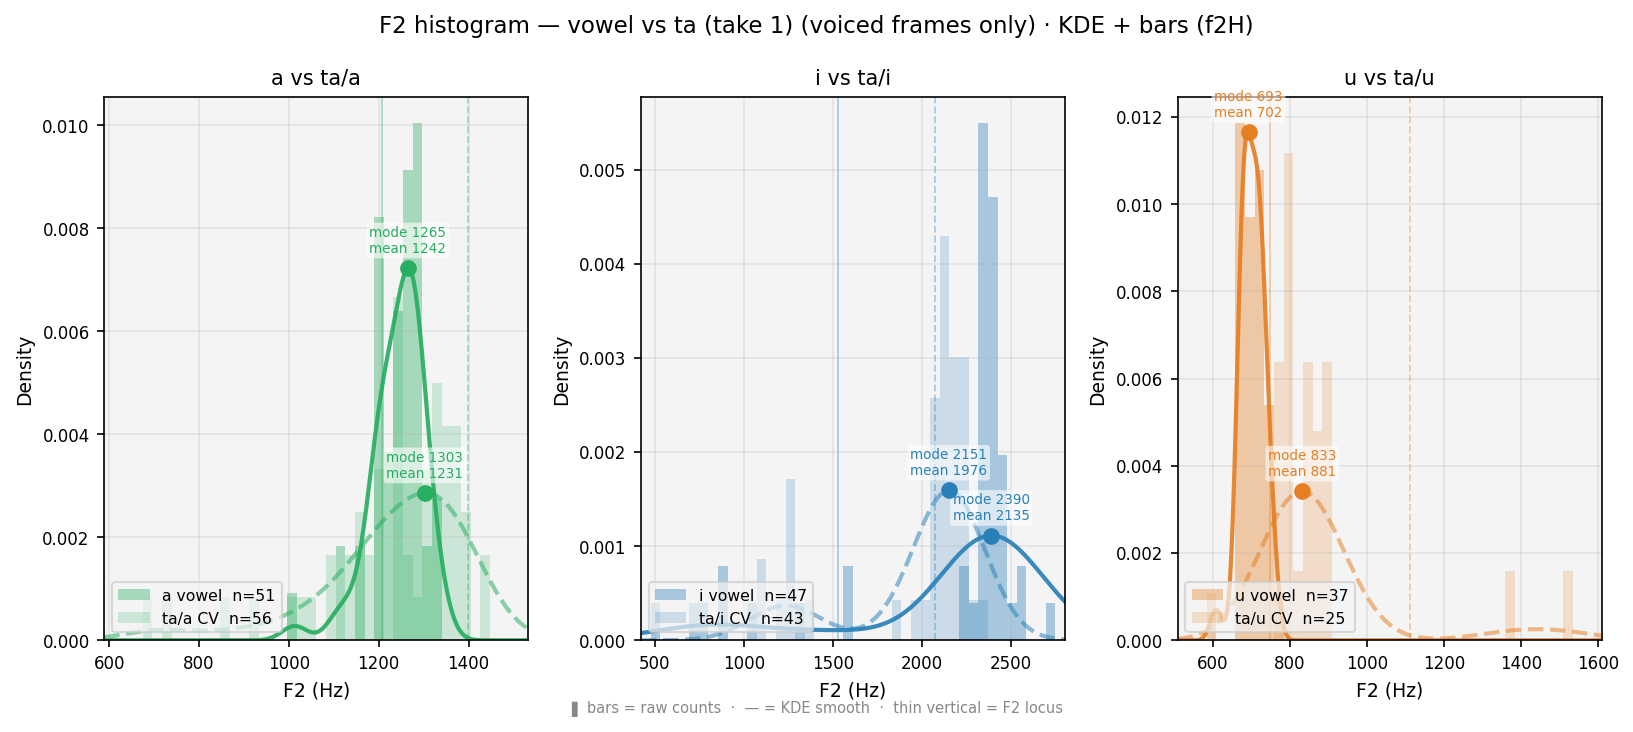
F2 smoothed histogram — vowel (solid) vs CV (dashed). ● = primary peak (mode, most frequent F2). ■ = secondary peak (smaller square). Thin verticals = F2 locus (F2 at voicing onset). Shift between curves = coarticulation. Locus stability across a/i/u contexts characterises the consonant.
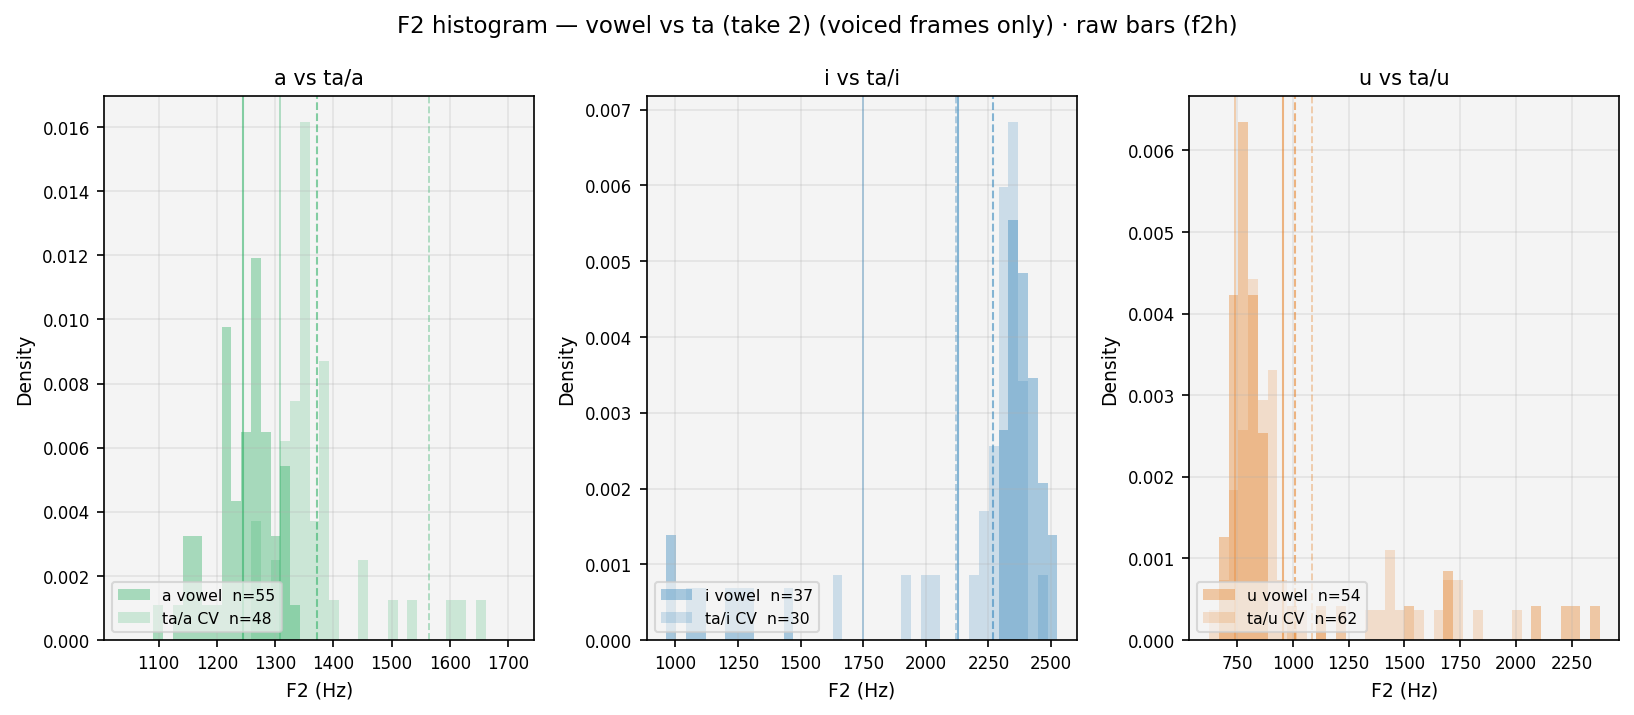
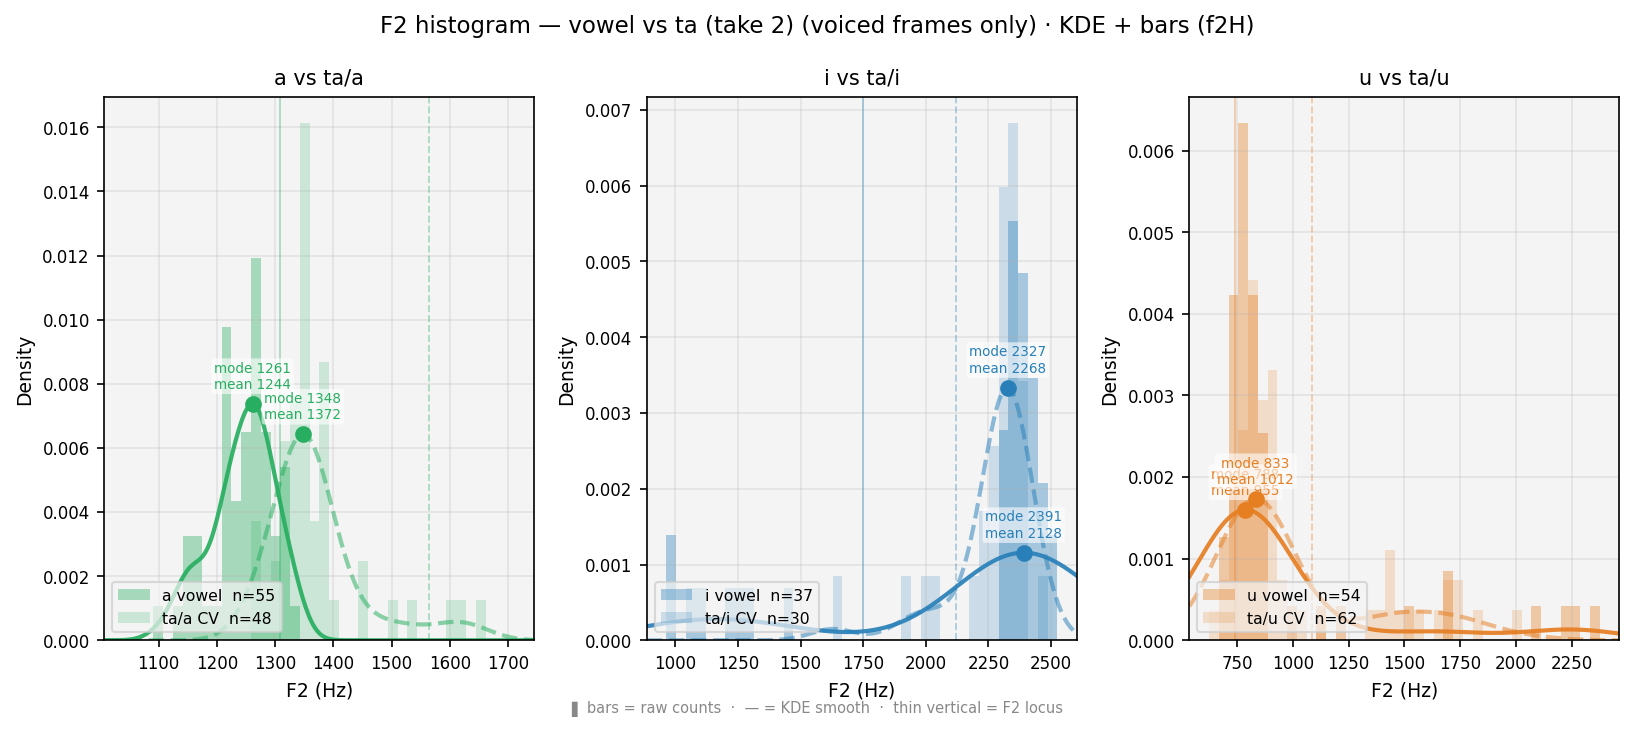
F2 smoothed histogram — vowel (solid) vs CV (dashed). ● = primary peak (mode, most frequent F2). ■ = secondary peak (smaller square). Thin verticals = F2 locus (F2 at voicing onset). Shift between curves = coarticulation. Locus stability across a/i/u contexts characterises the consonant.
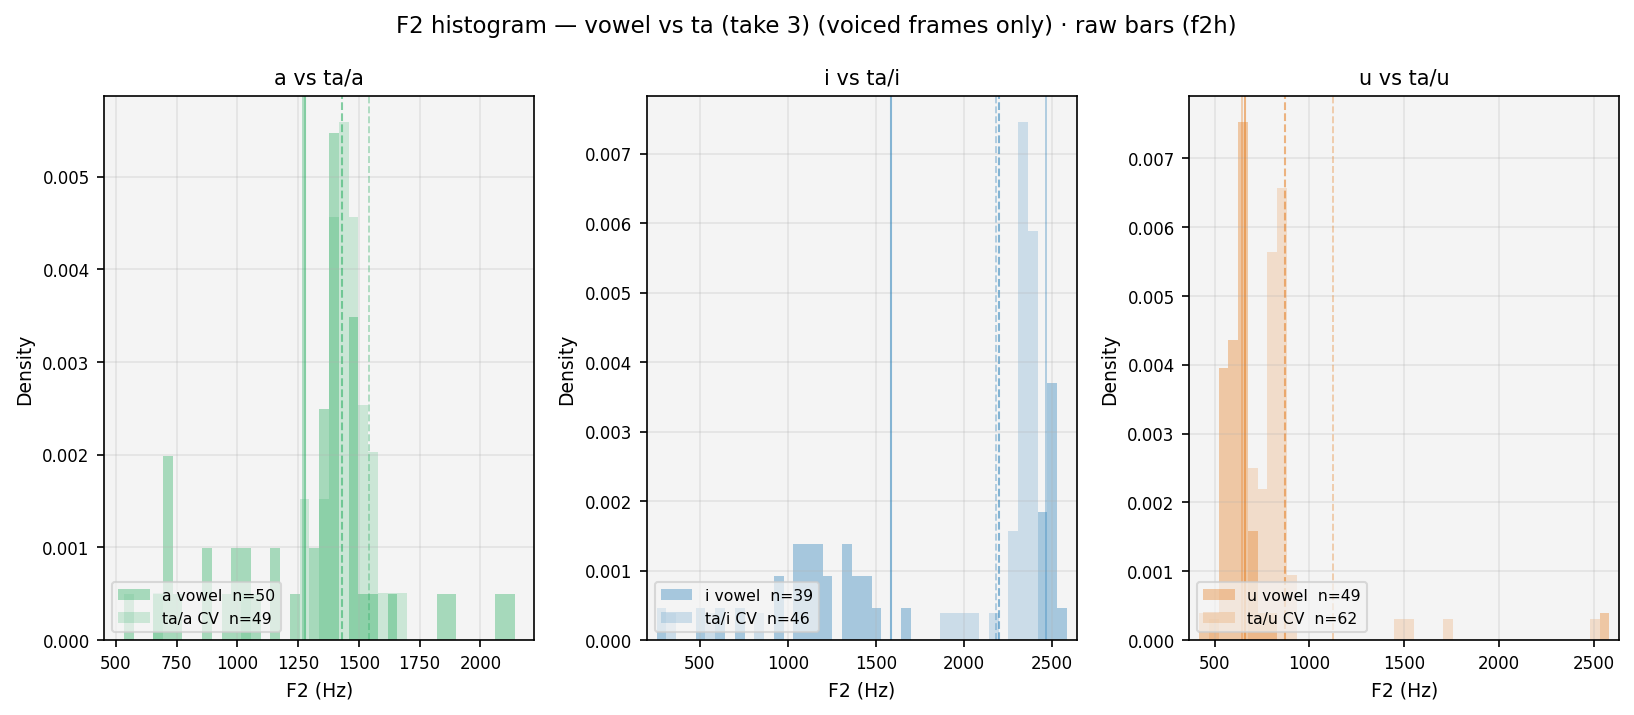
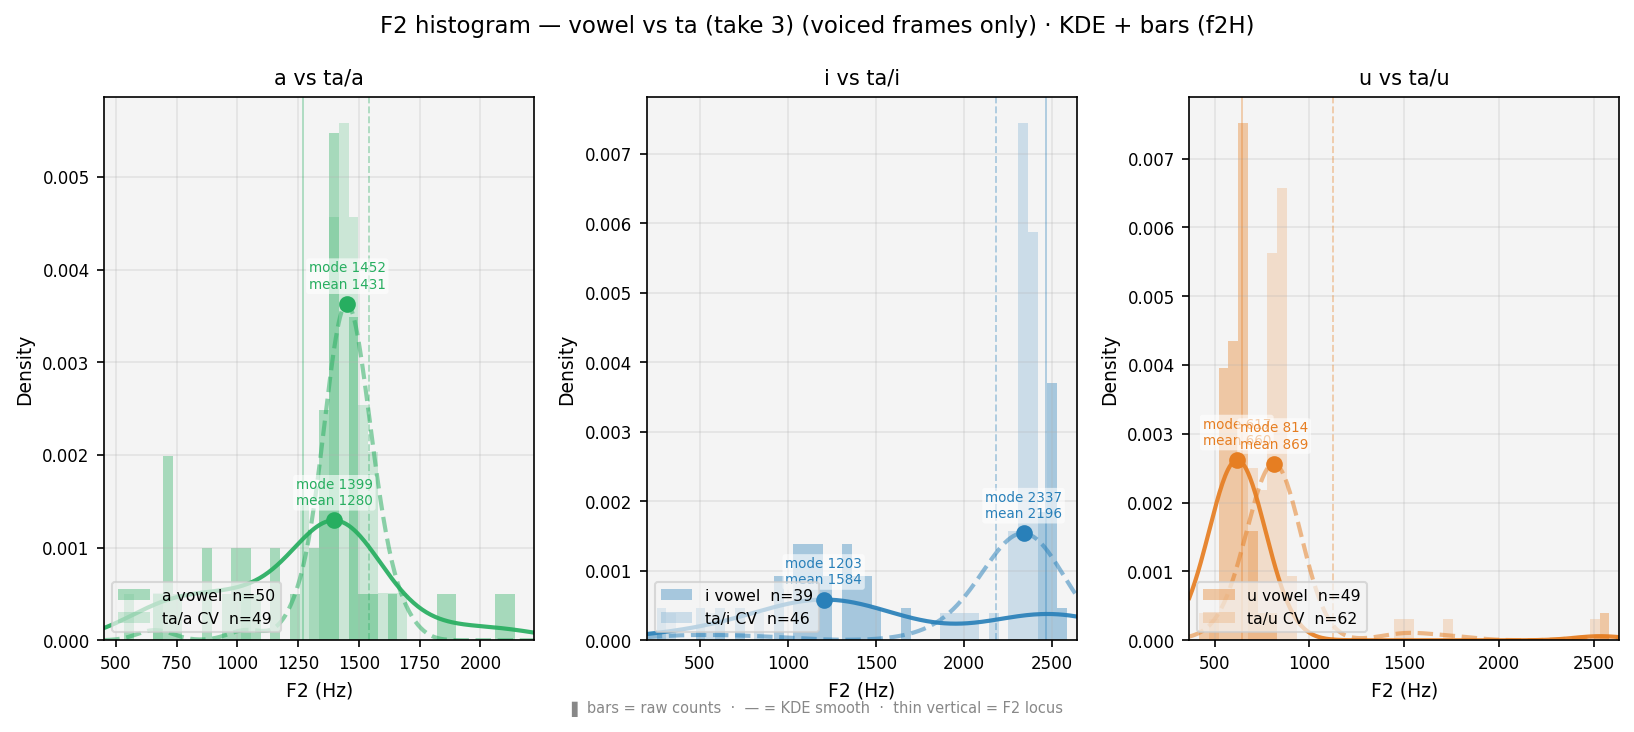
F2 smoothed histogram — vowel (solid) vs CV (dashed). ● = primary peak (mode, most frequent F2). ■ = secondary peak (smaller square). Thin verticals = F2 locus (F2 at voicing onset). Shift between curves = coarticulation. Locus stability across a/i/u contexts characterises the consonant.
| Metric — tȧ (Dental) | a context | i context | u context | mean ± σ (क् estimate) |
|---|---|---|---|---|
| Pitch gap / burst (ms) | 18 | 24 | 24 | 22 ±3 |
| Pitch/F0 primary peak (Hz) | 95 | 132 | 140 | 122 ±19 |
| Pitch/F0 secondary peak (Hz) | 129 | 105 | — | 117 ±12 |
| ΔF0 secondary−primary (Hz) | 33 | -26 | — | 3 ±30 |
| F2 locus at voicing onset (Hz) | 1495 | 2276 | 1149 | 1640 ±472 |
| F2 steady-state / vowel (Hz) | 1802 | 2159 | 1796 | 1919 ±170 |
| Reference vowels — no consonant onset: | ||||
| a (pure vowel) | Pitch/F0 mean 107 Hz · F2 locus 1169 Hz · F2 steady 1946 Hz | — | ||
| i (pure vowel) | Pitch/F0 mean 109 Hz · F2 locus 2506 Hz · F2 steady 2058 Hz | — | ||
| u (pure vowel) | Pitch/F0 mean 114 Hz · F2 locus 647 Hz · F2 steady 1814 Hz | — | ||
| Metric — tȧ (Dental) | a context | i context | u context | mean ± σ (क् estimate) |
|---|---|---|---|---|
| Pitch gap / burst (ms) | 0 | 20 | 26 | 15 ±11 |
| Pitch/F0 primary peak (Hz) | 173 | 222 | 195 | 197 ±20 |
| Pitch/F0 secondary peak (Hz) | 230 | 166 | — | 198 ±32 |
| ΔF0 secondary−primary (Hz) | 56 | -56 | — | -0 ±56 |
| F2 locus at voicing onset (Hz) | 1399 | 2074 | 1112 | 1529 ±403 |
| F2 steady-state / vowel (Hz) | 1241 | 1752 | 821 | 1271 ±381 |
| Reference vowels — no consonant onset: | ||||
| a (pure vowel) | Pitch/F0 mean 187 Hz · F2 locus 1207 Hz · F2 steady 1270 Hz | — | ||
| i (pure vowel) | Pitch/F0 mean 188 Hz · F2 locus 1529 Hz · F2 steady 1895 Hz | — | ||
| u (pure vowel) | Pitch/F0 mean 174 Hz · F2 locus 748 Hz · F2 steady 703 Hz | — | ||
| Metric — tȧ (Dental) | a context | i context | u context | mean ± σ (क् estimate) |
|---|---|---|---|---|
| Pitch gap / burst (ms) | 3 | 0 | 3 | 2 ±1 |
| Pitch/F0 primary peak (Hz) | 153 | 172 | 205 | 177 ±21 |
| Pitch/F0 secondary peak (Hz) | — | — | — | — |
| ΔF0 secondary−primary (Hz) | — | — | — | — |
| F2 locus at voicing onset (Hz) | 1564 | 2121 | 1086 | 1590 ±423 |
| F2 steady-state / vowel (Hz) | 1342 | 2349 | 1177 | 1623 ±518 |
| Reference vowels — no consonant onset: | ||||
| a (pure vowel) | Pitch/F0 mean 177 Hz · F2 locus 1308 Hz · F2 steady 1225 Hz | — | ||
| i (pure vowel) | Pitch/F0 mean 151 Hz · F2 locus 1750 Hz · F2 steady 1954 Hz | — | ||
| u (pure vowel) | Pitch/F0 mean 105 Hz · F2 locus 739 Hz · F2 steady 1205 Hz | — | ||
| Metric — tȧ (Dental) | a context | i context | u context | mean ± σ (क् estimate) |
|---|---|---|---|---|
| Pitch gap / burst (ms) | 11 | 23 | 8 | 14 ±6 |
| Pitch/F0 primary peak (Hz) | 146 | 161 | 179 | 162 ±13 |
| Pitch/F0 secondary peak (Hz) | — | — | — | — |
| ΔF0 secondary−primary (Hz) | — | — | — | — |
| F2 locus at voicing onset (Hz) | 1540 | 2183 | 1122 | 1615 ±436 |
| F2 steady-state / vowel (Hz) | 1452 | 2074 | 839 | 1455 ±504 |
| Reference vowels — no consonant onset: | ||||
| a (pure vowel) | Pitch/F0 mean 140 Hz · F2 locus 1271 Hz · F2 steady 1273 Hz | — | ||
| i (pure vowel) | Pitch/F0 mean 165 Hz · F2 locus 2466 Hz · F2 steady 1254 Hz | — | ||
| u (pure vowel) | Pitch/F0 mean 151 Hz · F2 locus 644 Hz · F2 steady 711 Hz | — | ||
प pa · Labial · Oshtya ⠿ drag sections to reorder · 👁 toggle visibility
| TTS — Wavenet-B | |||
|---|---|---|---|
| Vowel | a | i | u |
| CV | pa | pi | pu |
| Human — take 1 | |||
|---|---|---|---|
| Vowel | a | i | u |
| CV | pa/a | pa/i | pa/u |
| Human — take 2 | |||
|---|---|---|---|
| Vowel | a | i | u |
| CV | pa/a | pa/i | pa/u |
| Human — take 3 | |||
|---|---|---|---|
| Vowel | a | i | u |
| CV | pa/a | pa/i | pa/u |
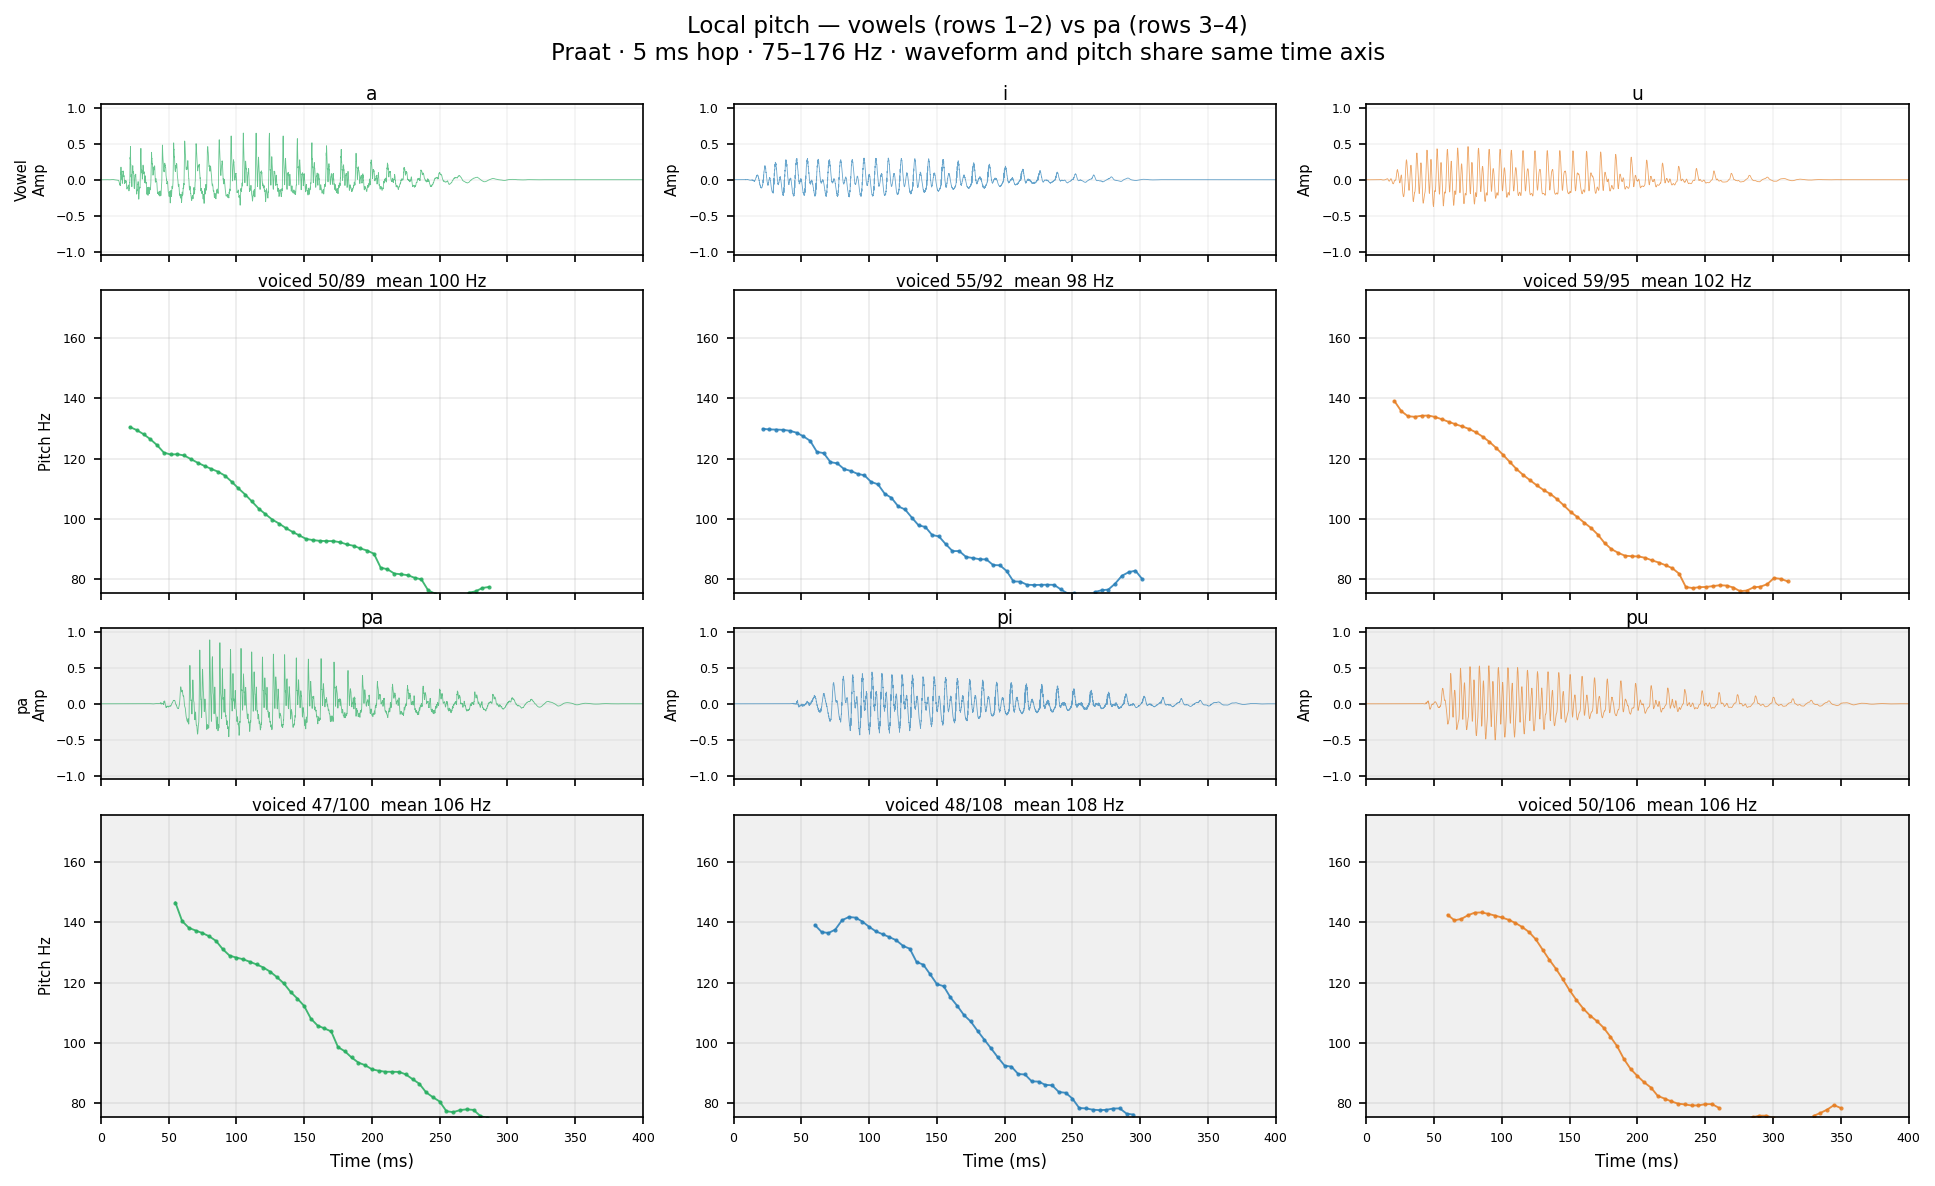
Local pitch (Prof's view): Praat autocorrelation at 5 ms hop, 75–500 Hz range, no voiced/unvoiced separation — gaps only at true silence. Matches Praat's "local pitch plot." Finer time step shows rapid micro-variation in pitch; vowels show relatively flat regions; burst/transitions show gaps or jumps. Compare with the Pitch/IF panel below (10 ms hop, voiced-only, with IF overlay).
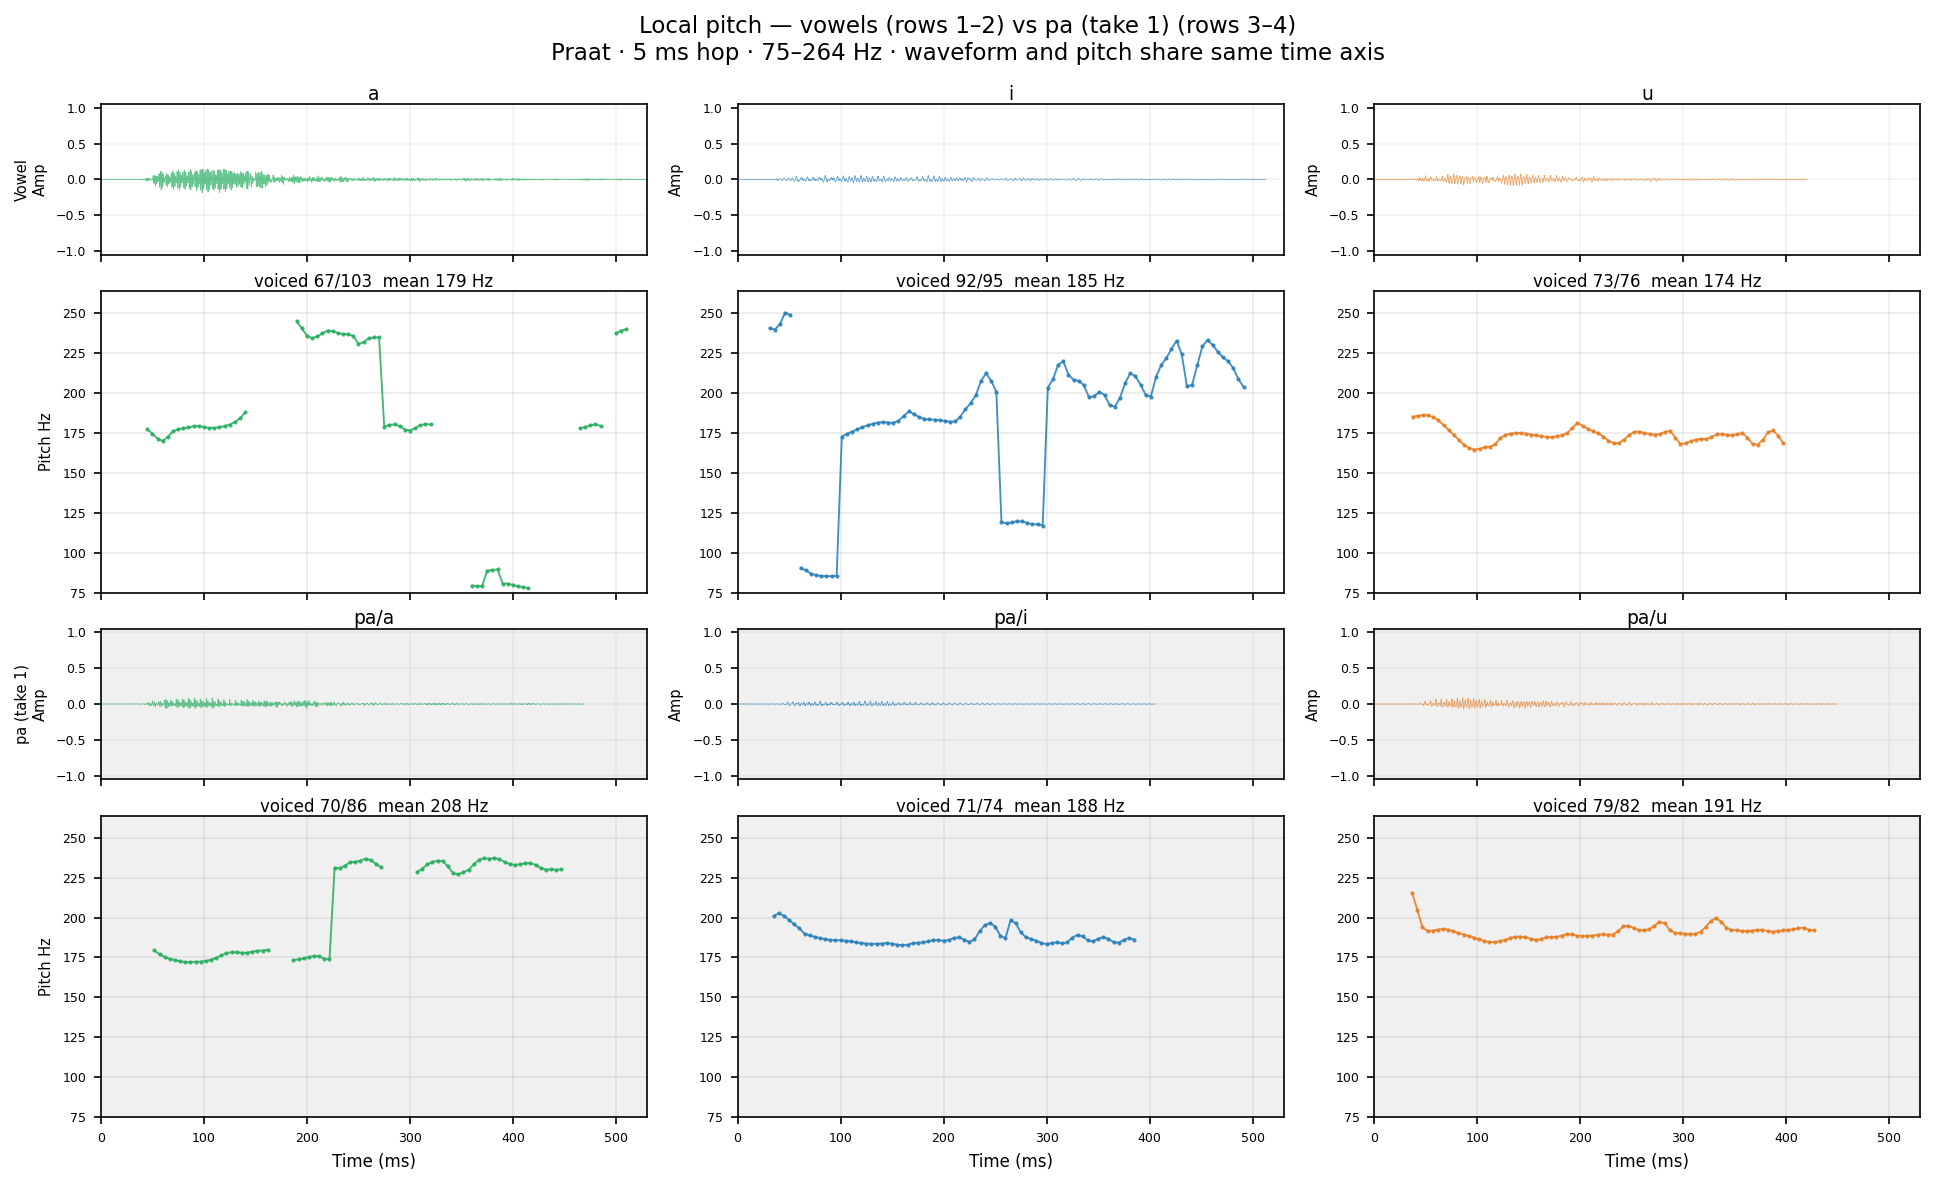
Human take 1 Same Praat settings as TTS. Compare burst gap duration and F0 onset.
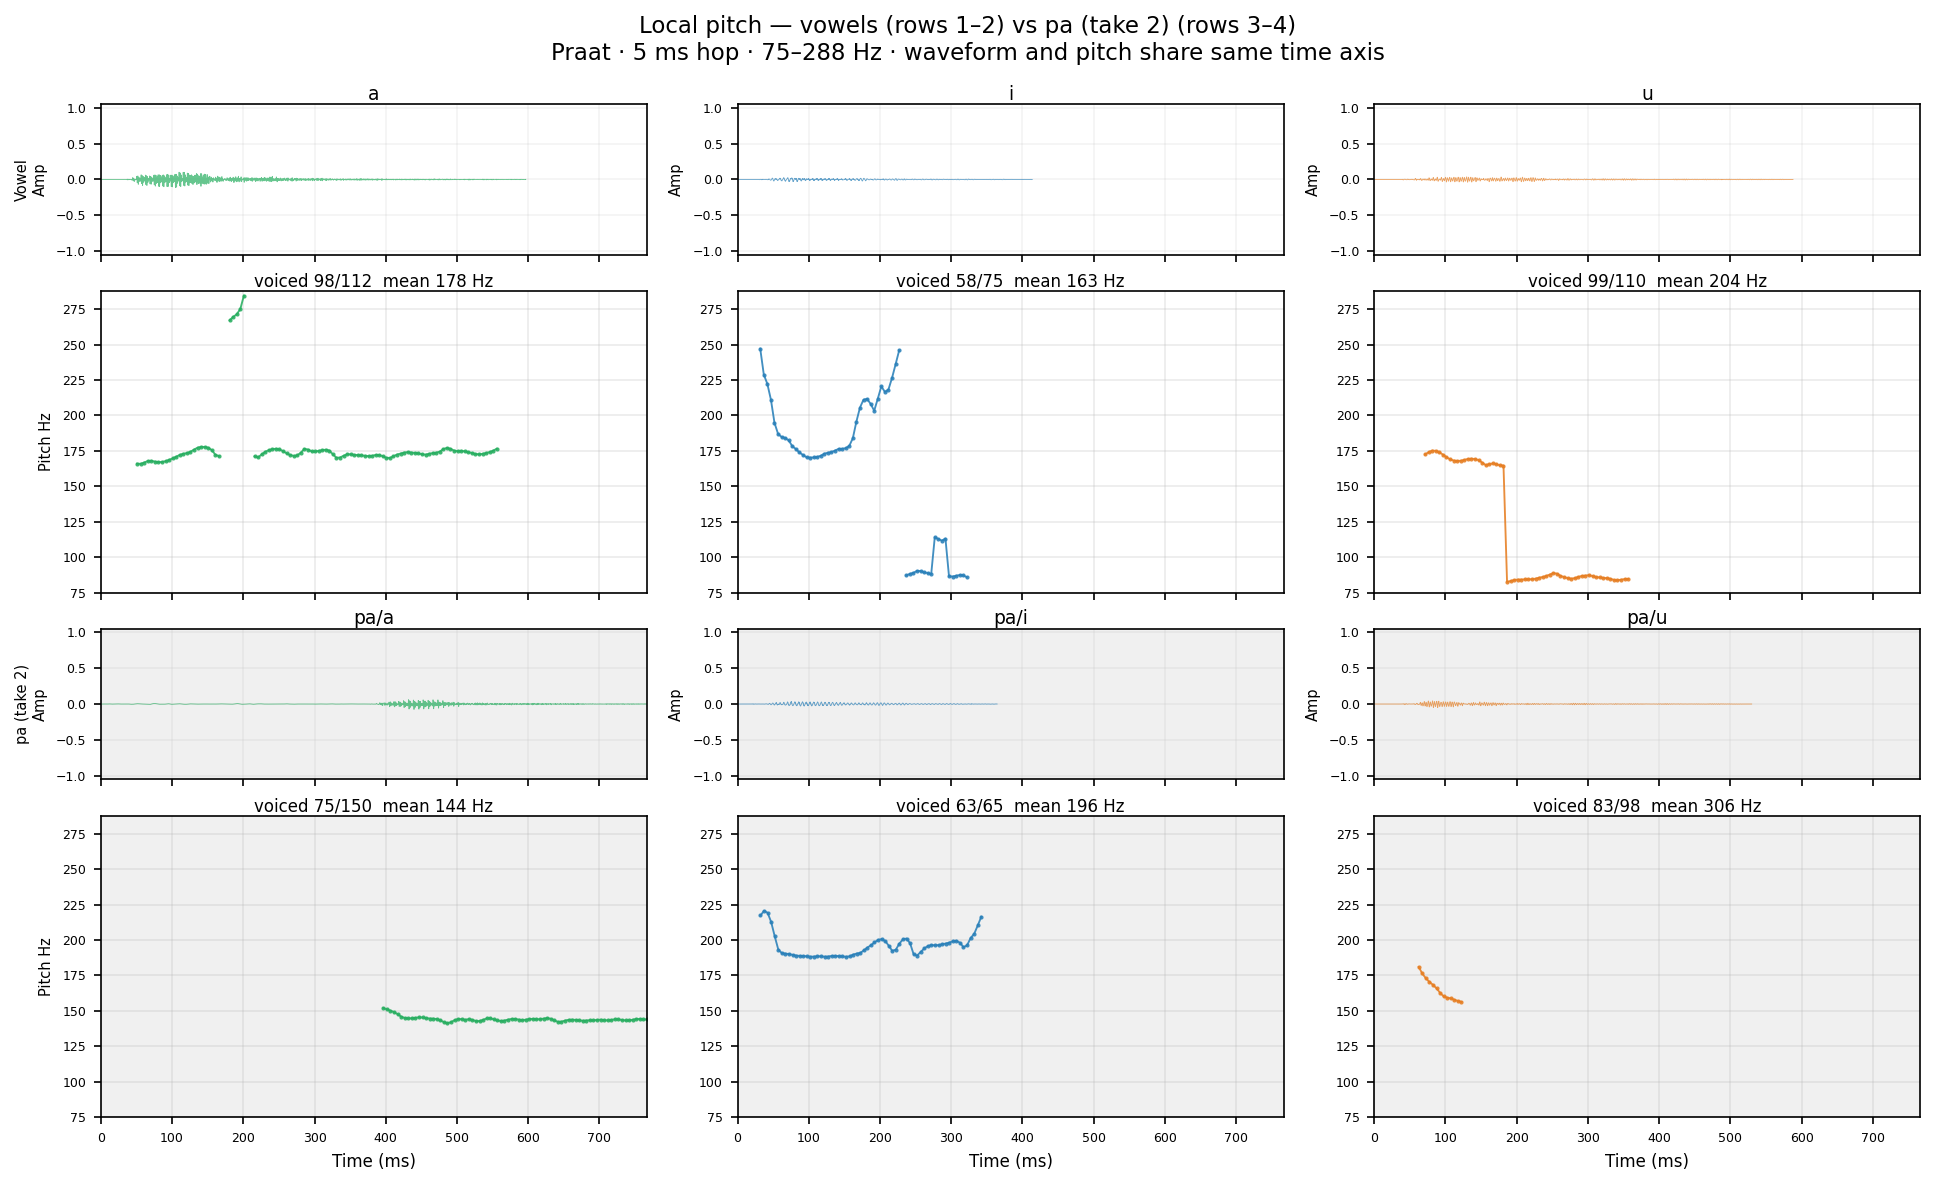
Human take 2 Same Praat settings as TTS. Compare burst gap duration and F0 onset.
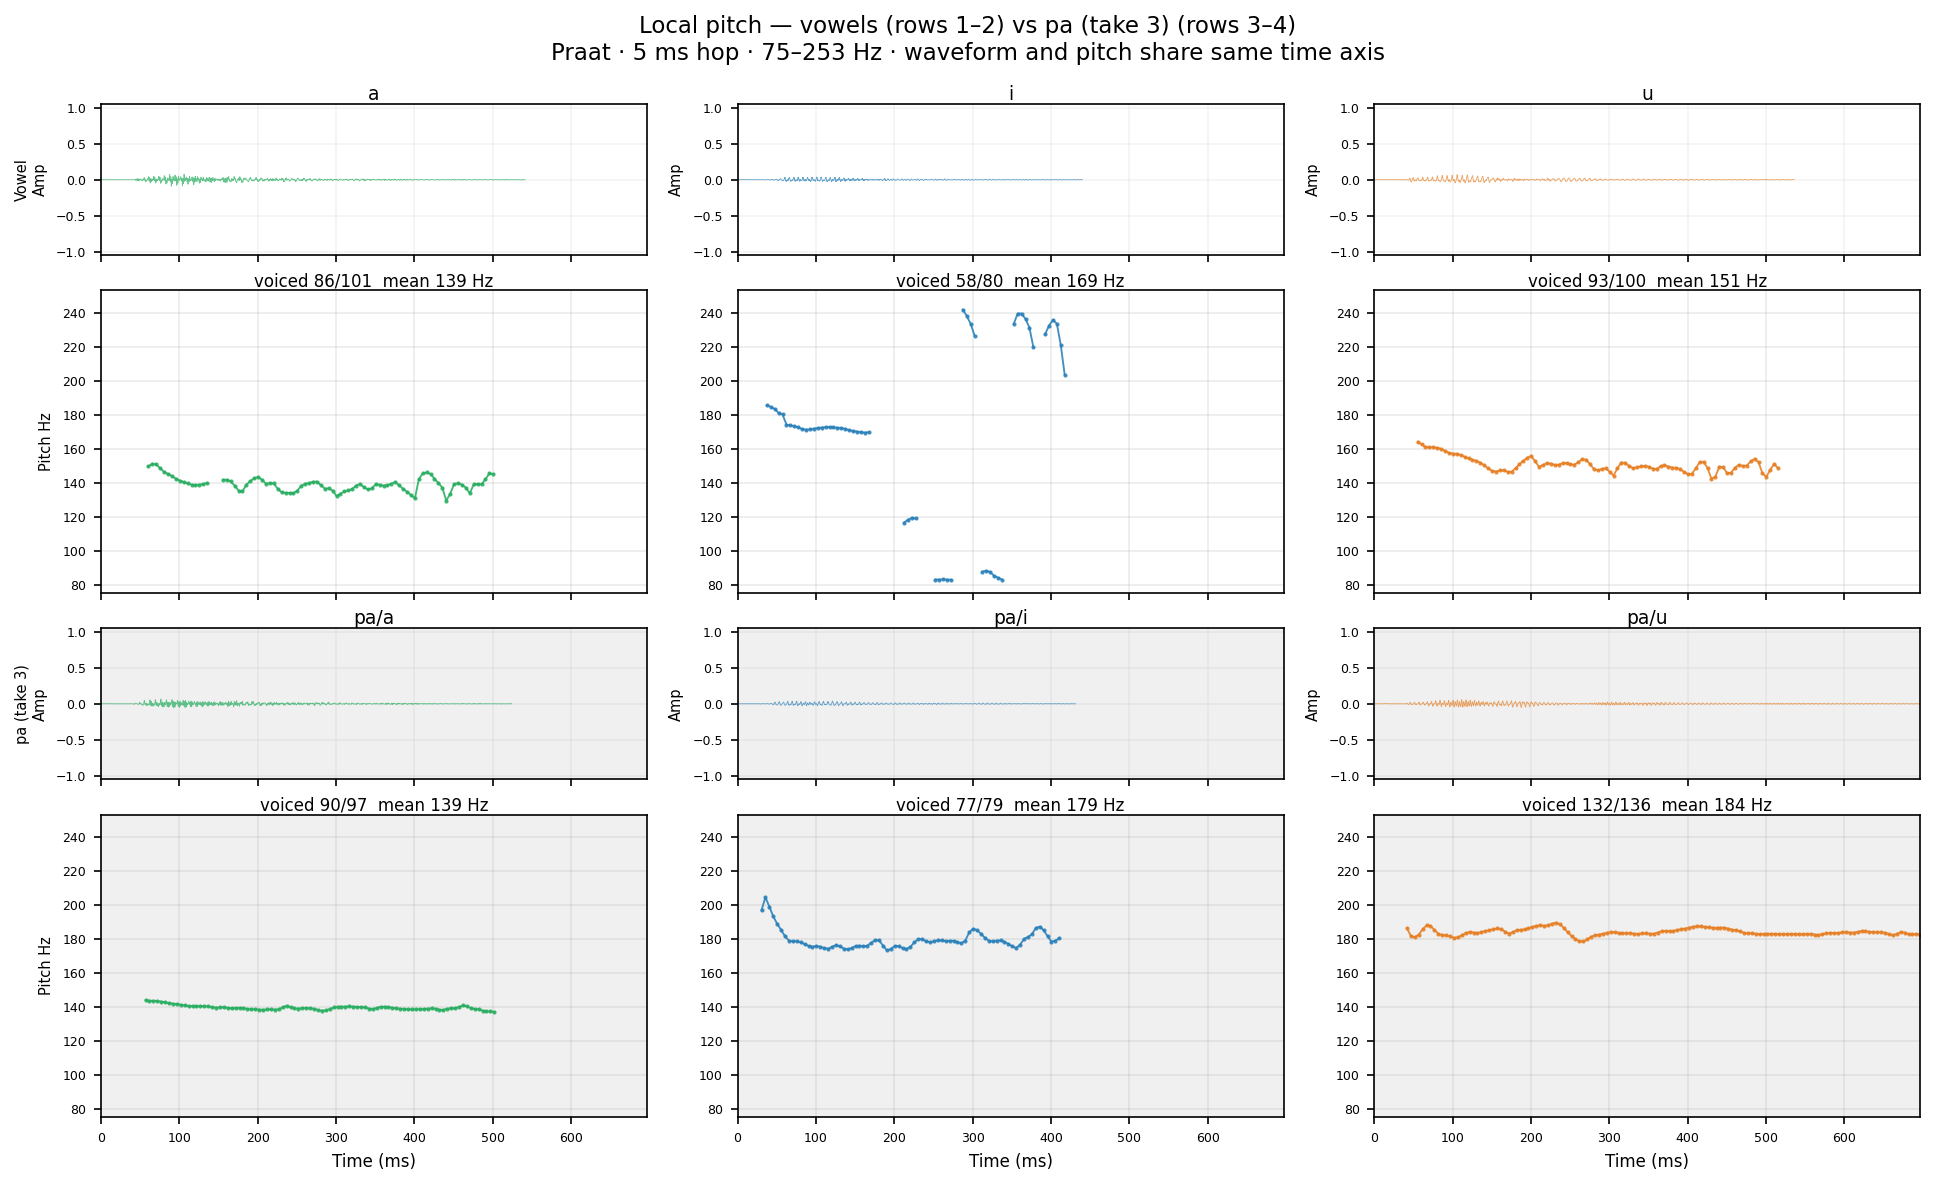
Human take 3 Same Praat settings as TTS. Compare burst gap duration and F0 onset.
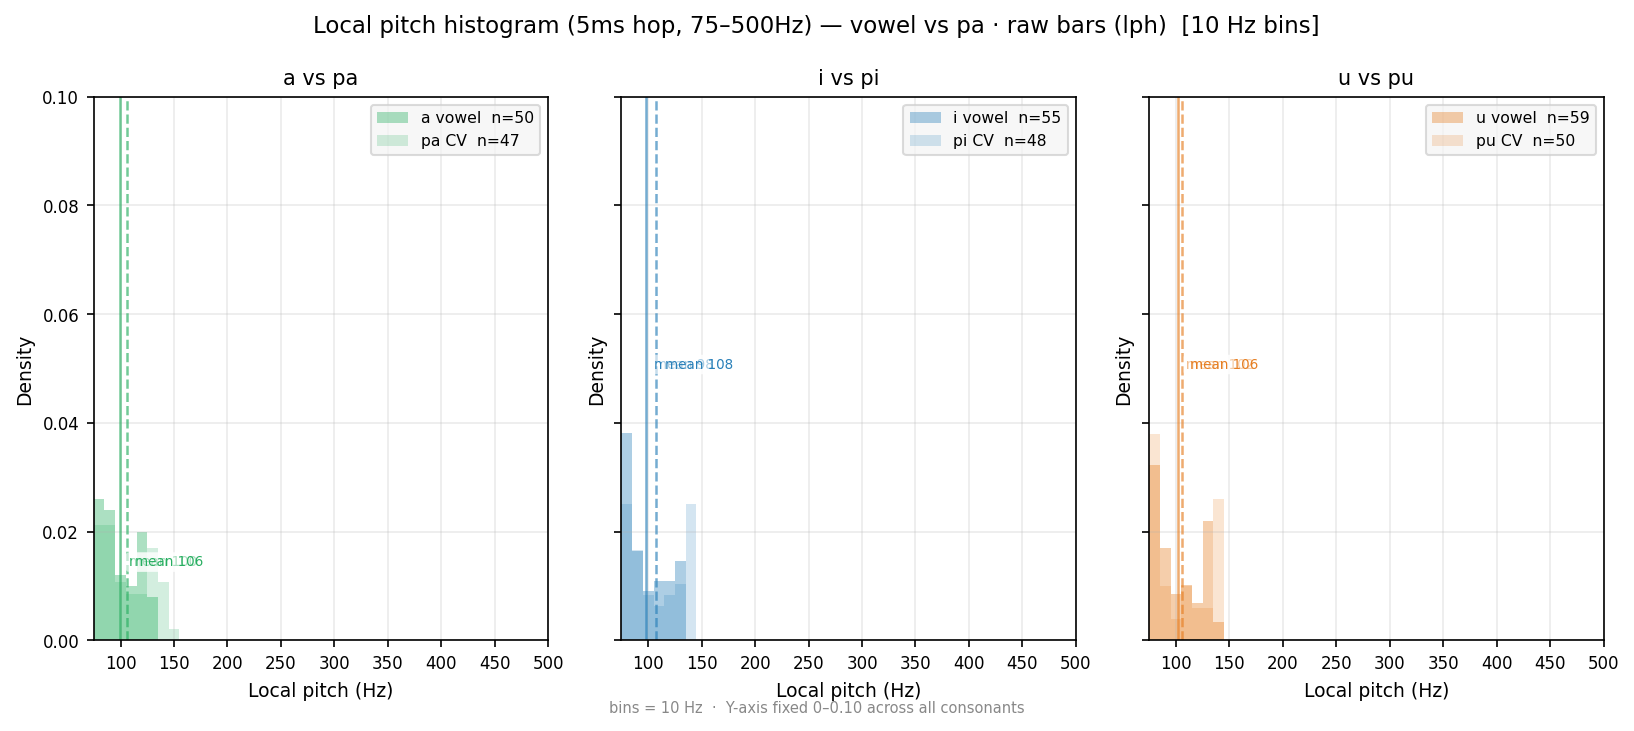
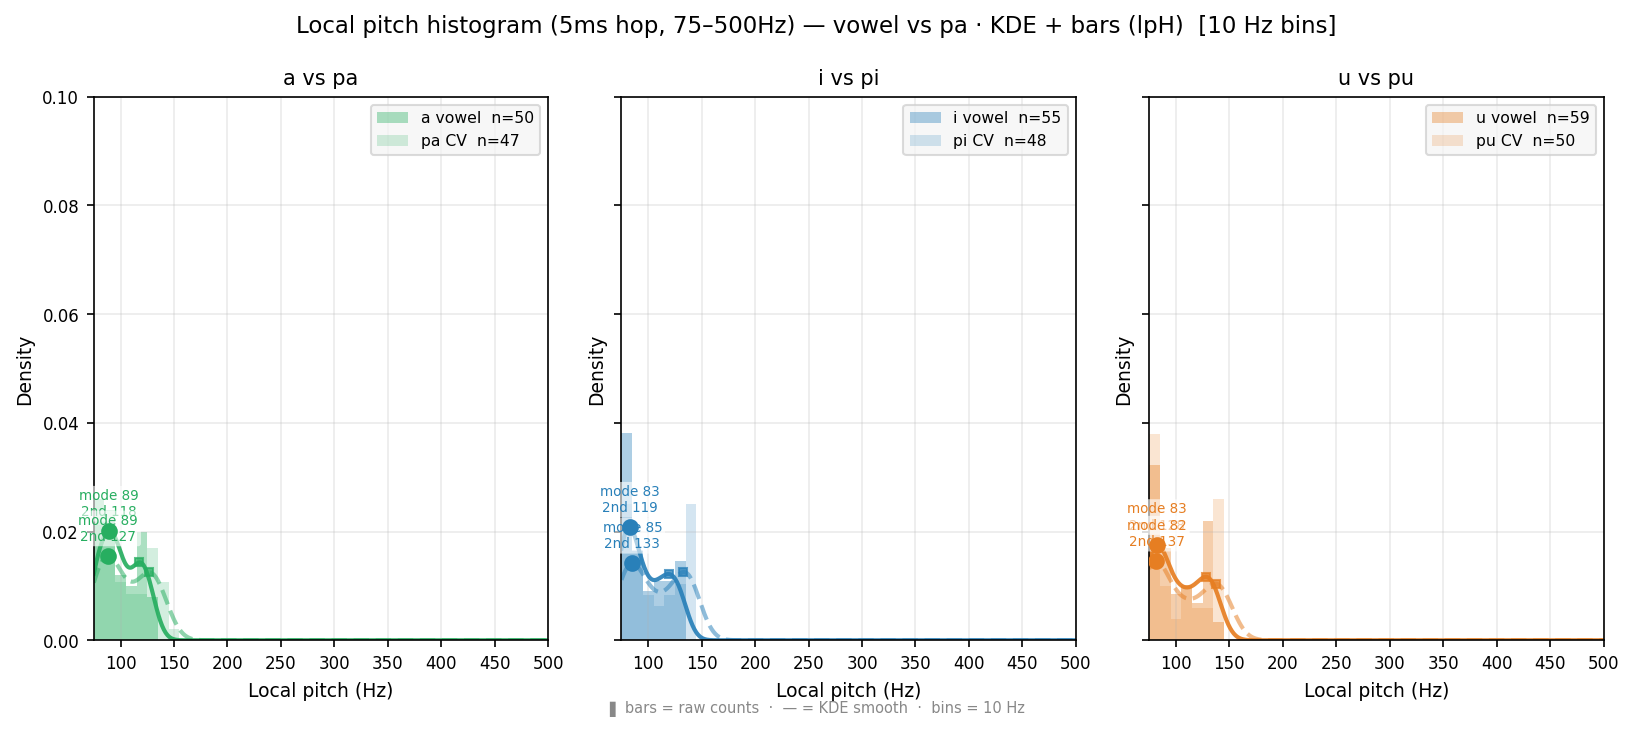
Local pitch (5ms hop, 75–500Hz) histogram — wider range than Pitch/F0 distribution (10ms, 75–300Hz). lpH = alpha bars + KDE smooth: readable peaks, secondary bump visible. lph = raw bars: unsmoothed, honest bin counts. Primary ● and secondary ■ peaks marked on KDE curve (lpH only). Wider X-axis (to 500Hz) may reveal F1 leakage for /i/ /u/ above 300Hz. Compare with Pitch/F0 distribution below for time-step and frequency-range effect.
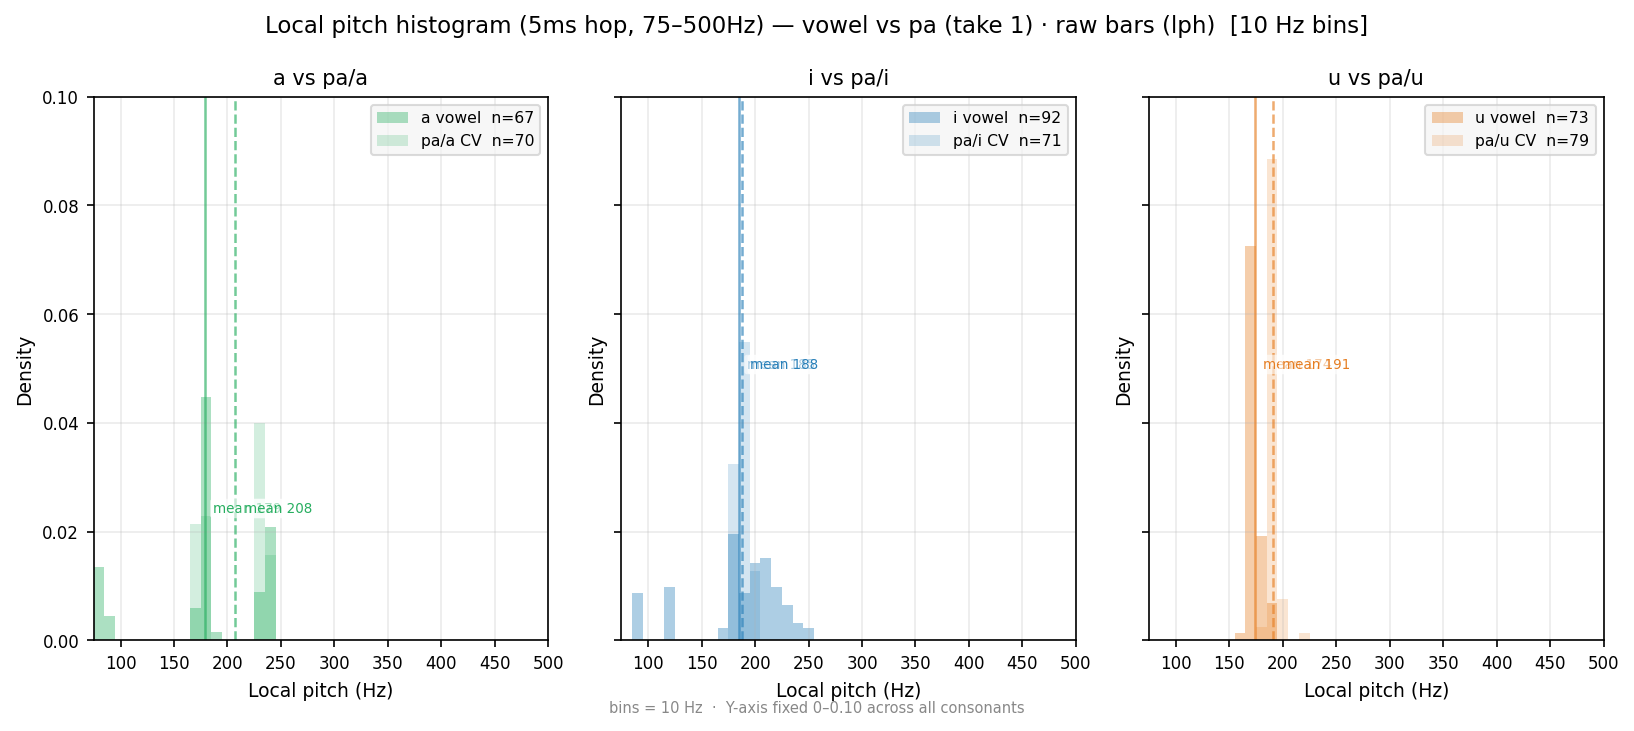
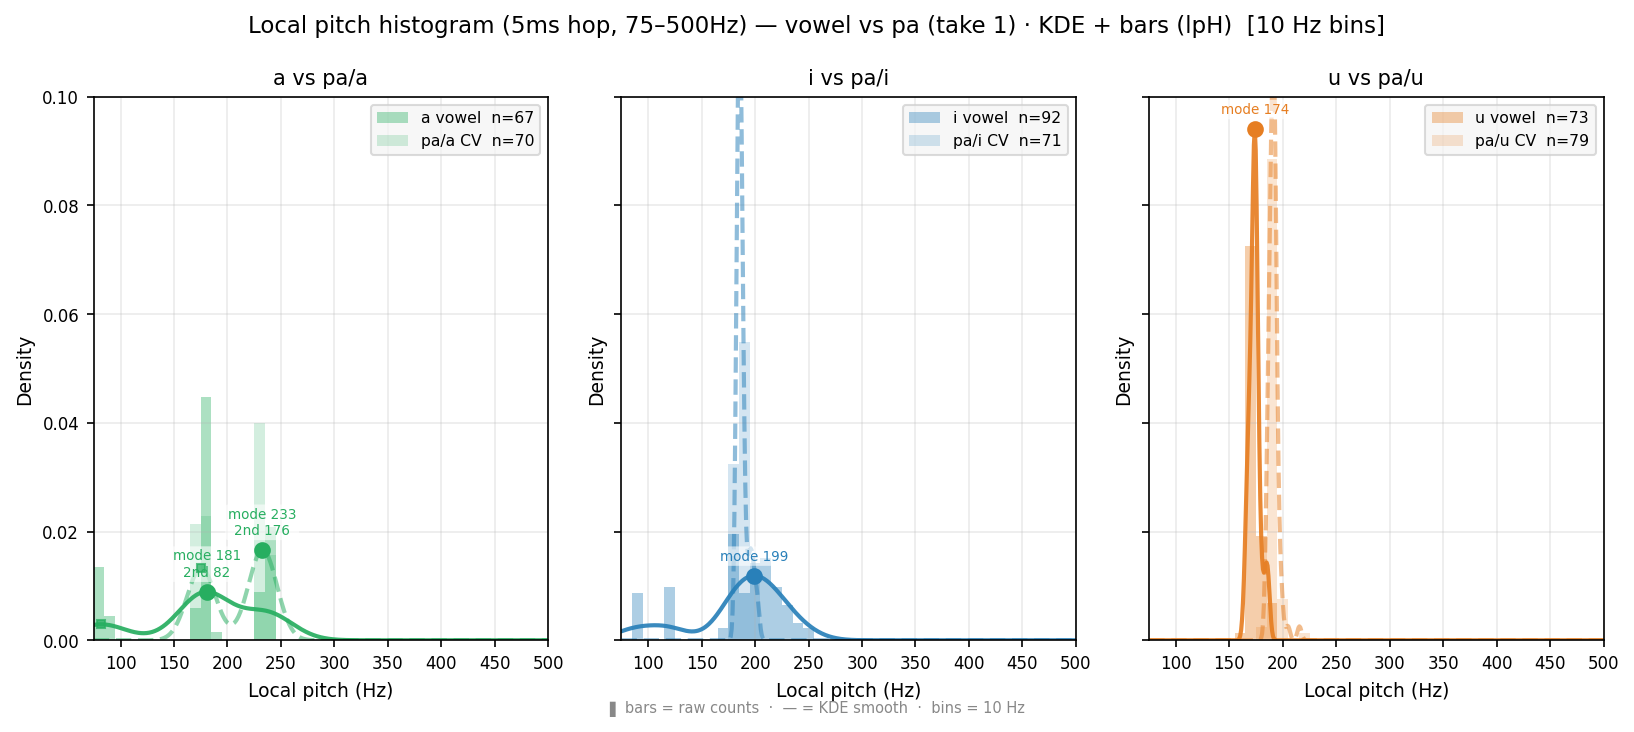
Local pitch (5ms hop, 75–500Hz) histogram — wider range than Pitch/F0 distribution (10ms, 75–300Hz). lpH = alpha bars + KDE smooth: readable peaks, secondary bump visible. lph = raw bars: unsmoothed, honest bin counts. Primary ● and secondary ■ peaks marked on KDE curve (lpH only). Wider X-axis (to 500Hz) may reveal F1 leakage for /i/ /u/ above 300Hz. Compare with Pitch/F0 distribution below for time-step and frequency-range effect.
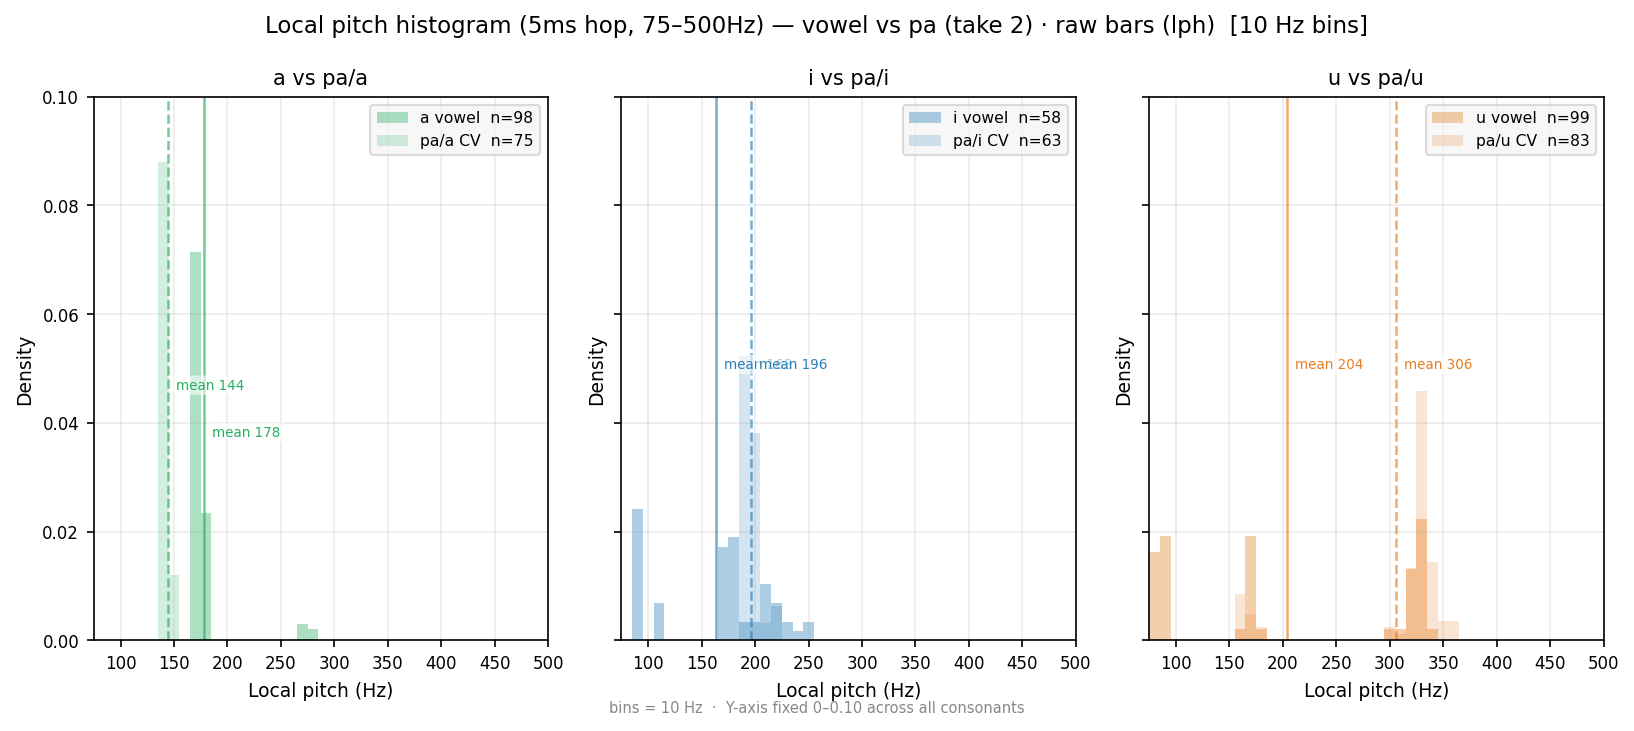
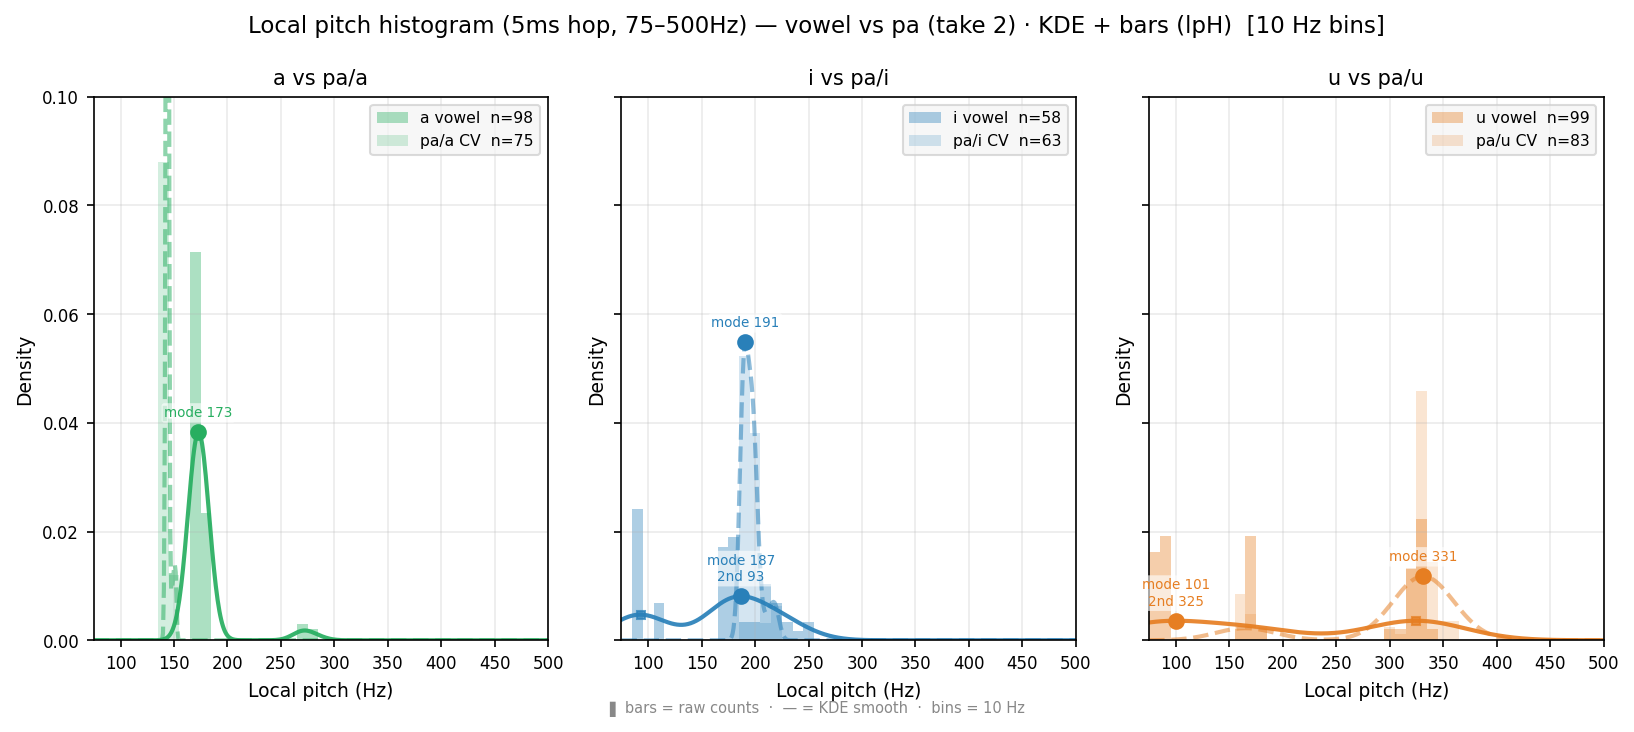
Local pitch (5ms hop, 75–500Hz) histogram — wider range than Pitch/F0 distribution (10ms, 75–300Hz). lpH = alpha bars + KDE smooth: readable peaks, secondary bump visible. lph = raw bars: unsmoothed, honest bin counts. Primary ● and secondary ■ peaks marked on KDE curve (lpH only). Wider X-axis (to 500Hz) may reveal F1 leakage for /i/ /u/ above 300Hz. Compare with Pitch/F0 distribution below for time-step and frequency-range effect.
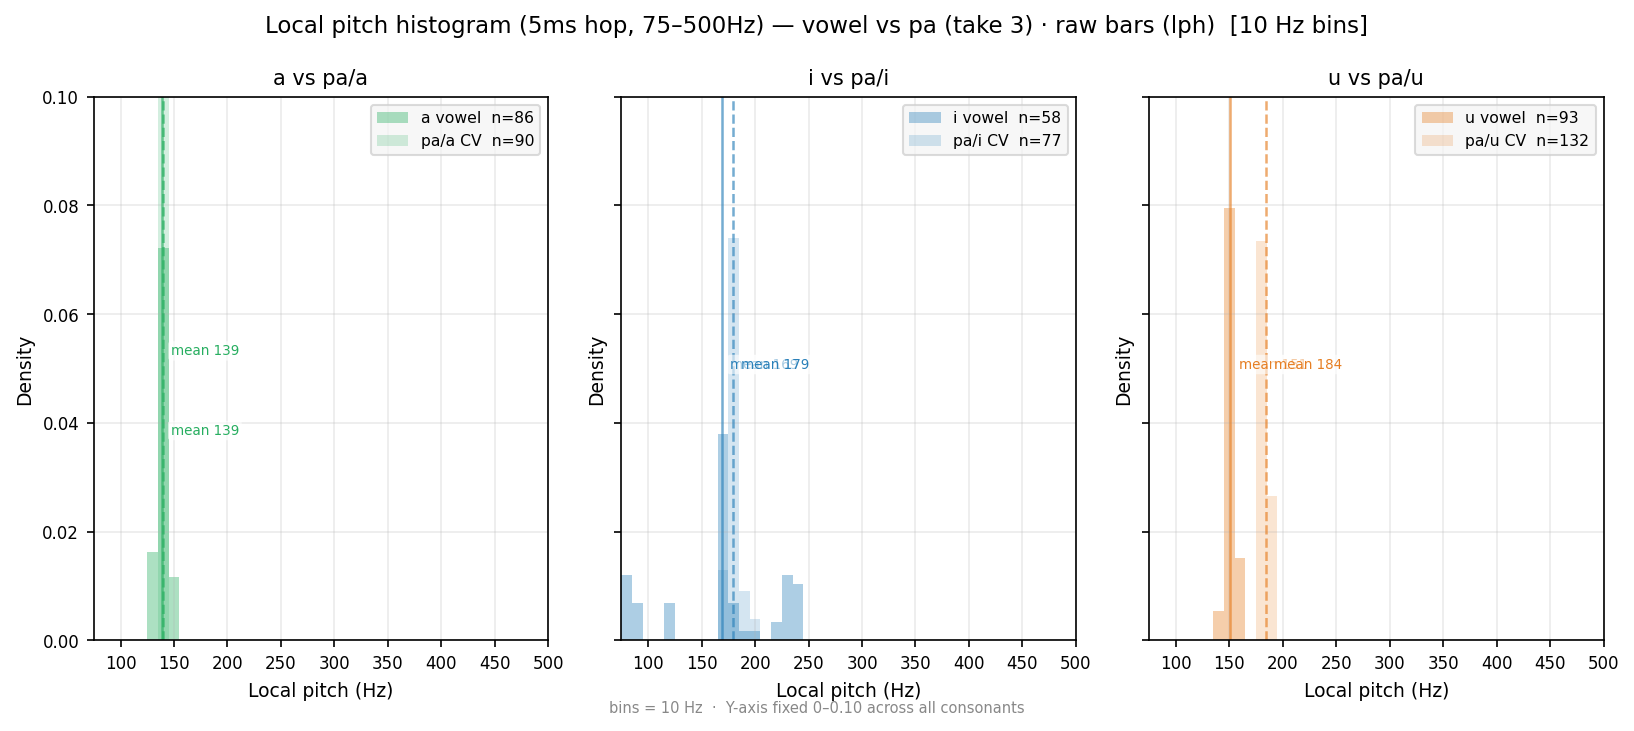
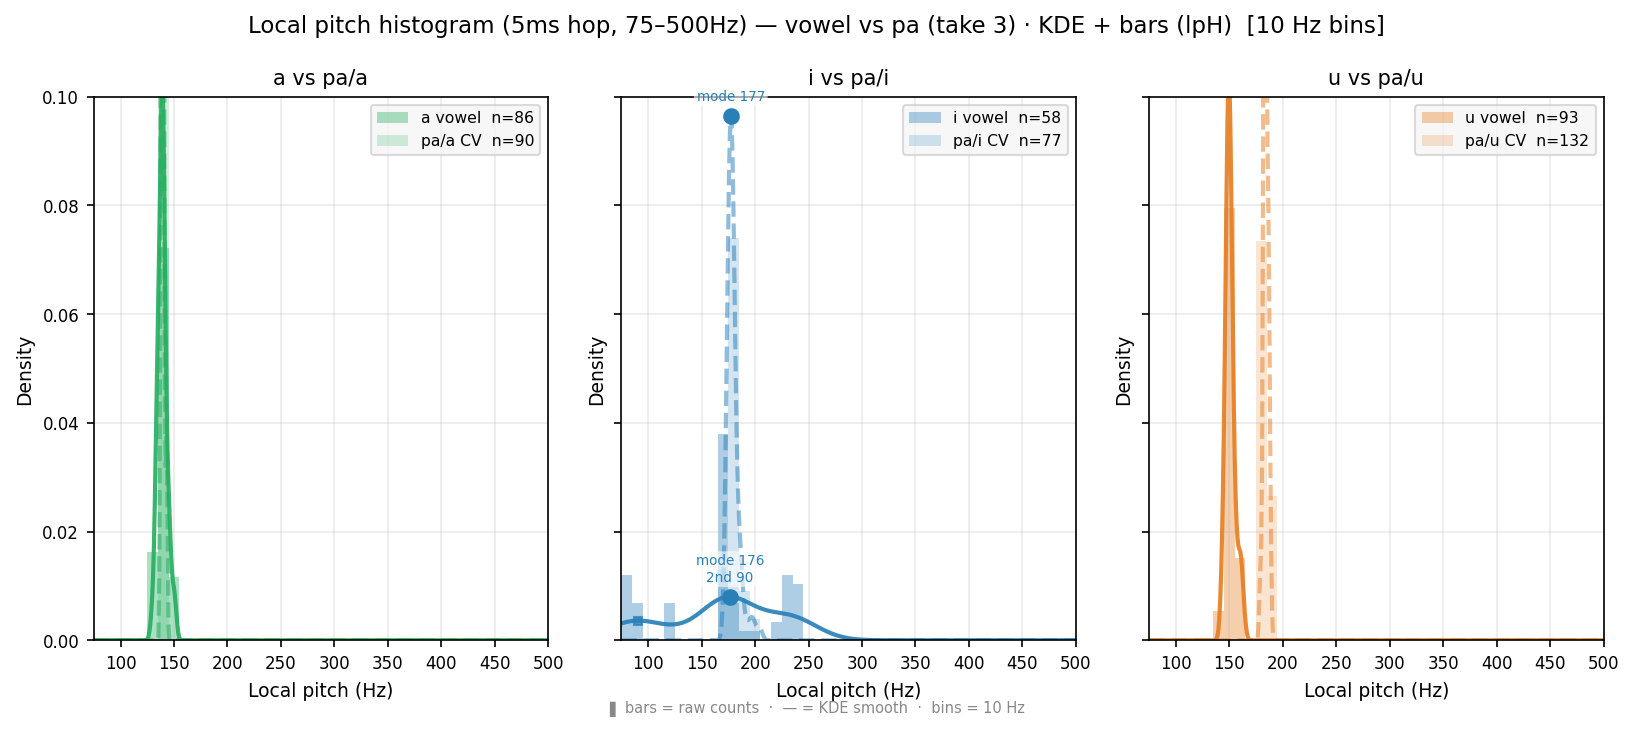
Local pitch (5ms hop, 75–500Hz) histogram — wider range than Pitch/F0 distribution (10ms, 75–300Hz). lpH = alpha bars + KDE smooth: readable peaks, secondary bump visible. lph = raw bars: unsmoothed, honest bin counts. Primary ● and secondary ■ peaks marked on KDE curve (lpH only). Wider X-axis (to 500Hz) may reveal F1 leakage for /i/ /u/ above 300Hz. Compare with Pitch/F0 distribution below for time-step and frequency-range effect.
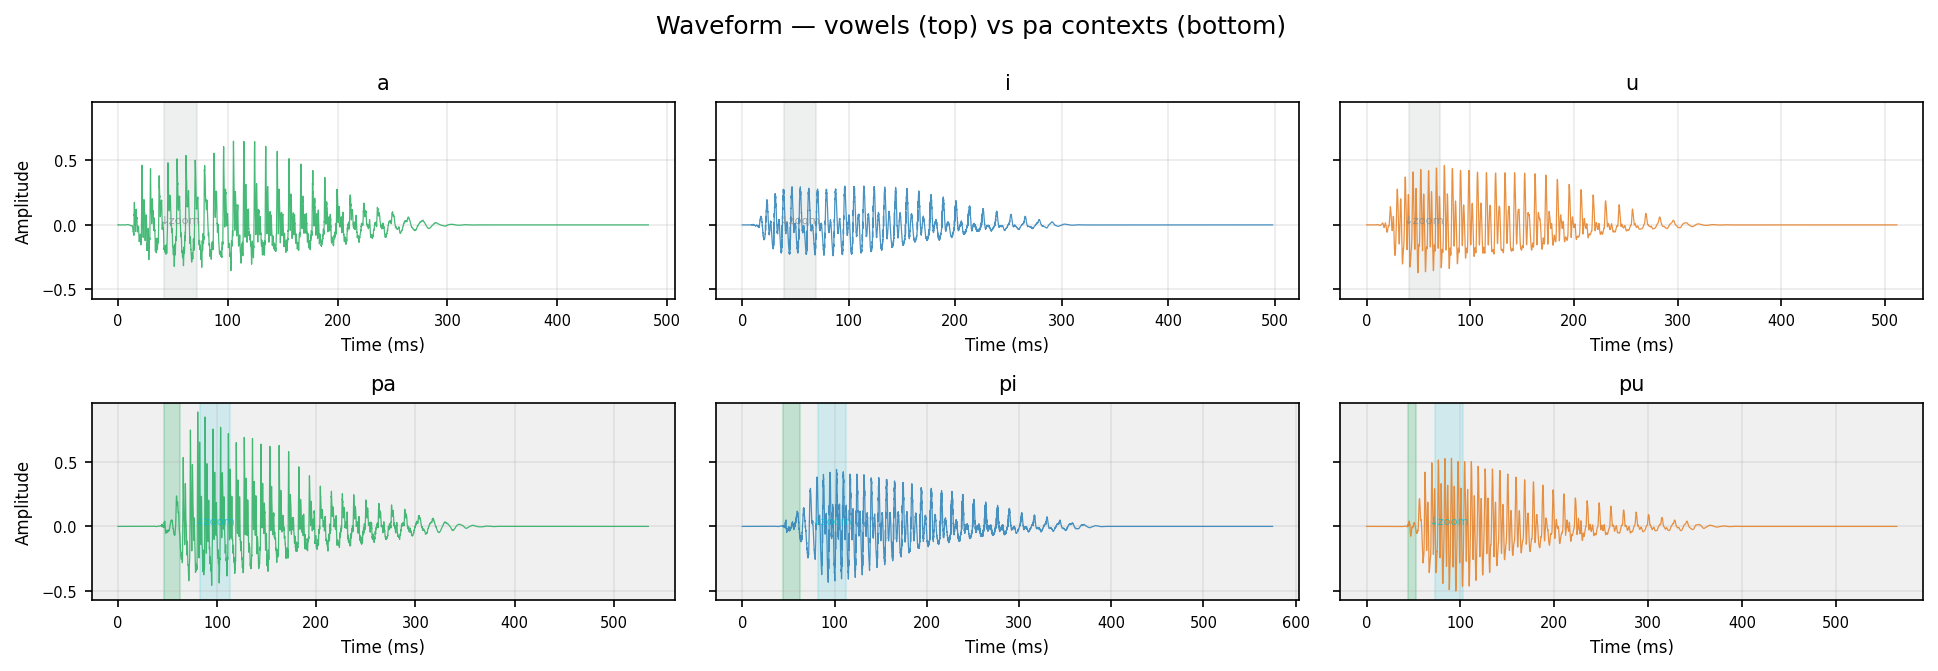
Green shading on CV waveforms = detected burst window (speech onset → first Praat-voiced frame).
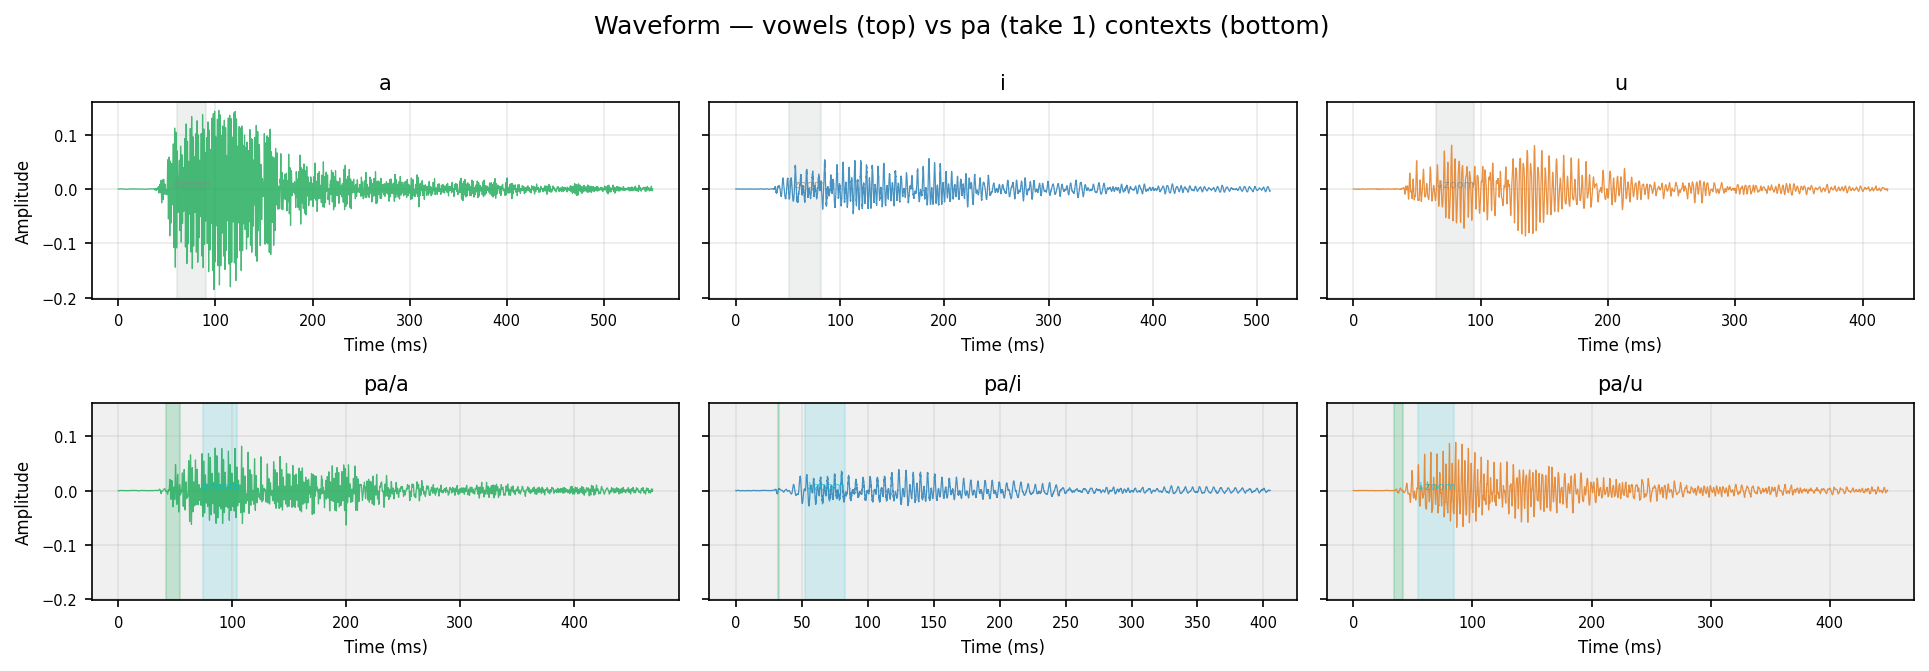
Human take 1
Green shading on CV waveforms = detected burst window (speech onset → first Praat-voiced frame).
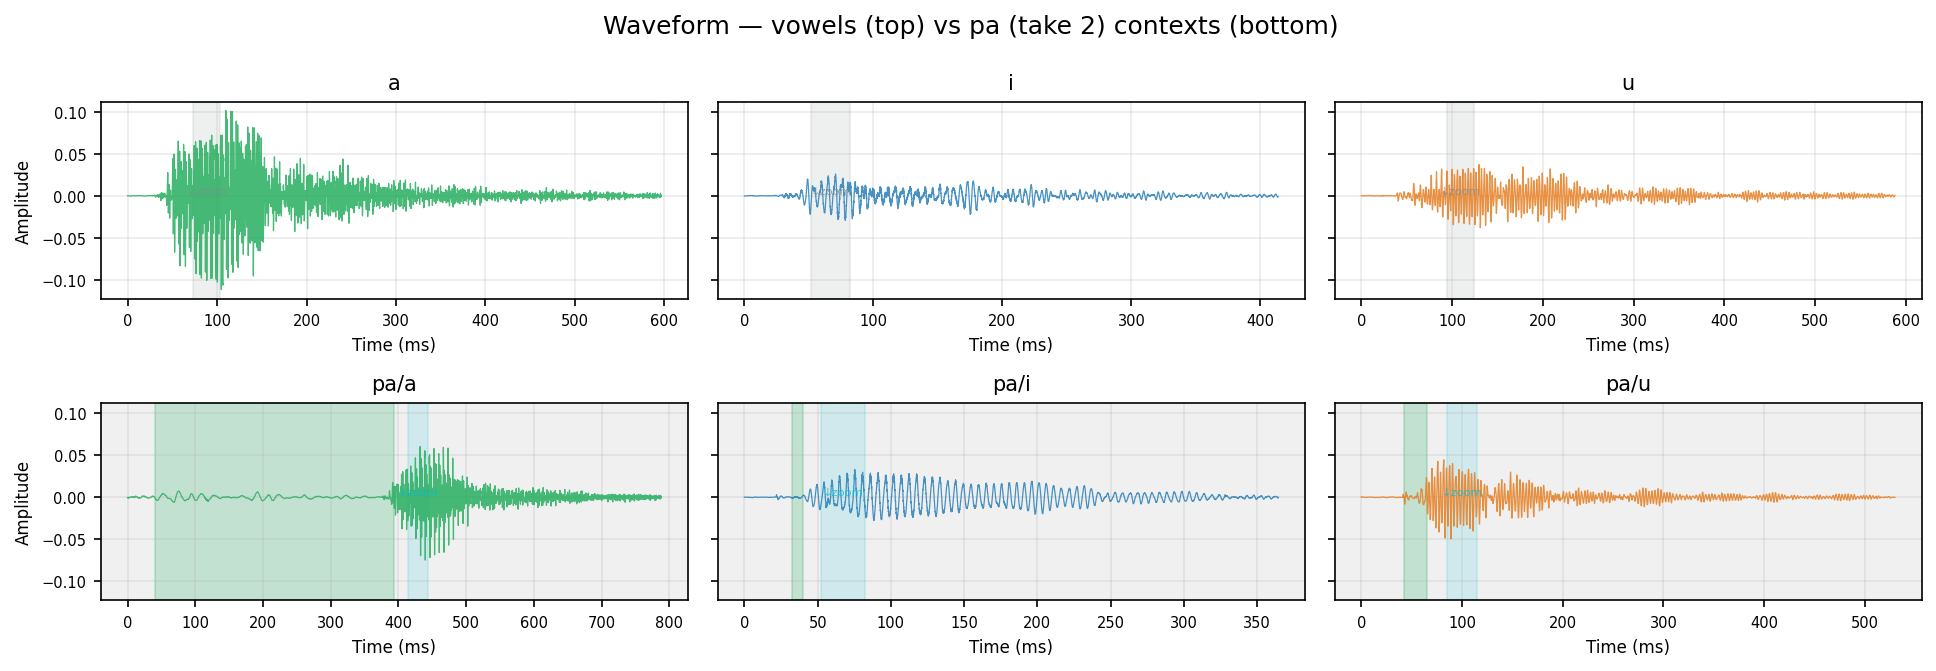
Human take 2
Green shading on CV waveforms = detected burst window (speech onset → first Praat-voiced frame).
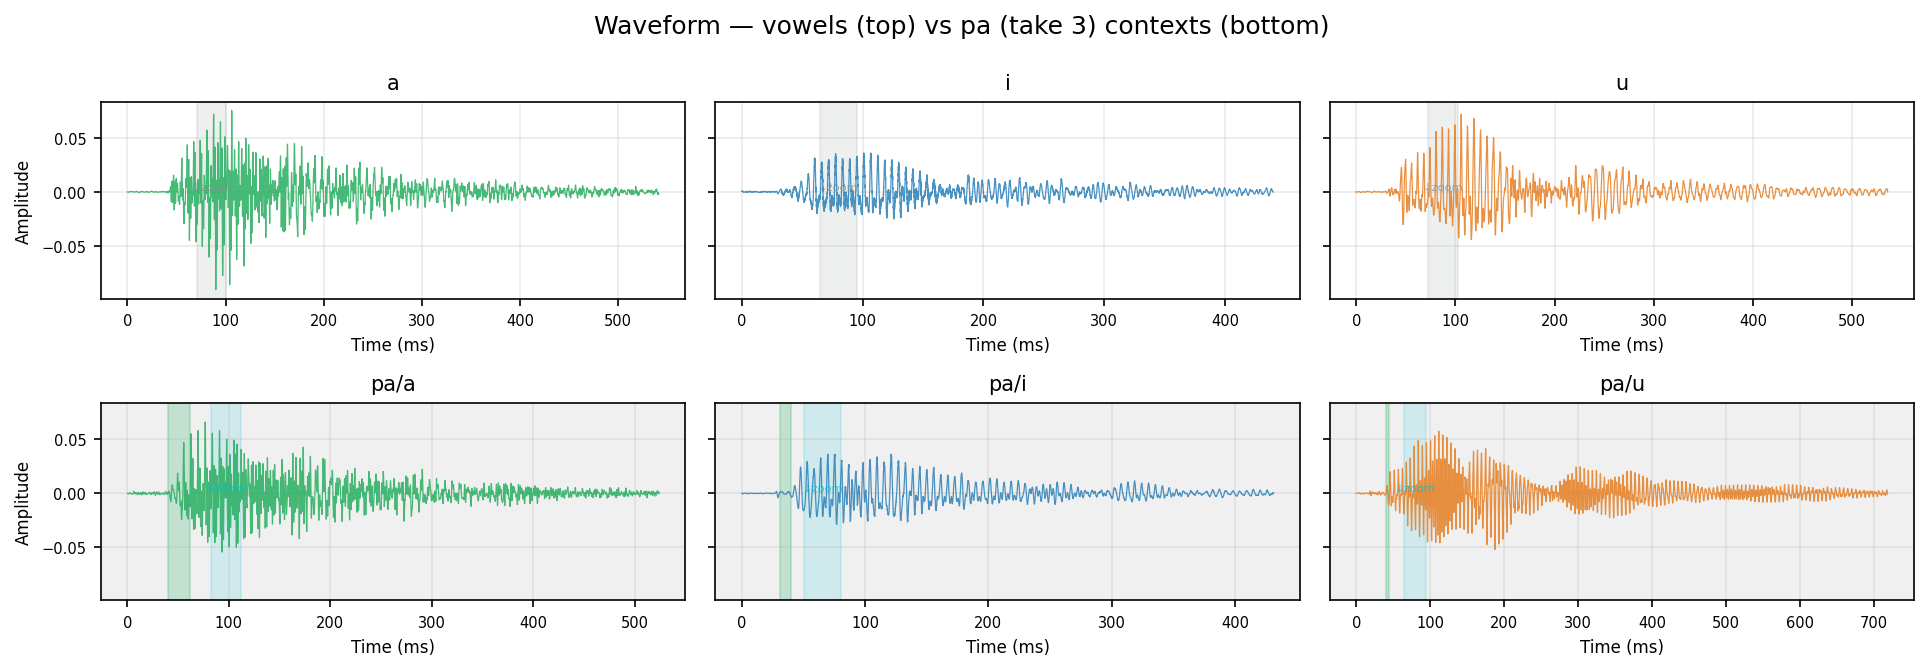
Human take 3
Green shading on CV waveforms = detected burst window (speech onset → first Praat-voiced frame).
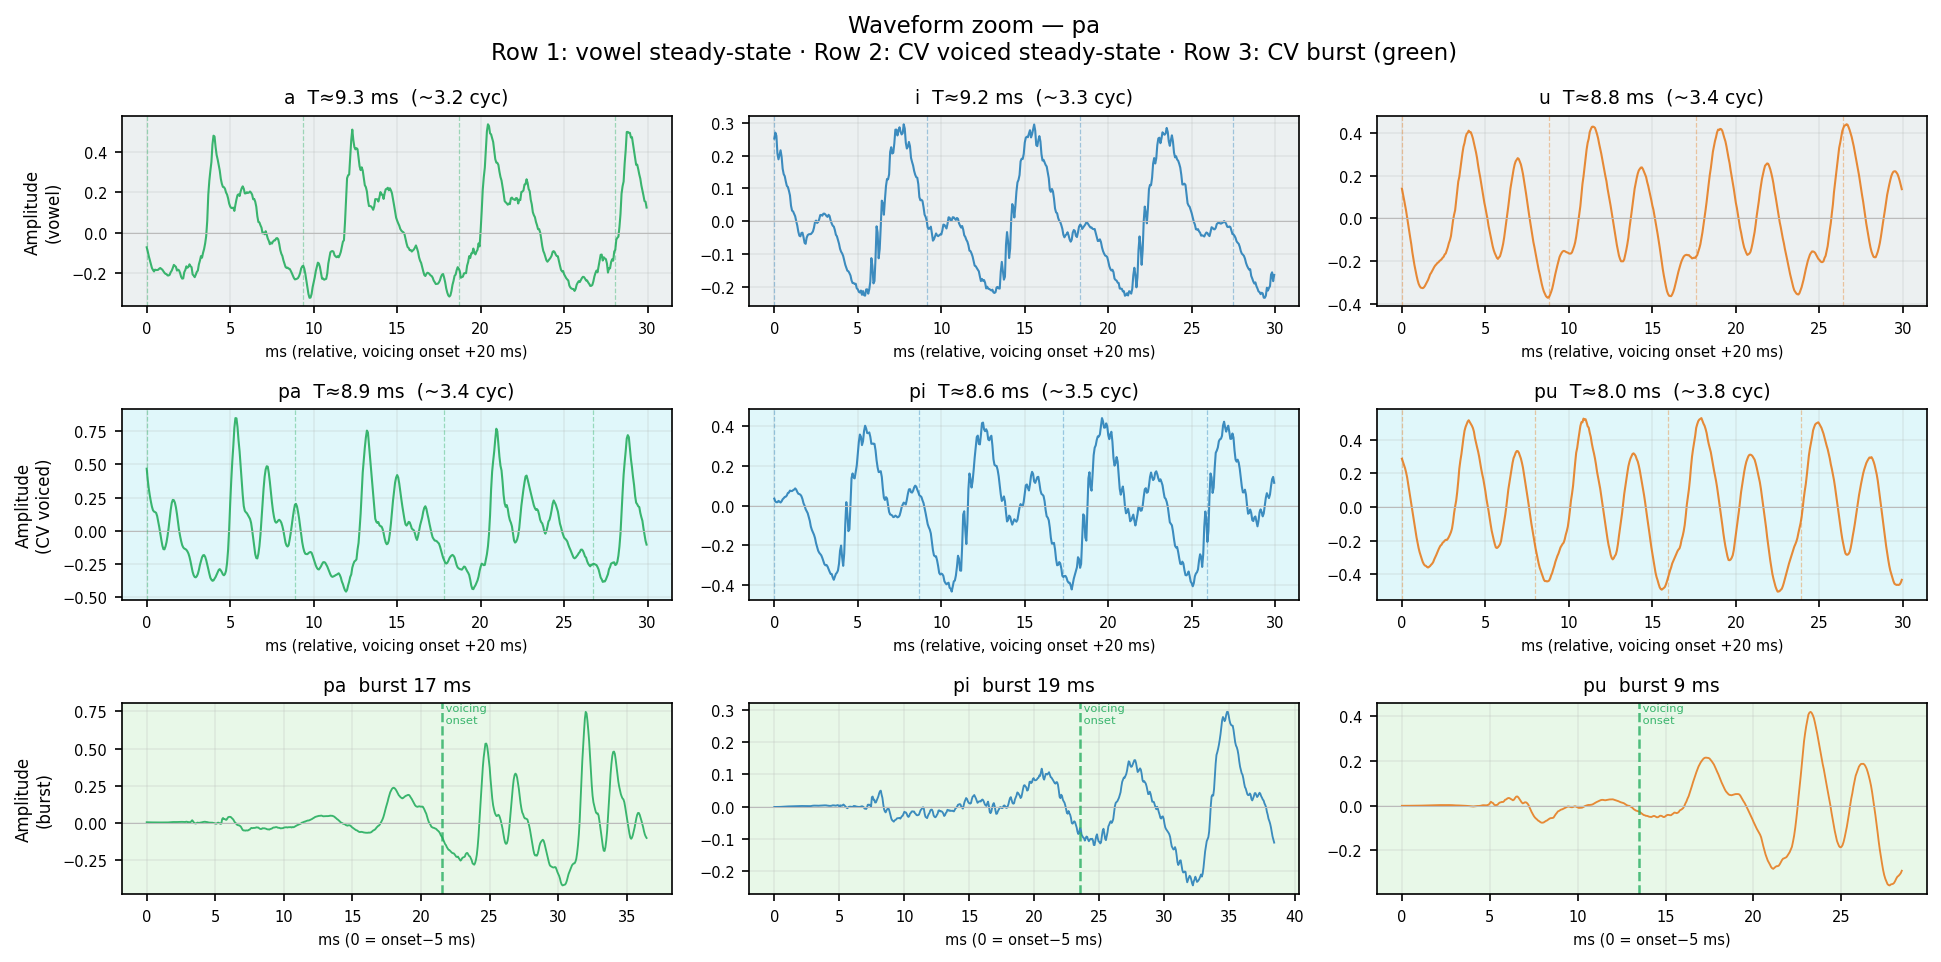
Row 1 (gray): Pure vowel steady-state — 30 ms, 20 ms after voicing onset. Row 2 (cyan): CV voiced steady-state — same window, shows vowel after consonant release. Row 3 (green): CV burst — aperiodic noise from stop release → transition to voicing (green dashed line = first voiced frame). Burst shape and duration differ by place of articulation. Dashed verticals in rows 1–2 = expected glottal period T = 1/F0. Waveform complexity = harmonic richness (pure sine = single harmonic; jagged = rich harmonics).
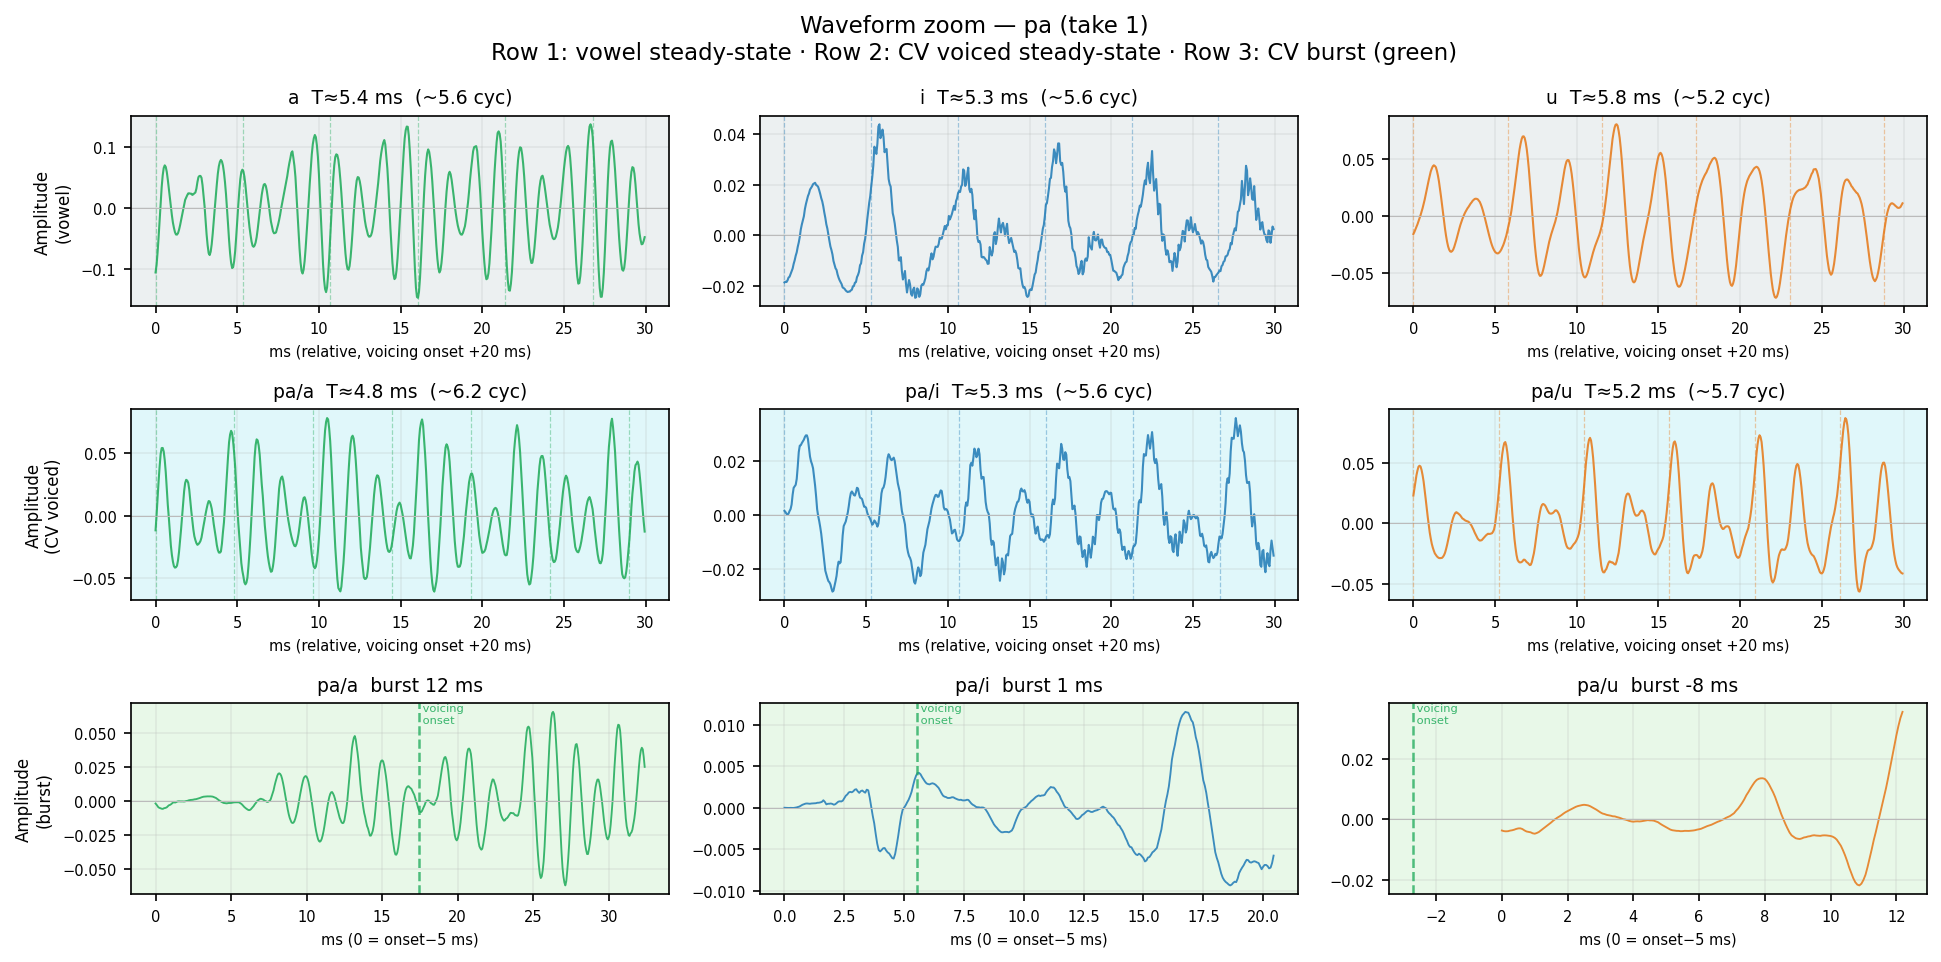
Human take 1
Row 1 (gray): Pure vowel steady-state — 30 ms, 20 ms after voicing onset. Row 2 (cyan): CV voiced steady-state — same window, shows vowel after consonant release. Row 3 (green): CV burst — aperiodic noise from stop release → transition to voicing (green dashed line = first voiced frame). Burst shape and duration differ by place of articulation. Dashed verticals in rows 1–2 = expected glottal period T = 1/F0. Waveform complexity = harmonic richness (pure sine = single harmonic; jagged = rich harmonics).
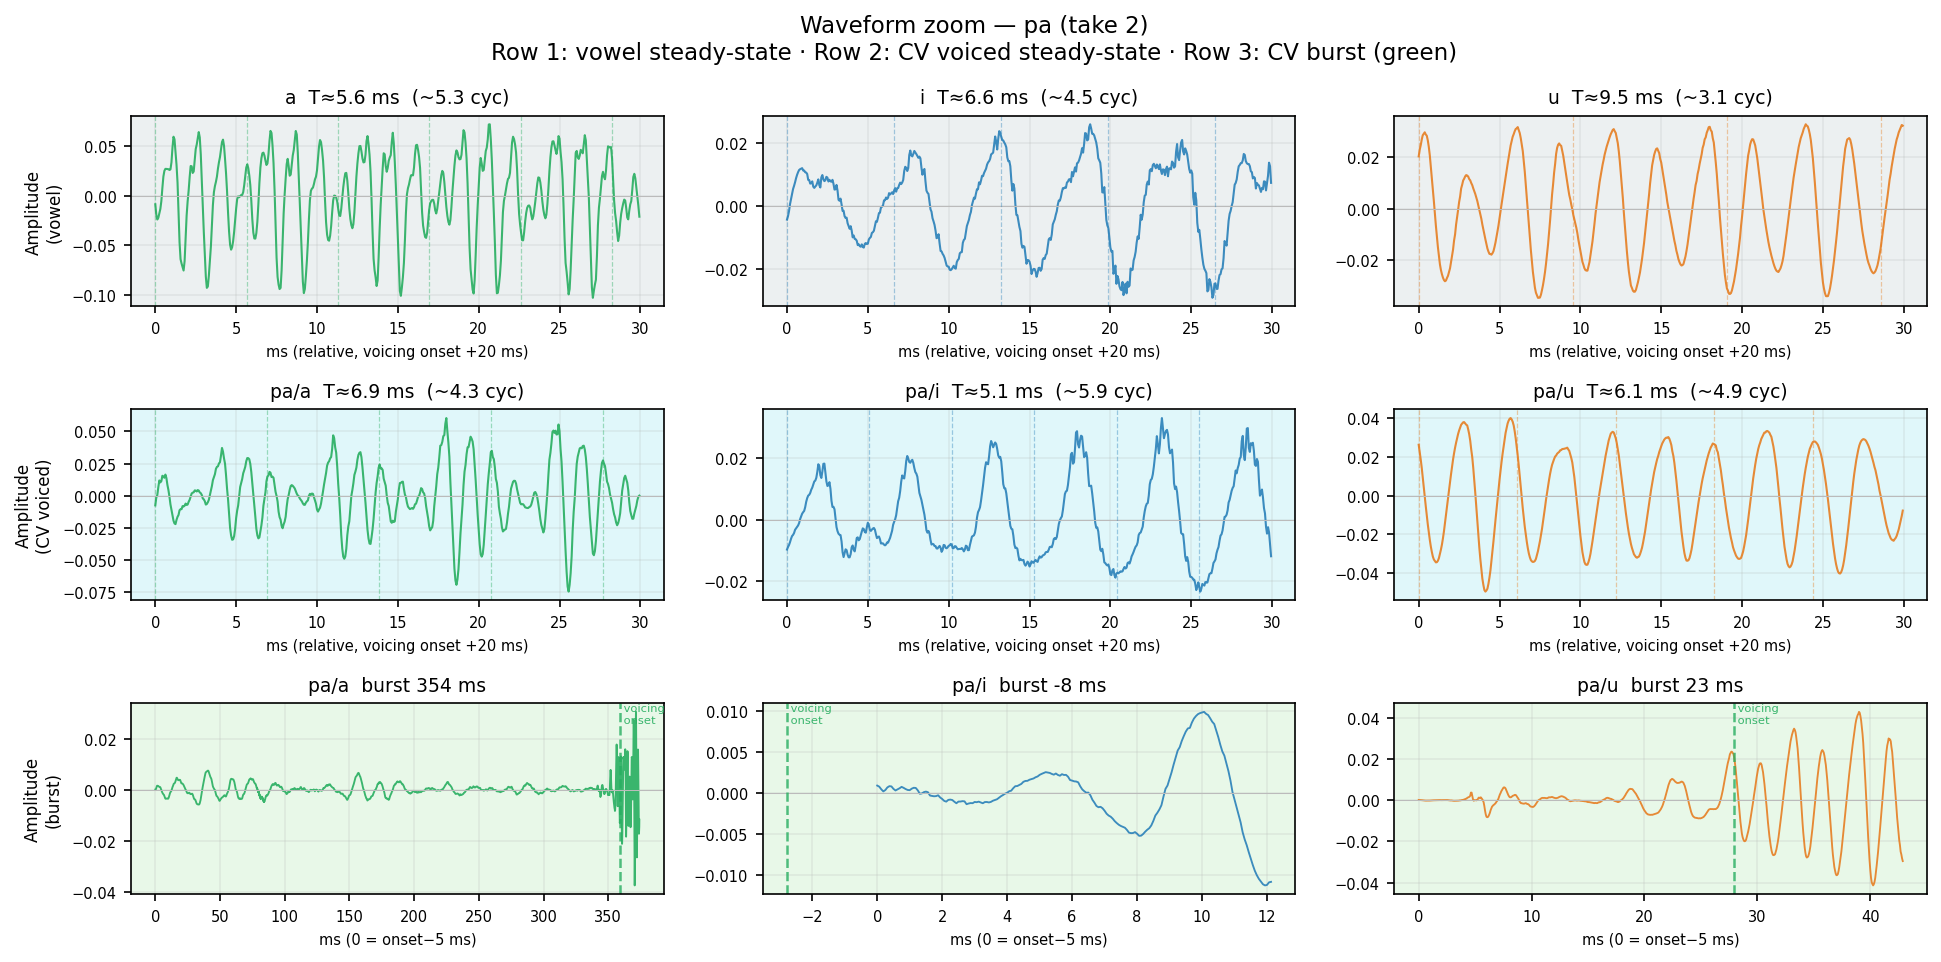
Human take 2
Row 1 (gray): Pure vowel steady-state — 30 ms, 20 ms after voicing onset. Row 2 (cyan): CV voiced steady-state — same window, shows vowel after consonant release. Row 3 (green): CV burst — aperiodic noise from stop release → transition to voicing (green dashed line = first voiced frame). Burst shape and duration differ by place of articulation. Dashed verticals in rows 1–2 = expected glottal period T = 1/F0. Waveform complexity = harmonic richness (pure sine = single harmonic; jagged = rich harmonics).
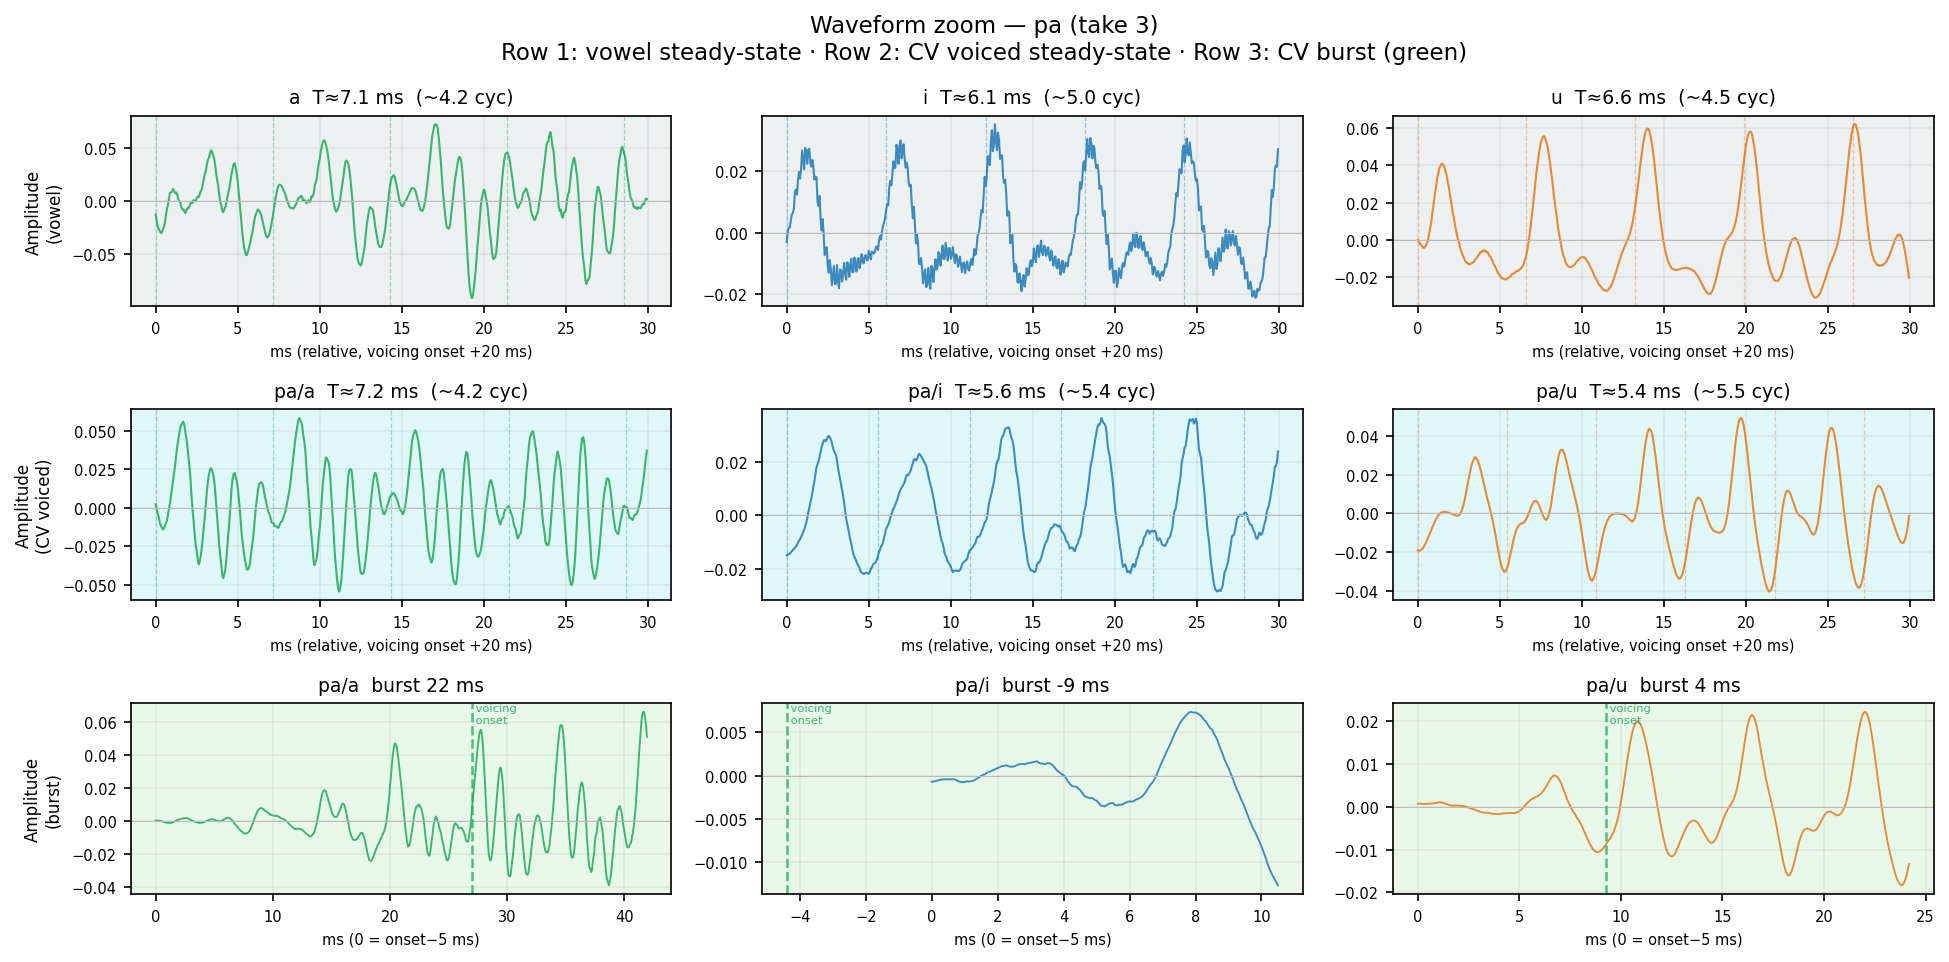
Human take 3
Row 1 (gray): Pure vowel steady-state — 30 ms, 20 ms after voicing onset. Row 2 (cyan): CV voiced steady-state — same window, shows vowel after consonant release. Row 3 (green): CV burst — aperiodic noise from stop release → transition to voicing (green dashed line = first voiced frame). Burst shape and duration differ by place of articulation. Dashed verticals in rows 1–2 = expected glottal period T = 1/F0. Waveform complexity = harmonic richness (pure sine = single harmonic; jagged = rich harmonics).
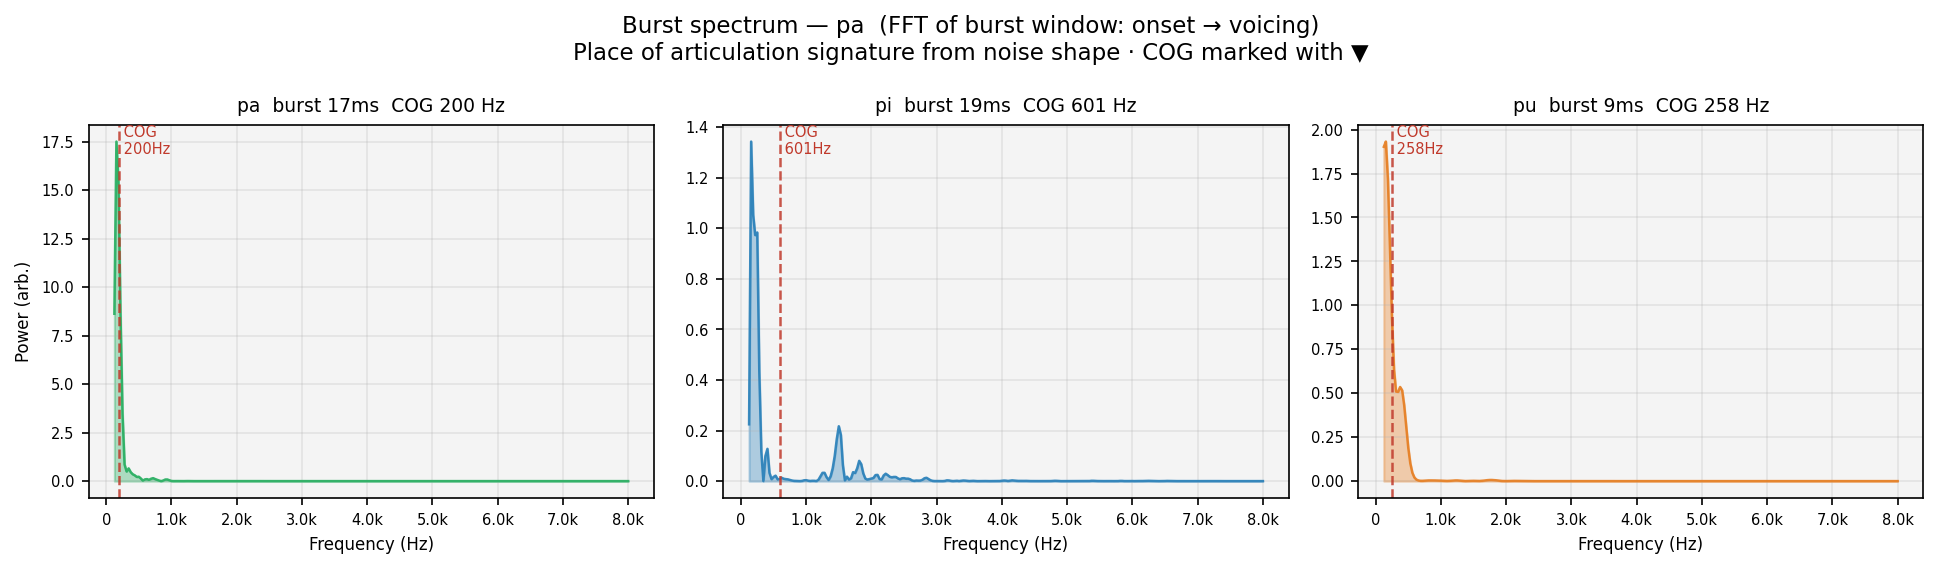
FFT of the aperiodic burst window (speech onset → first voiced frame) for each vowel context. Spectral centre of gravity (COG, red dashed) marks the dominant noise frequency — a place-of-articulation signature independent of the vowel. Velars peak mid-frequency (~1–2 kHz); dentals/alveolars peak high (>3 kHz); labials are spectrally flat. COG should be consistent across /a/i/u/ for the same consonant — vowel context should not change where the burst energy is.
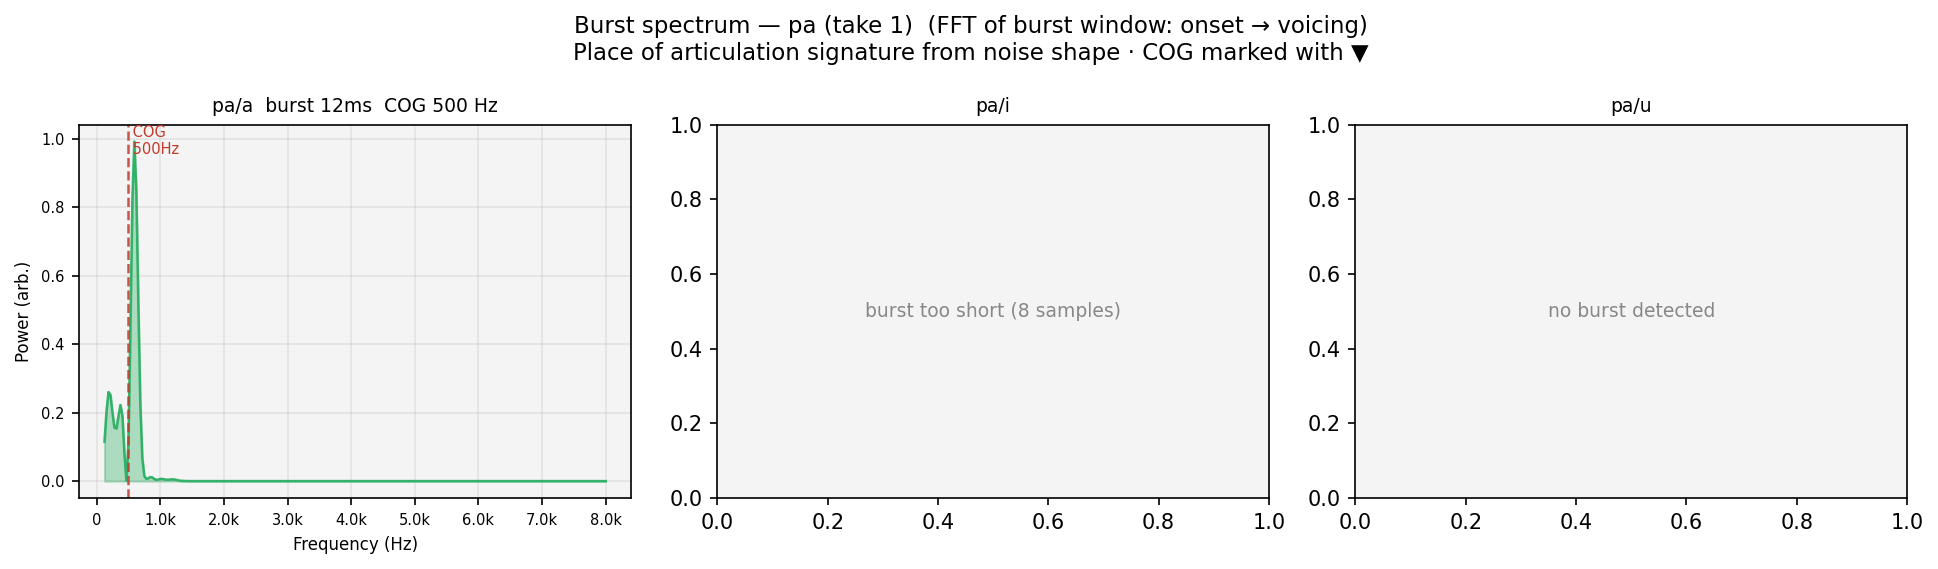
Human take 1
FFT of the aperiodic burst window (speech onset → first voiced frame) for each vowel context. Spectral centre of gravity (COG, red dashed) marks the dominant noise frequency — a place-of-articulation signature independent of the vowel. Velars peak mid-frequency (~1–2 kHz); dentals/alveolars peak high (>3 kHz); labials are spectrally flat. COG should be consistent across /a/i/u/ for the same consonant — vowel context should not change where the burst energy is.
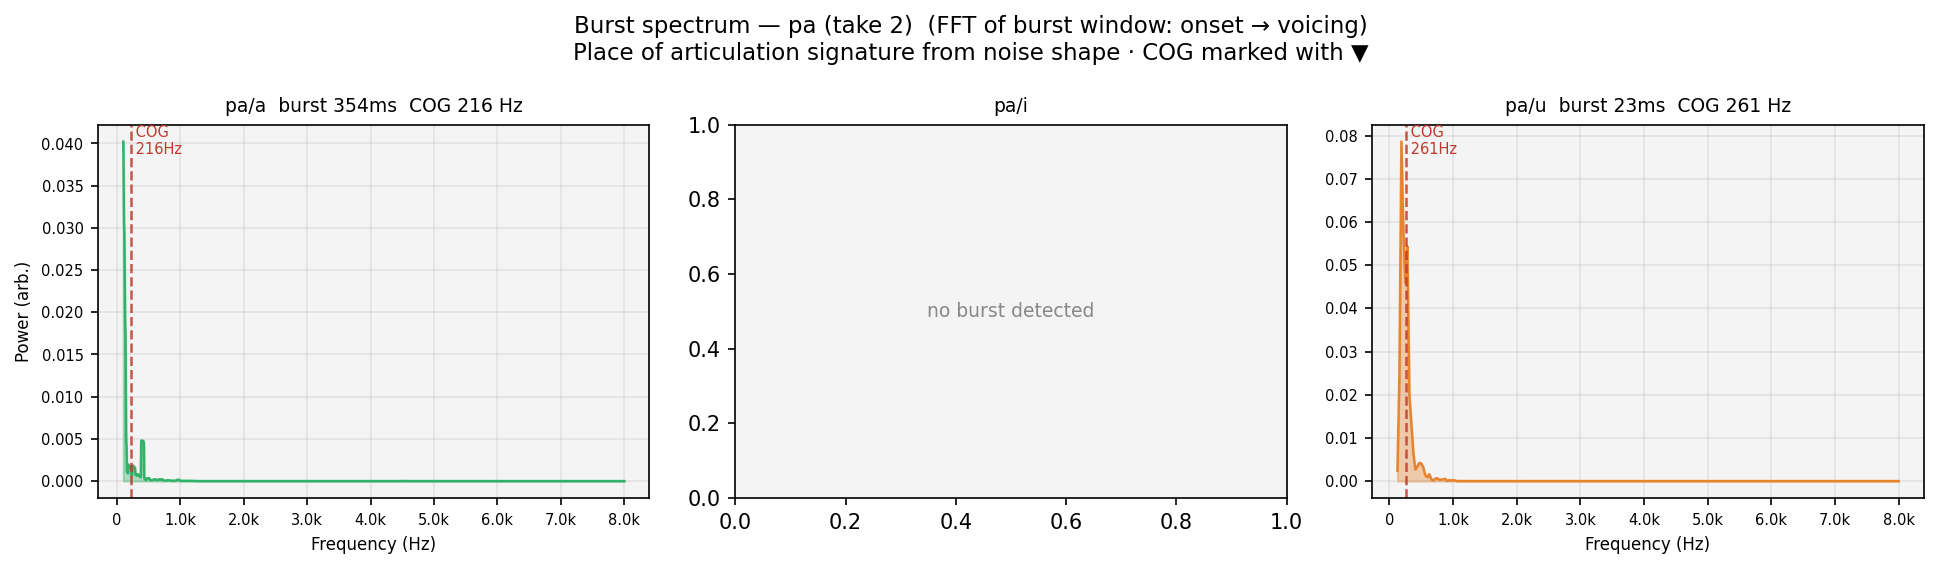
Human take 2
FFT of the aperiodic burst window (speech onset → first voiced frame) for each vowel context. Spectral centre of gravity (COG, red dashed) marks the dominant noise frequency — a place-of-articulation signature independent of the vowel. Velars peak mid-frequency (~1–2 kHz); dentals/alveolars peak high (>3 kHz); labials are spectrally flat. COG should be consistent across /a/i/u/ for the same consonant — vowel context should not change where the burst energy is.
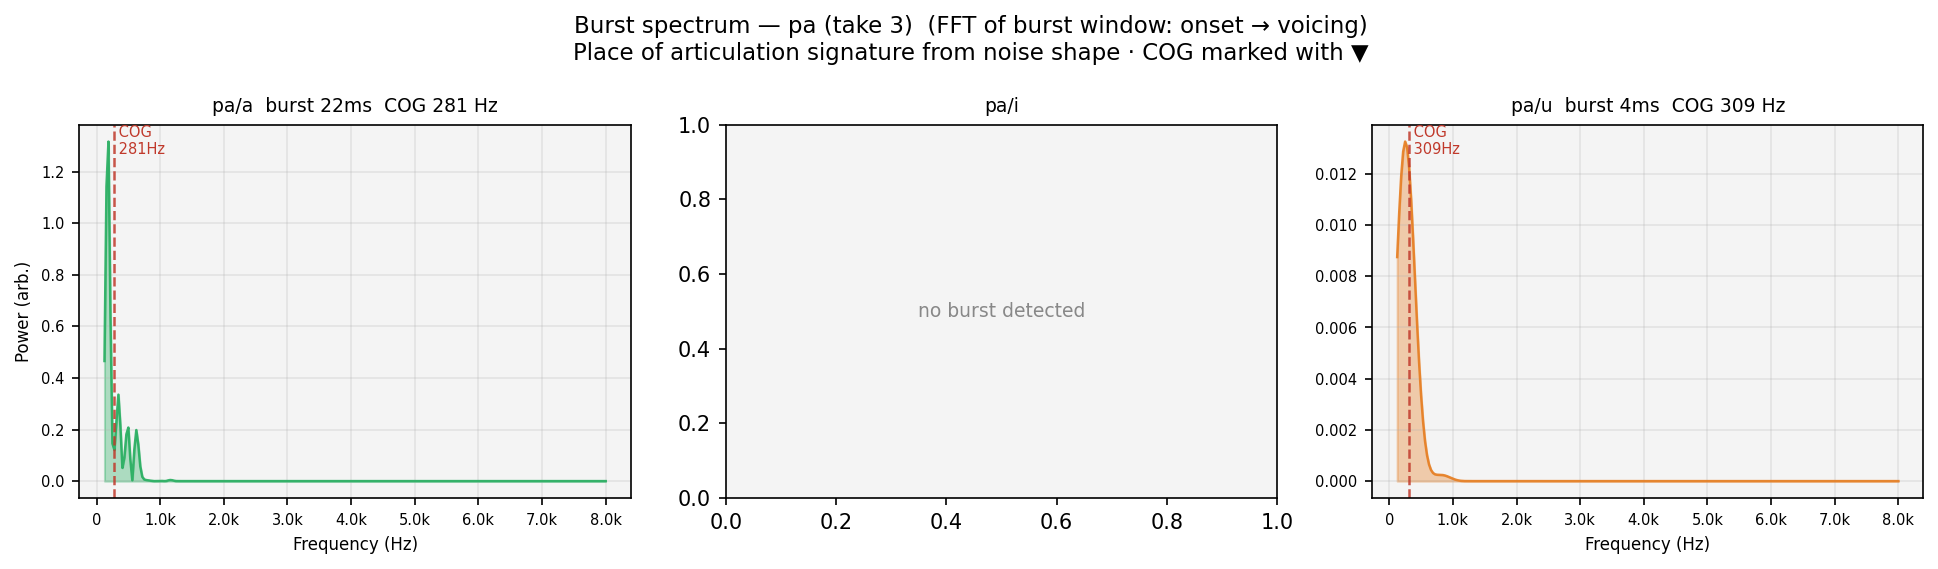
Human take 3
FFT of the aperiodic burst window (speech onset → first voiced frame) for each vowel context. Spectral centre of gravity (COG, red dashed) marks the dominant noise frequency — a place-of-articulation signature independent of the vowel. Velars peak mid-frequency (~1–2 kHz); dentals/alveolars peak high (>3 kHz); labials are spectrally flat. COG should be consistent across /a/i/u/ for the same consonant — vowel context should not change where the burst energy is.
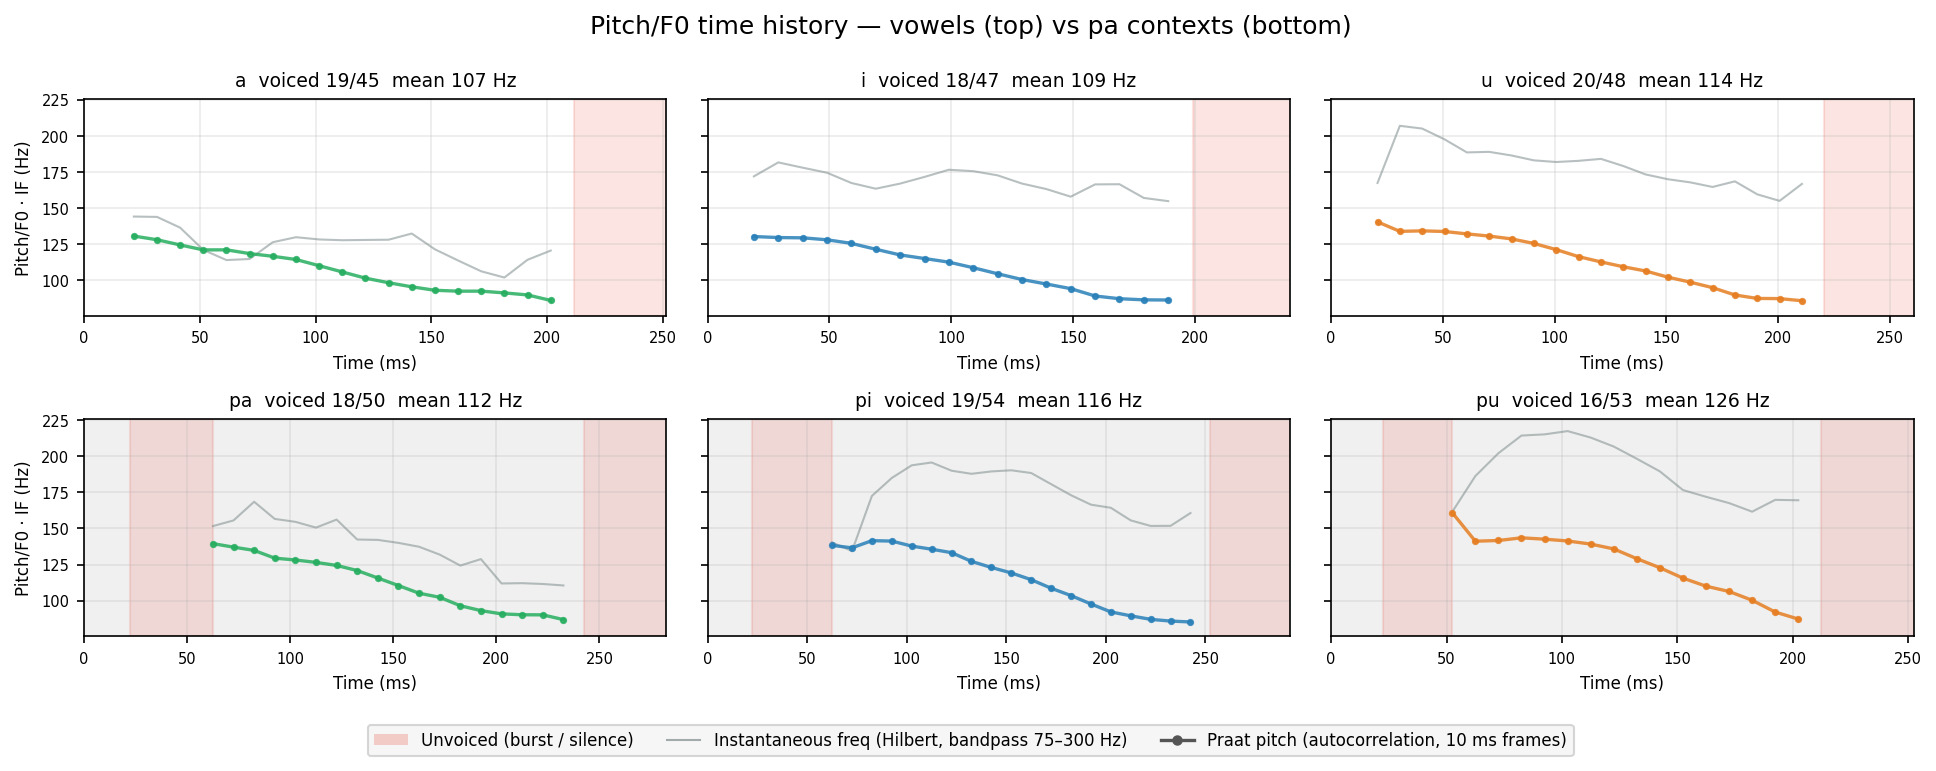
Colored dots = Praat pitch (autocorrelation, 10 ms frames). Gray line = instantaneous frequency (Hilbert transform on 75–300 Hz bandpass). Both show F0 region — IF is noisier; Praat smooths by choosing the most periodic candidate. Red shade = unvoiced (burst / silence).
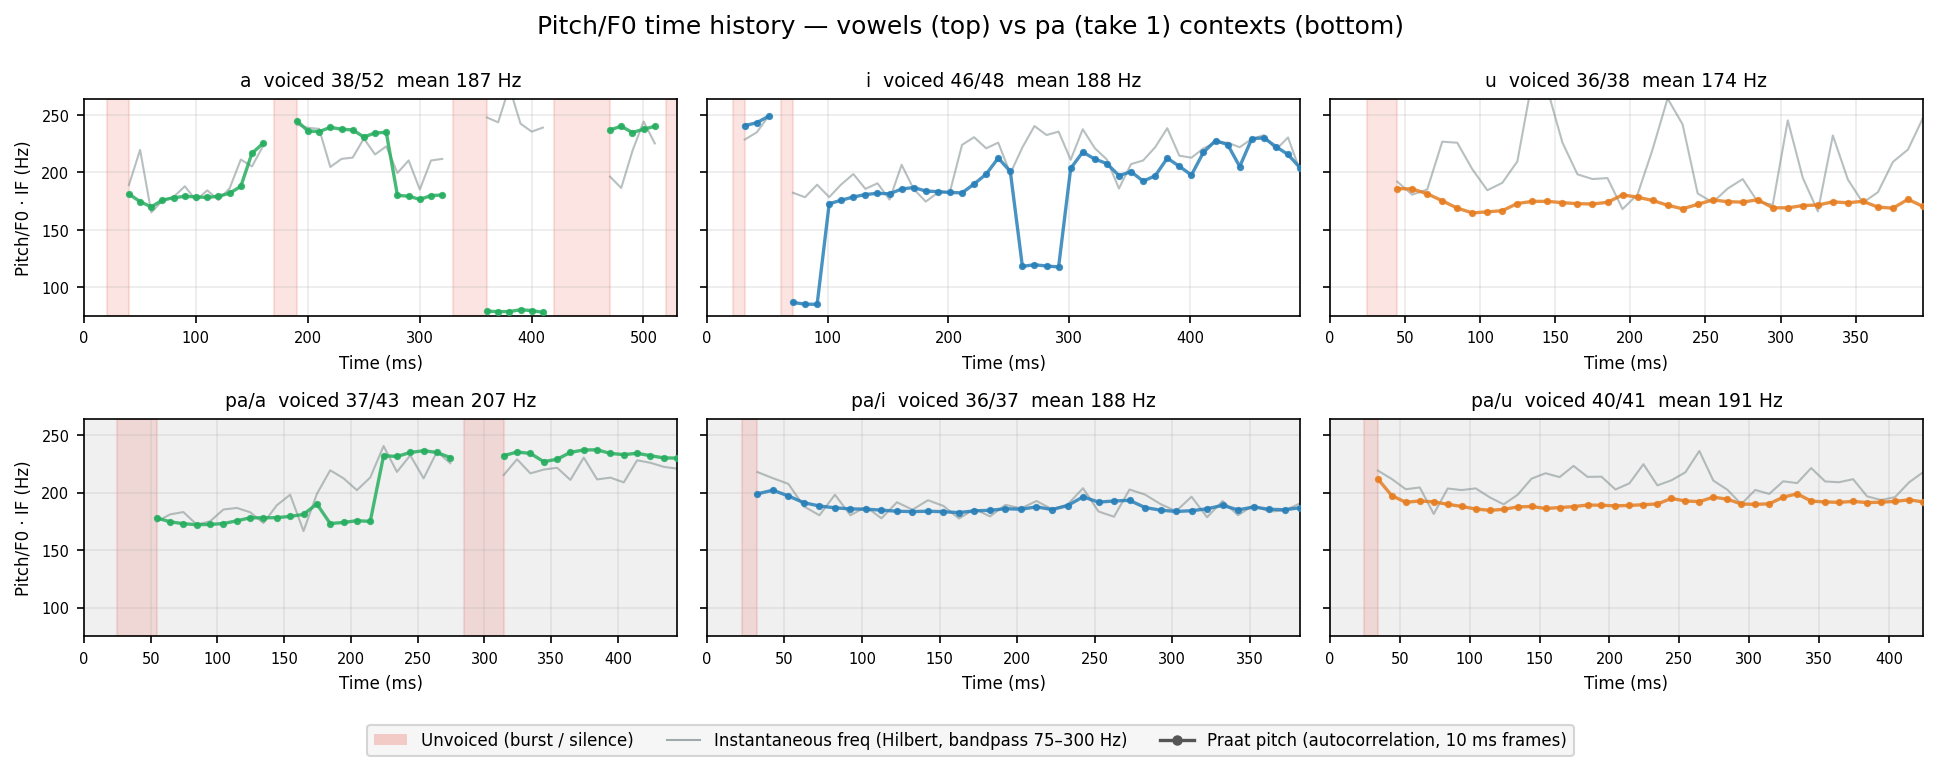
Human take 1
Colored dots = Praat pitch (autocorrelation, 10 ms frames). Gray line = instantaneous frequency (Hilbert transform on 75–300 Hz bandpass). Both show F0 region — IF is noisier; Praat smooths by choosing the most periodic candidate. Red shade = unvoiced (burst / silence).
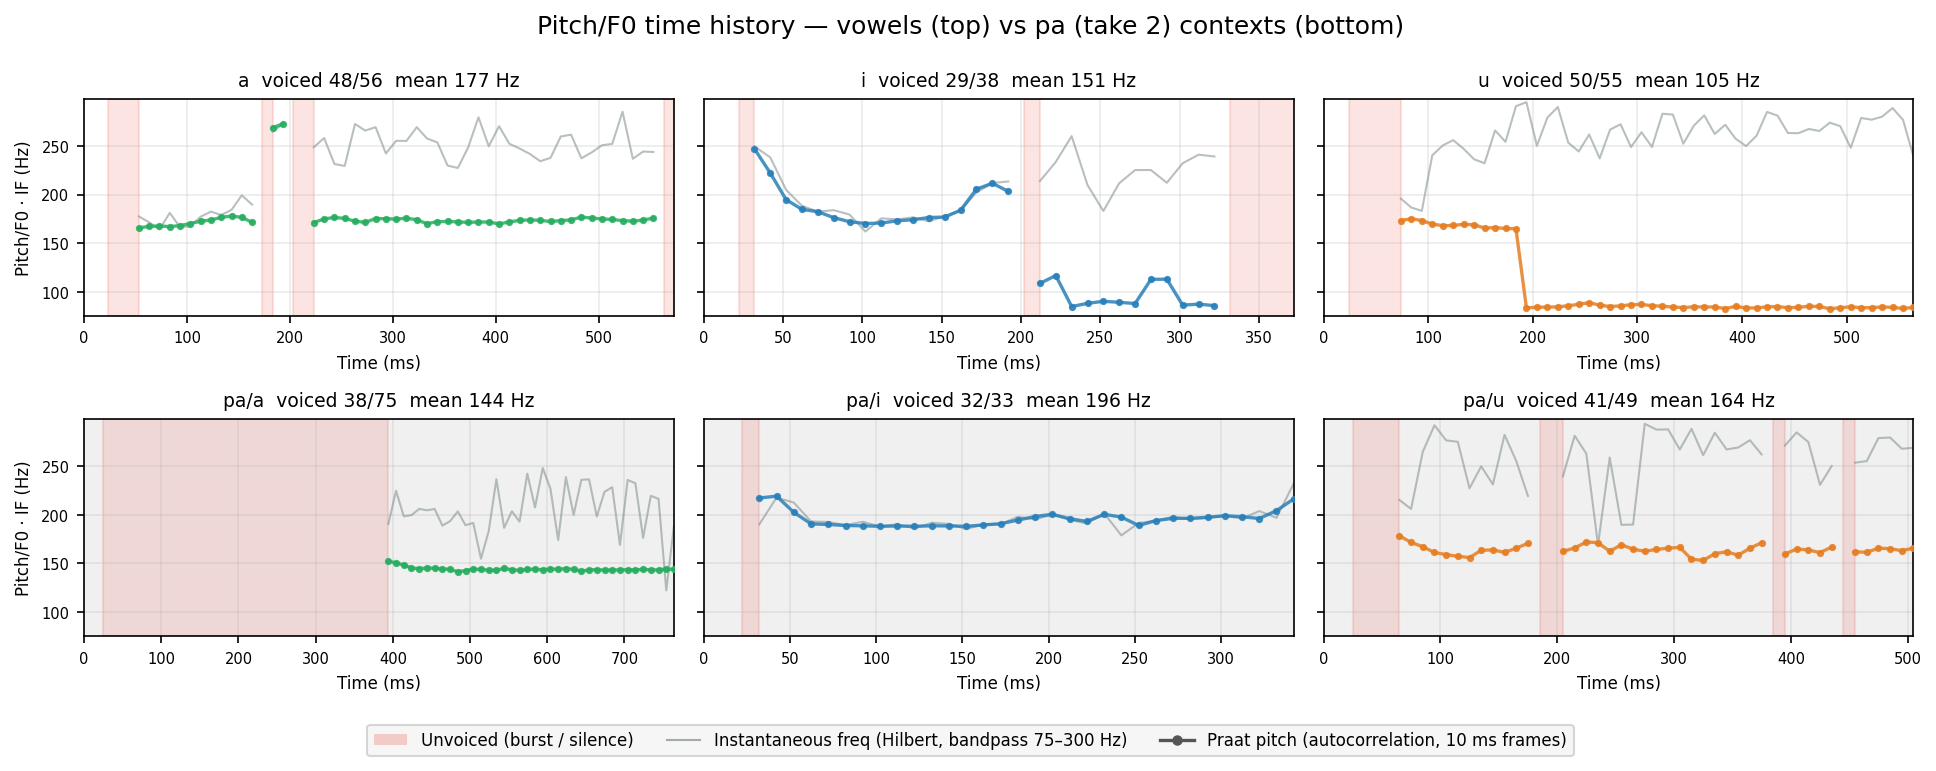
Human take 2
Colored dots = Praat pitch (autocorrelation, 10 ms frames). Gray line = instantaneous frequency (Hilbert transform on 75–300 Hz bandpass). Both show F0 region — IF is noisier; Praat smooths by choosing the most periodic candidate. Red shade = unvoiced (burst / silence).
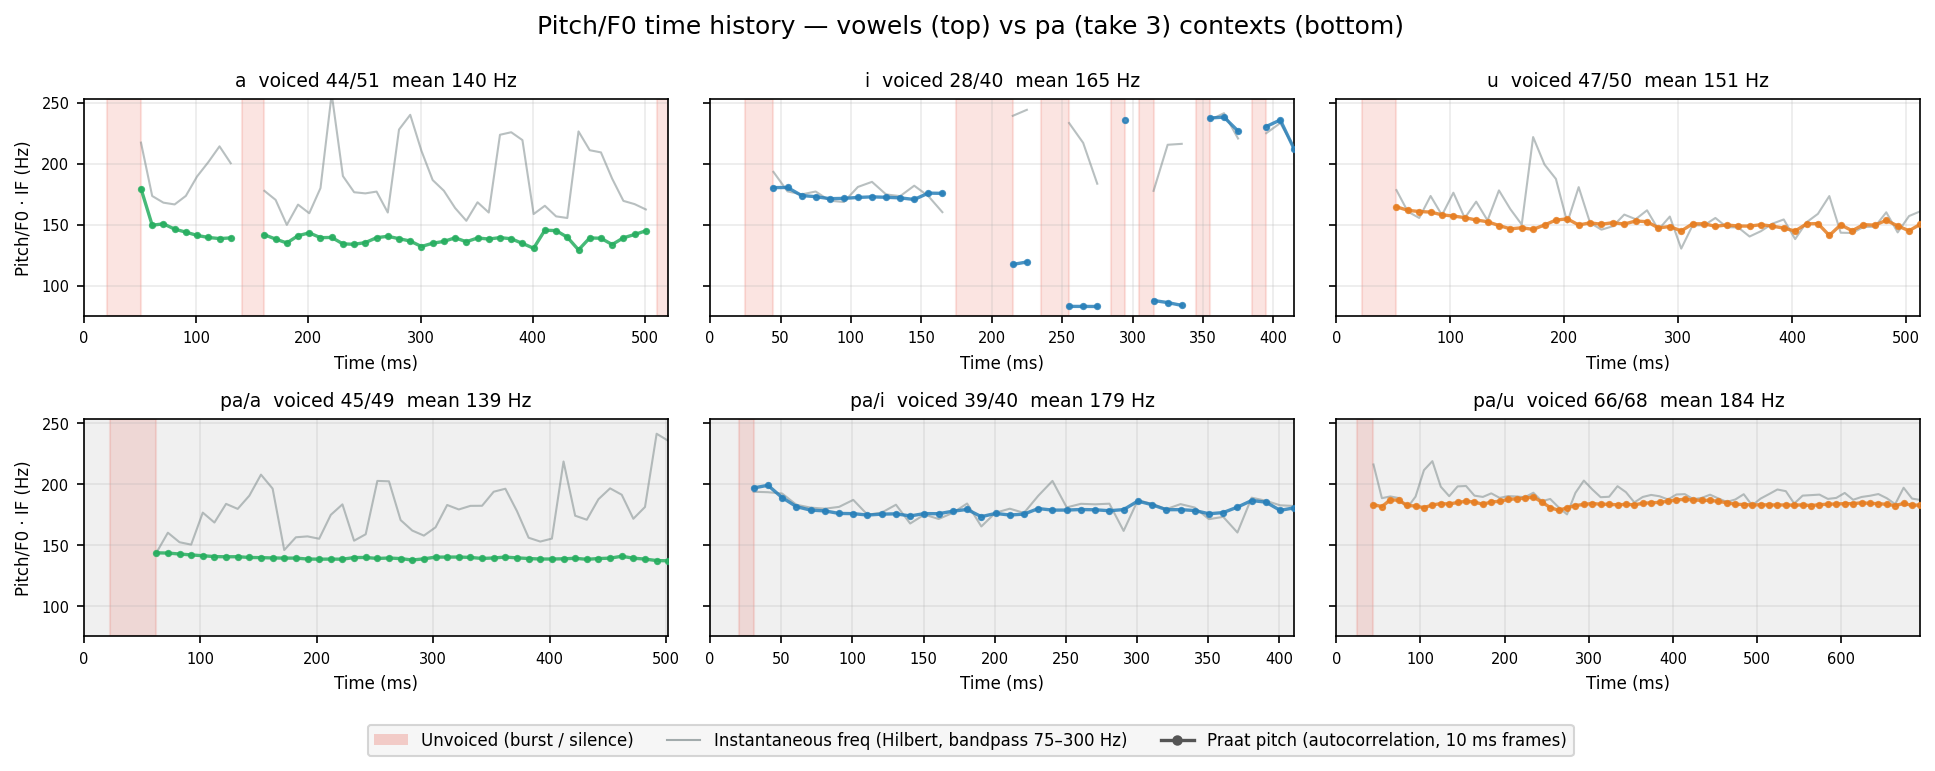
Human take 3
Colored dots = Praat pitch (autocorrelation, 10 ms frames). Gray line = instantaneous frequency (Hilbert transform on 75–300 Hz bandpass). Both show F0 region — IF is noisier; Praat smooths by choosing the most periodic candidate. Red shade = unvoiced (burst / silence).
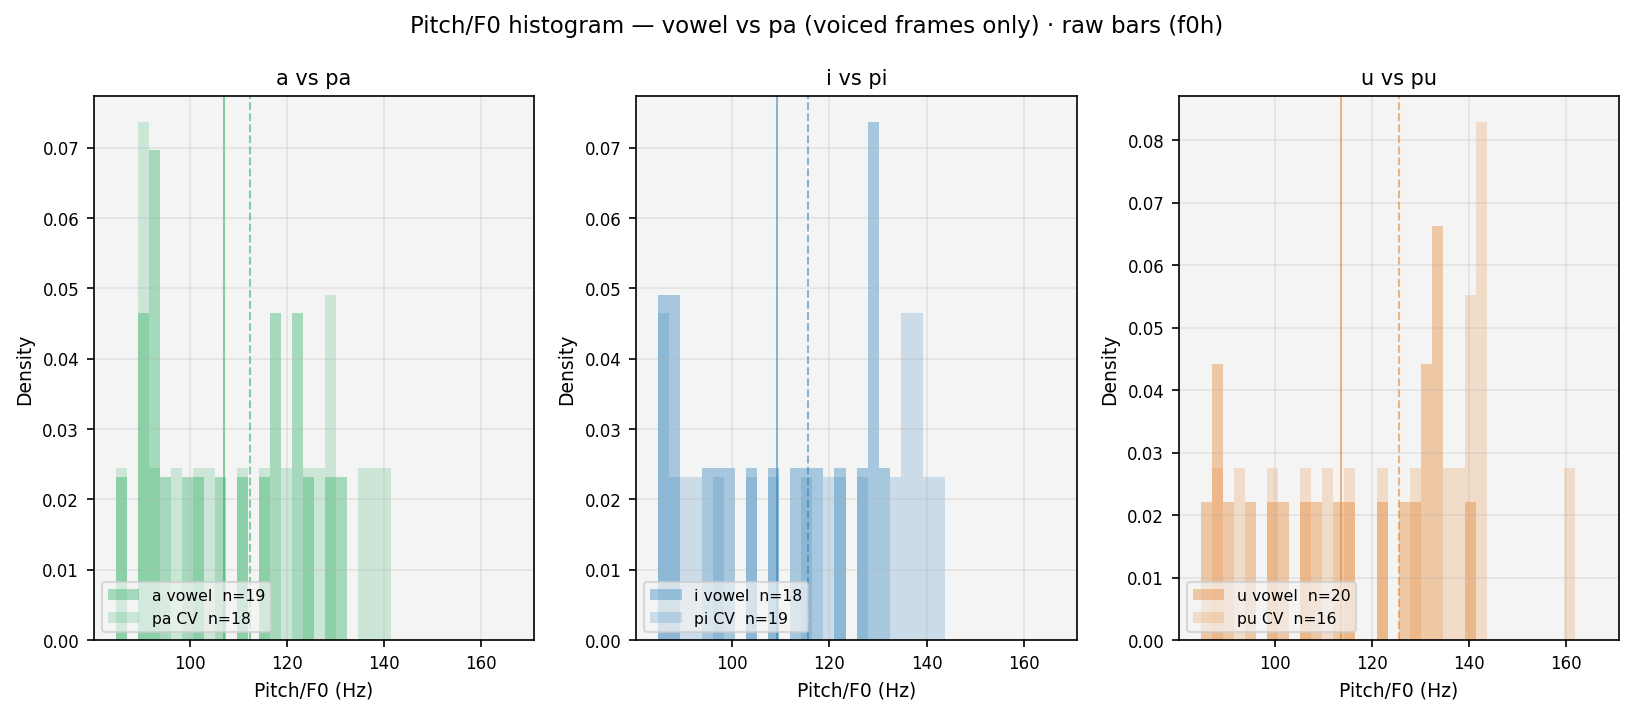
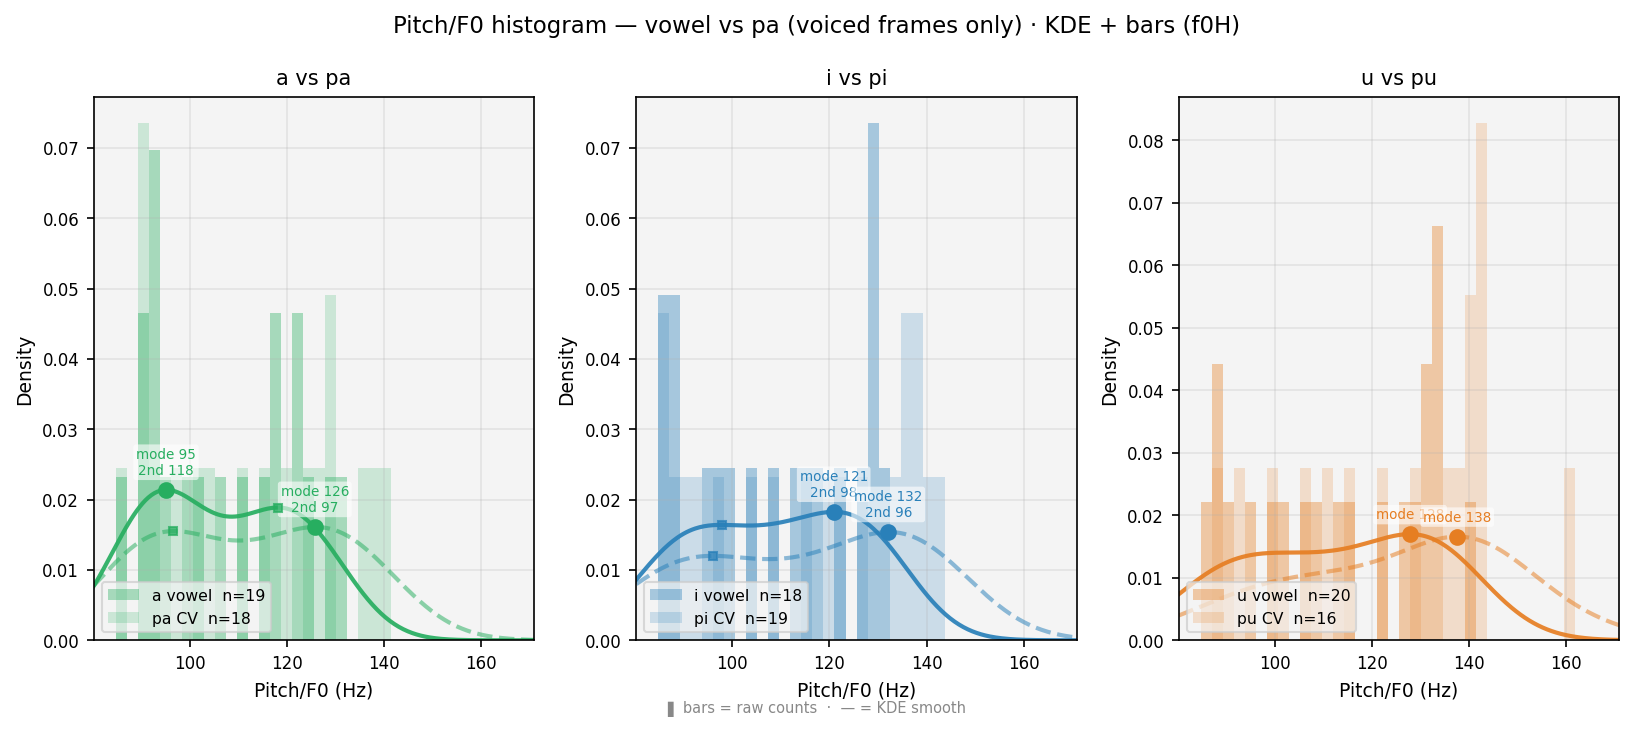
Smoothed histogram (each curve = bars drawn as a continuous line to avoid clutter from overlapping bars). Solid = vowel · Dashed = CV · voiced frames only. ● = primary peak (mode, most frequent pitch). ■ = secondary peak (onset elevation, smaller square). Thin verticals = means. Burst frames absent: voiceless stops produce no vocal-cord vibration — Praat returns NaN, so those frames never enter this plot.
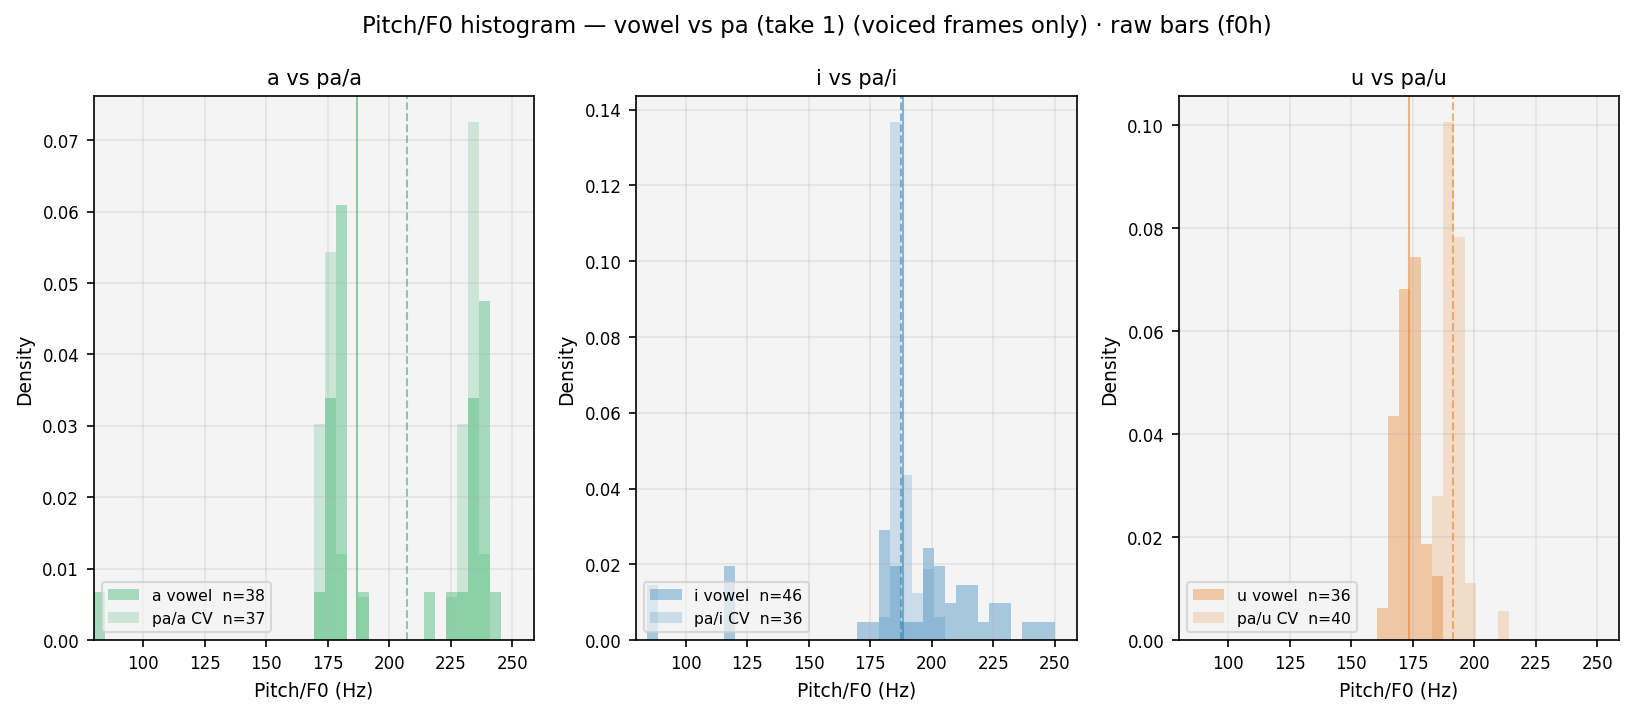
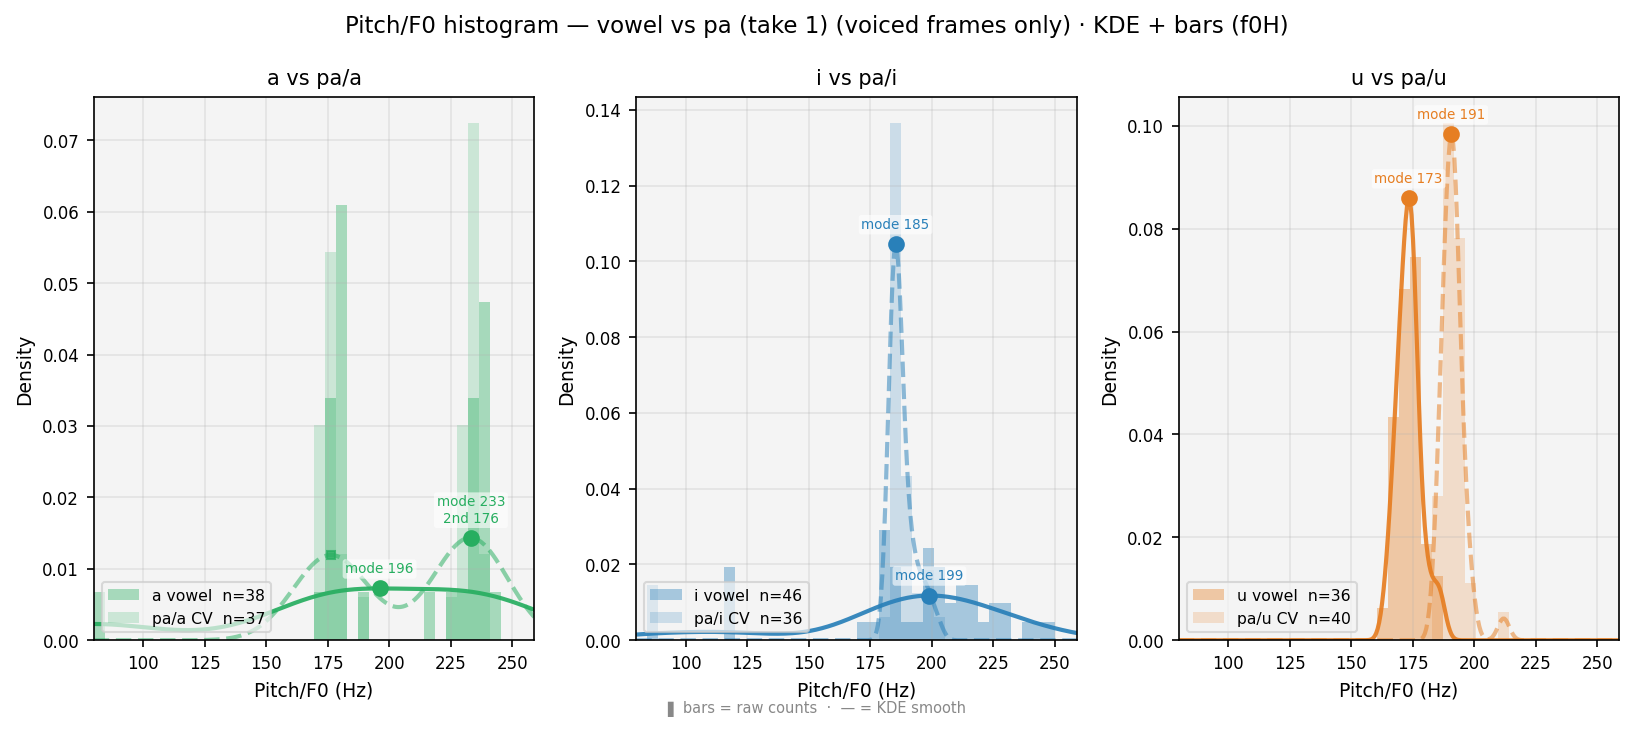
Smoothed histogram (each curve = bars drawn as a continuous line to avoid clutter from overlapping bars). Solid = vowel · Dashed = CV · voiced frames only. ● = primary peak (mode, most frequent pitch). ■ = secondary peak (onset elevation, smaller square). Thin verticals = means. Burst frames absent: voiceless stops produce no vocal-cord vibration — Praat returns NaN, so those frames never enter this plot.
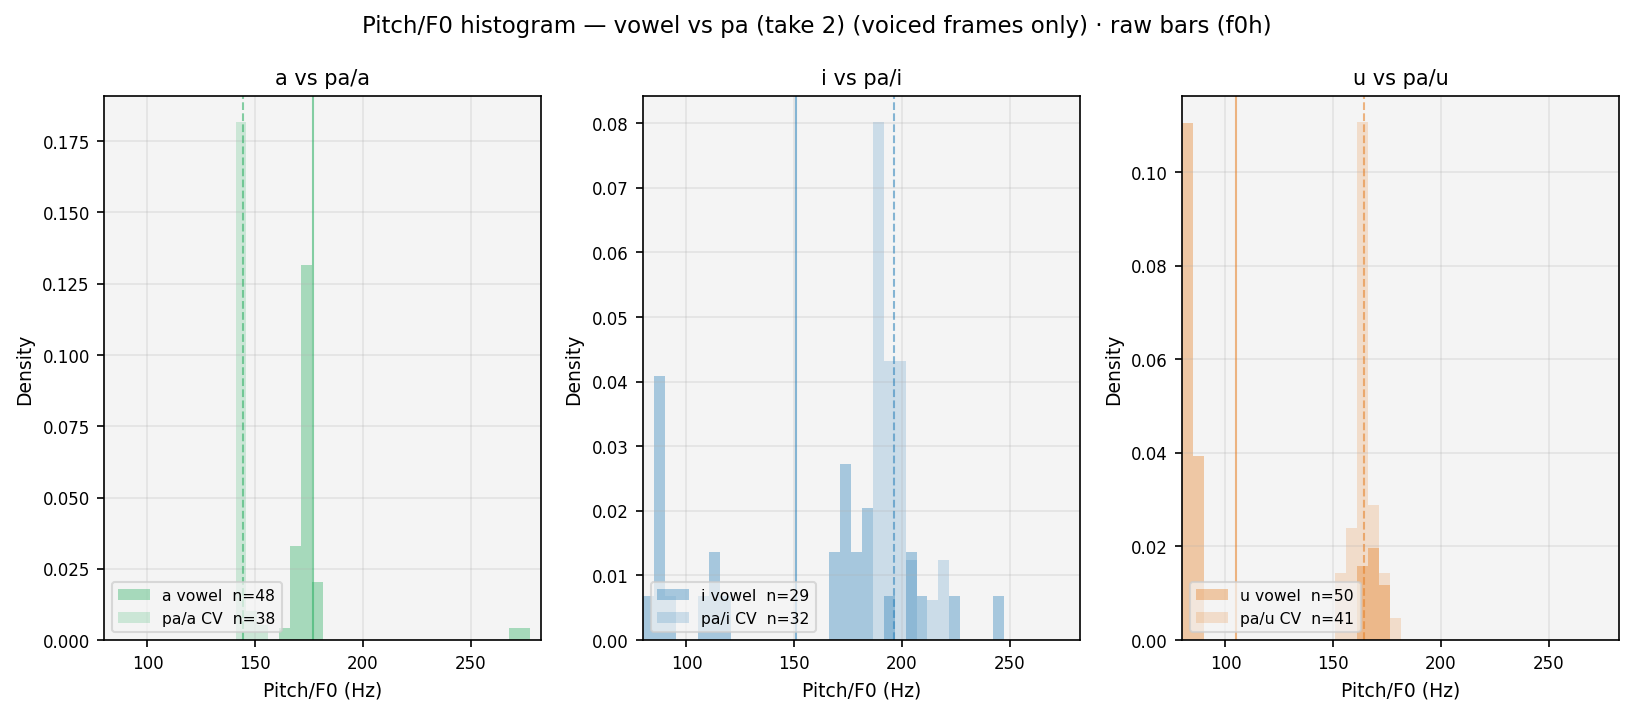
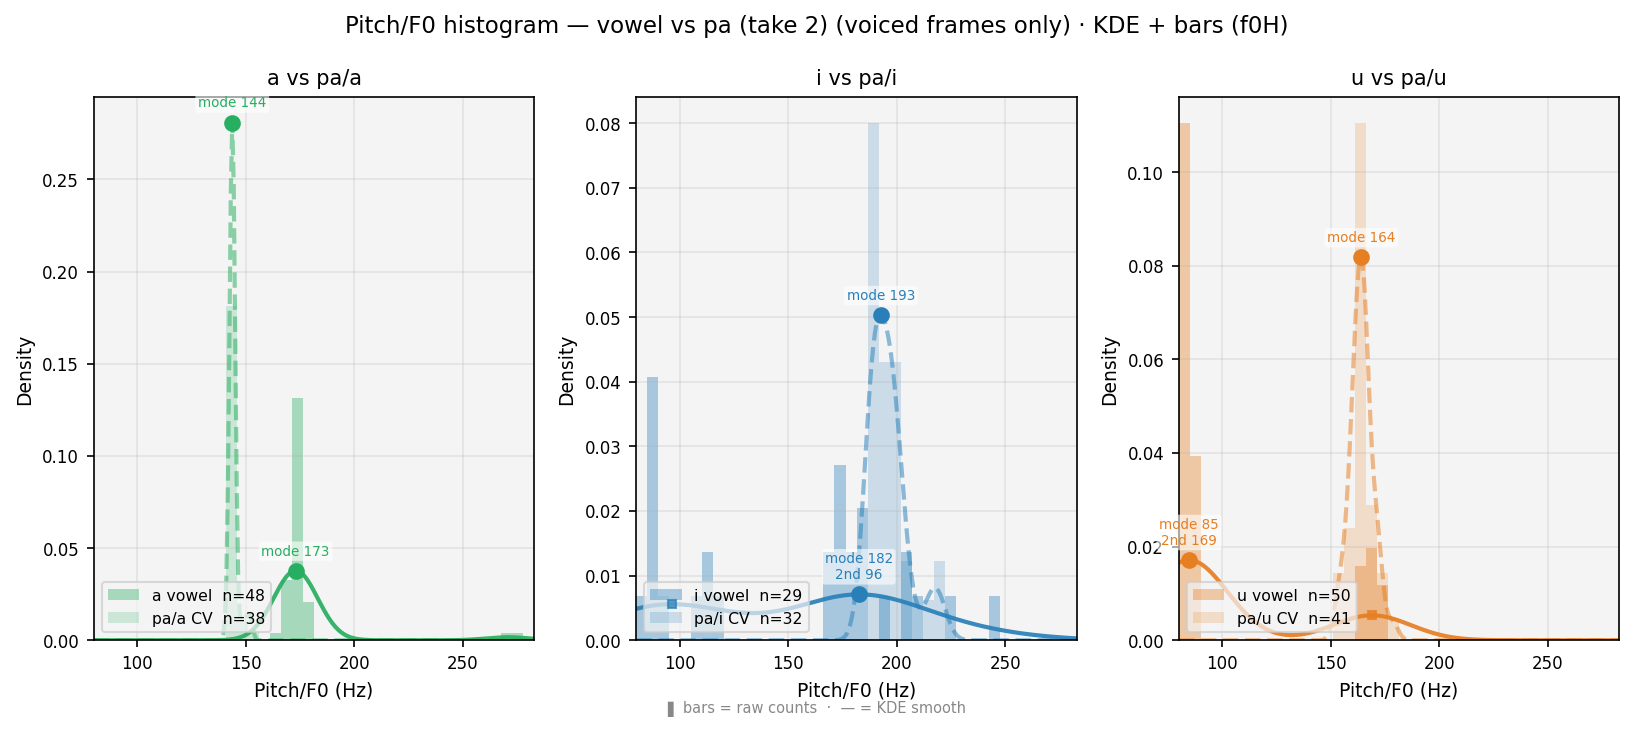
Smoothed histogram (each curve = bars drawn as a continuous line to avoid clutter from overlapping bars). Solid = vowel · Dashed = CV · voiced frames only. ● = primary peak (mode, most frequent pitch). ■ = secondary peak (onset elevation, smaller square). Thin verticals = means. Burst frames absent: voiceless stops produce no vocal-cord vibration — Praat returns NaN, so those frames never enter this plot.
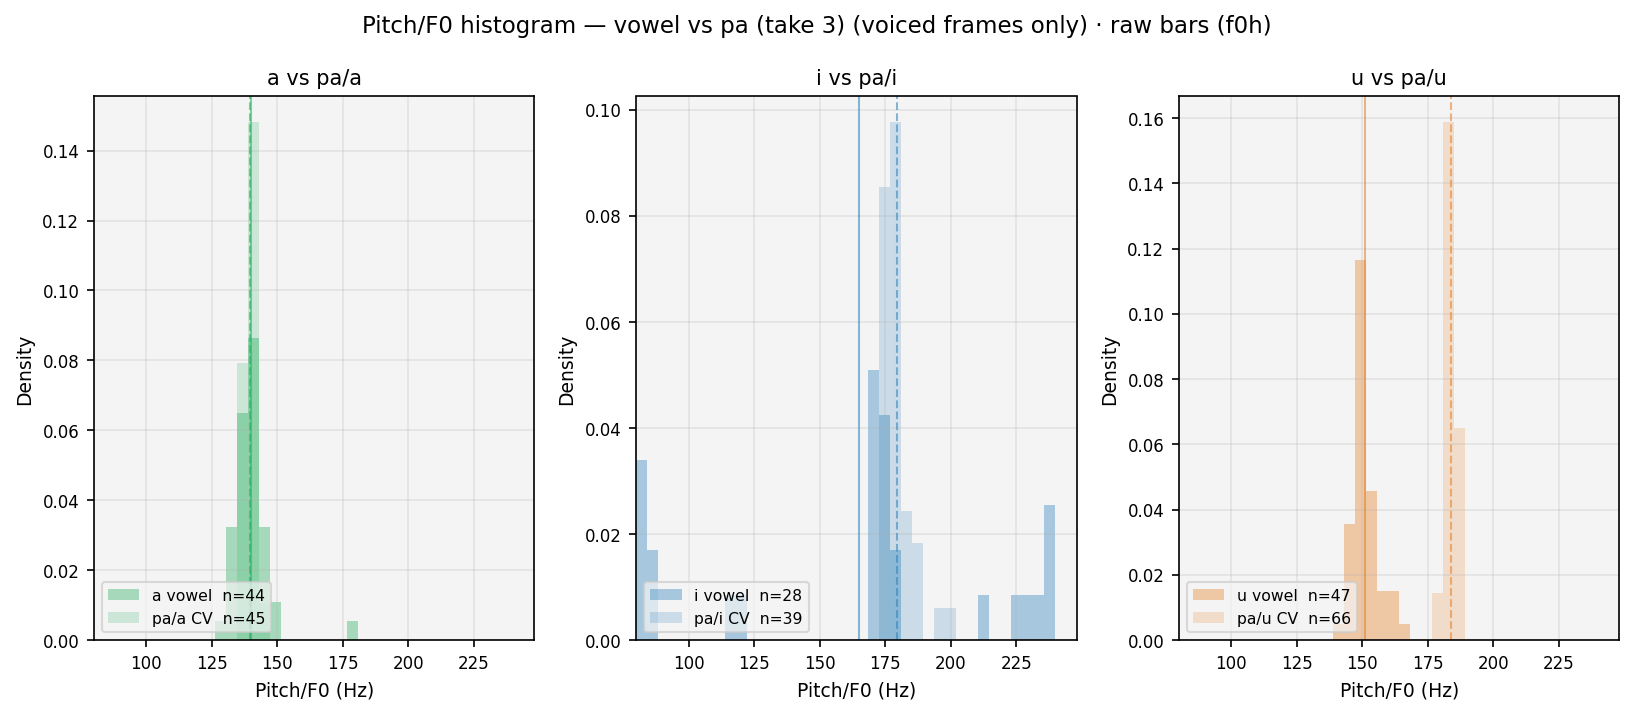
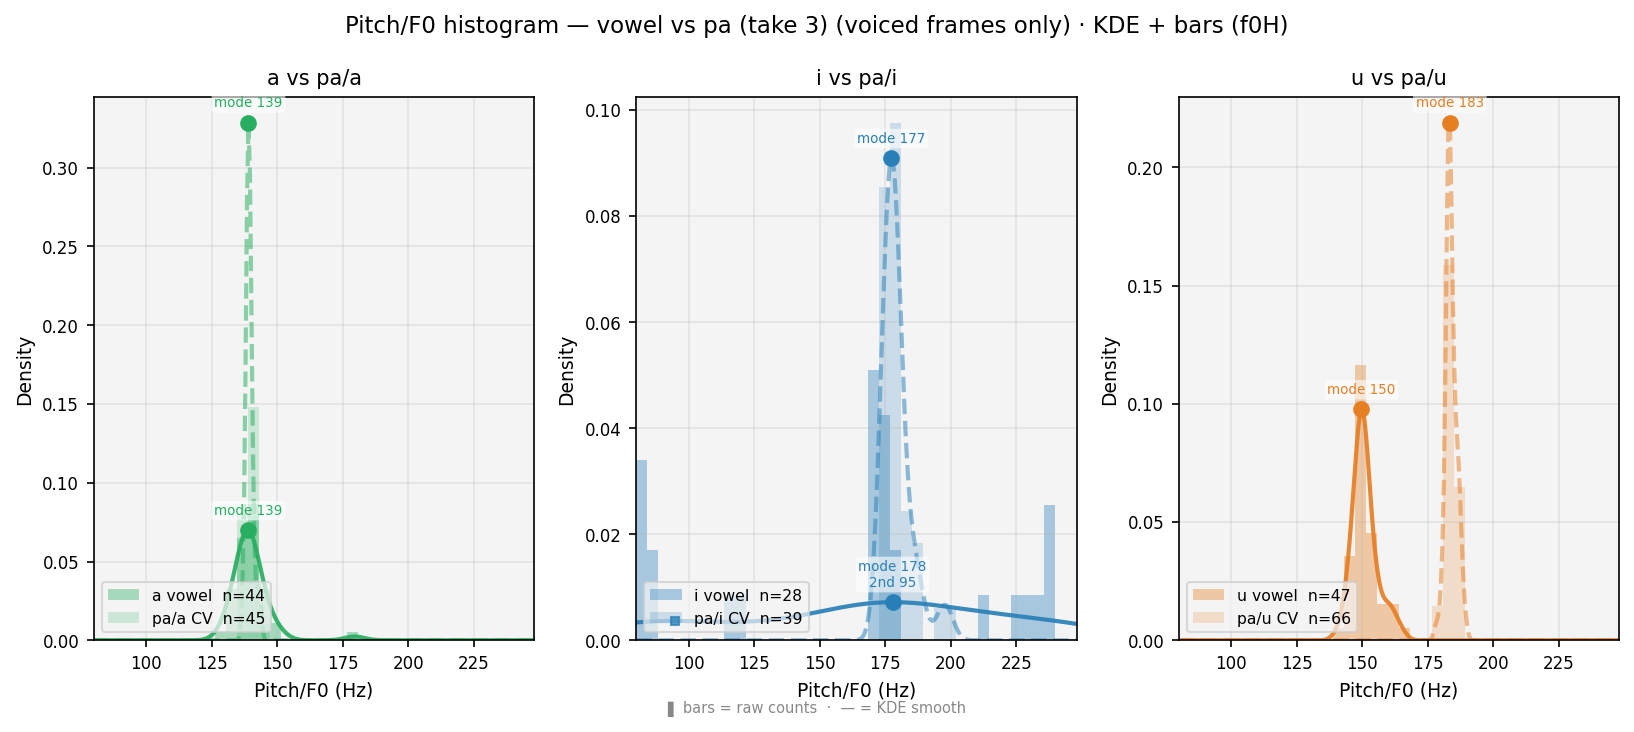
Smoothed histogram (each curve = bars drawn as a continuous line to avoid clutter from overlapping bars). Solid = vowel · Dashed = CV · voiced frames only. ● = primary peak (mode, most frequent pitch). ■ = secondary peak (onset elevation, smaller square). Thin verticals = means. Burst frames absent: voiceless stops produce no vocal-cord vibration — Praat returns NaN, so those frames never enter this plot.
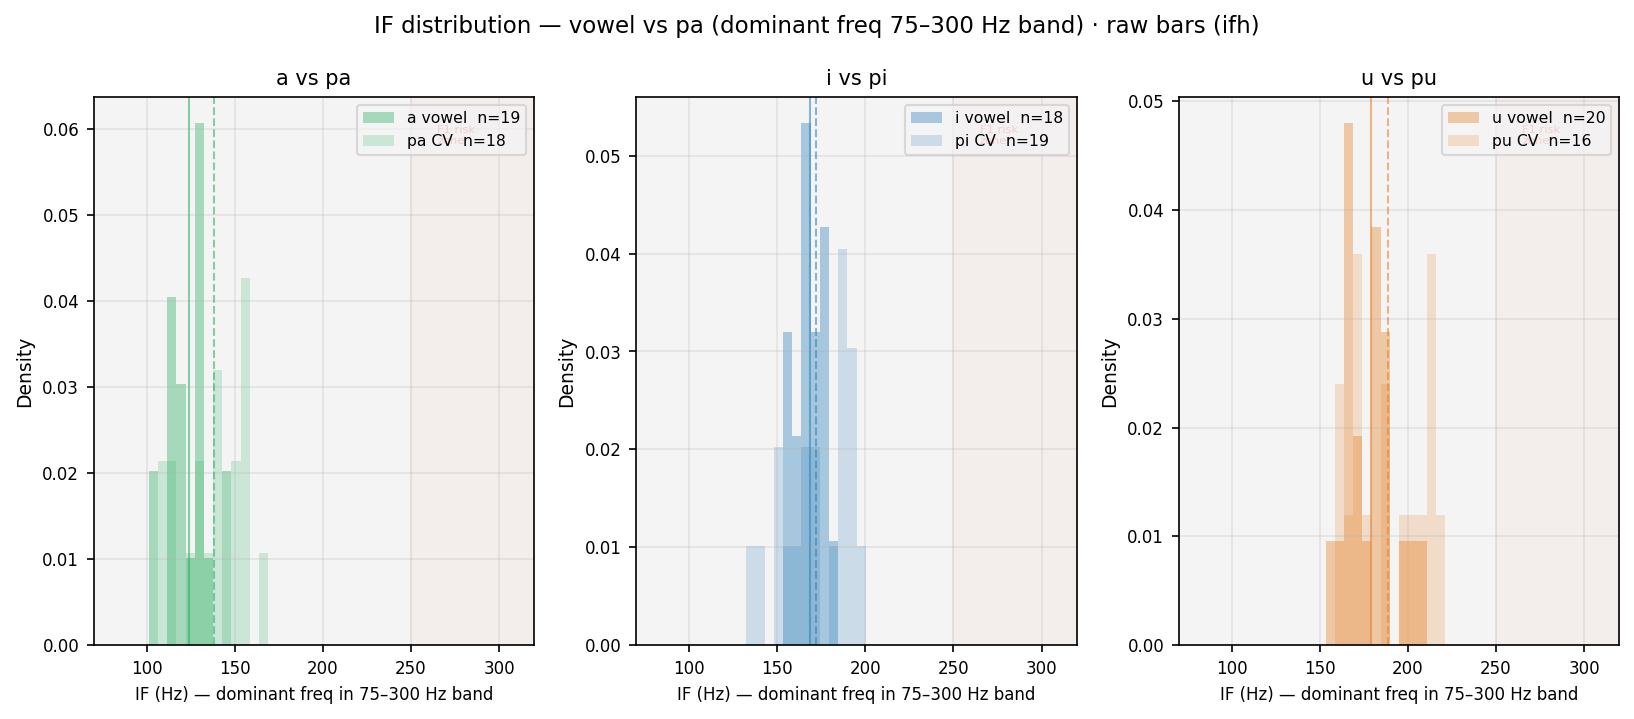
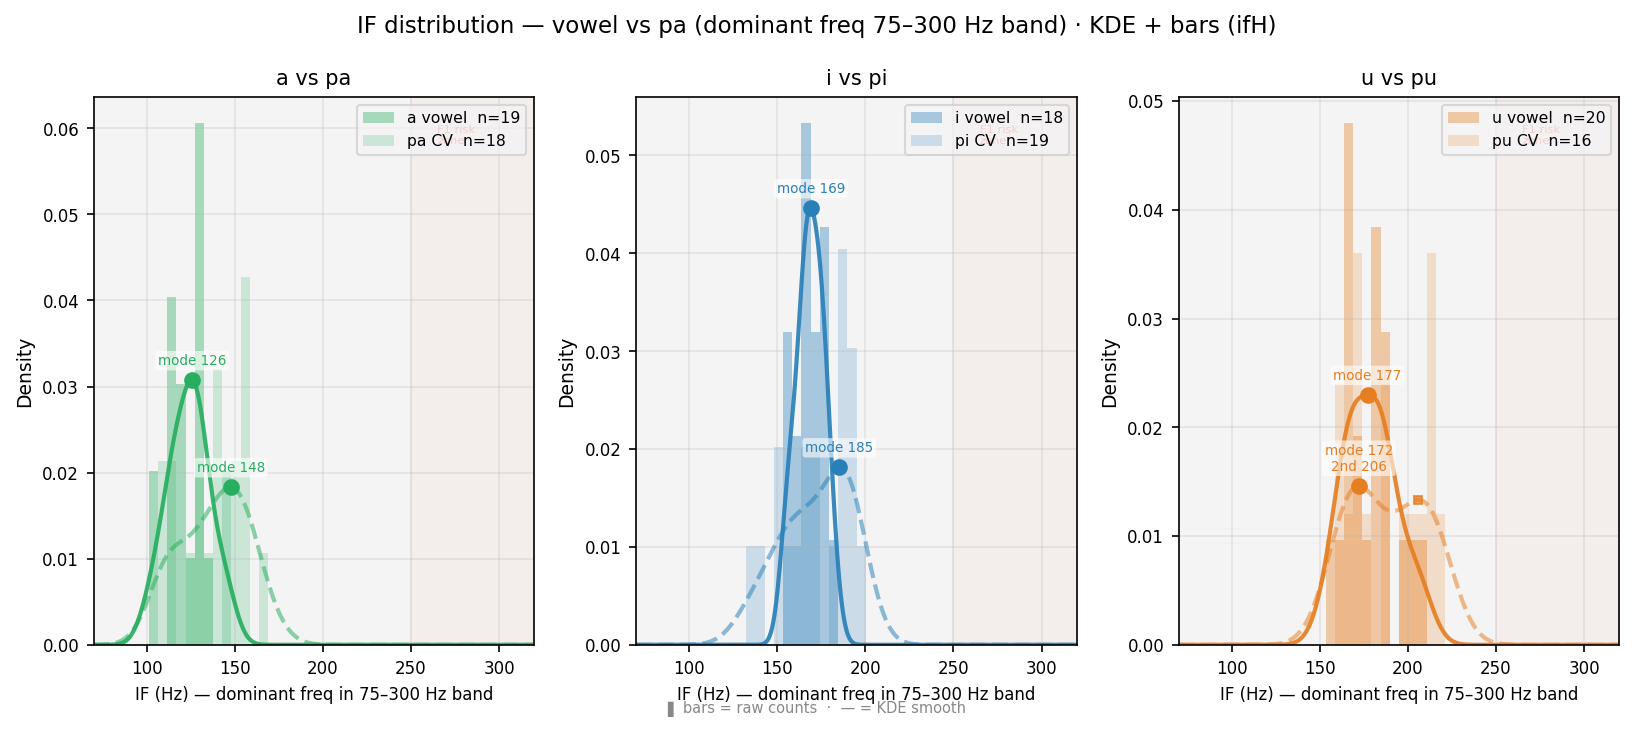
Distribution of instantaneous frequency (Hilbert transform, bandpass 75–300 Hz) at Praat frame rate. For /a/ (F1~800 Hz, outside band): IF tracks F0 — histogram aligns with Praat pitch histogram. For /i/ /u/ (F1~280–300 Hz, inside band): IF may track F1 — red-shaded zone marks this risk. Comparison of vowel vs CV curves shows coarticulation effect on dominant bandpass frequency. ● primary peak · ■ secondary peak.
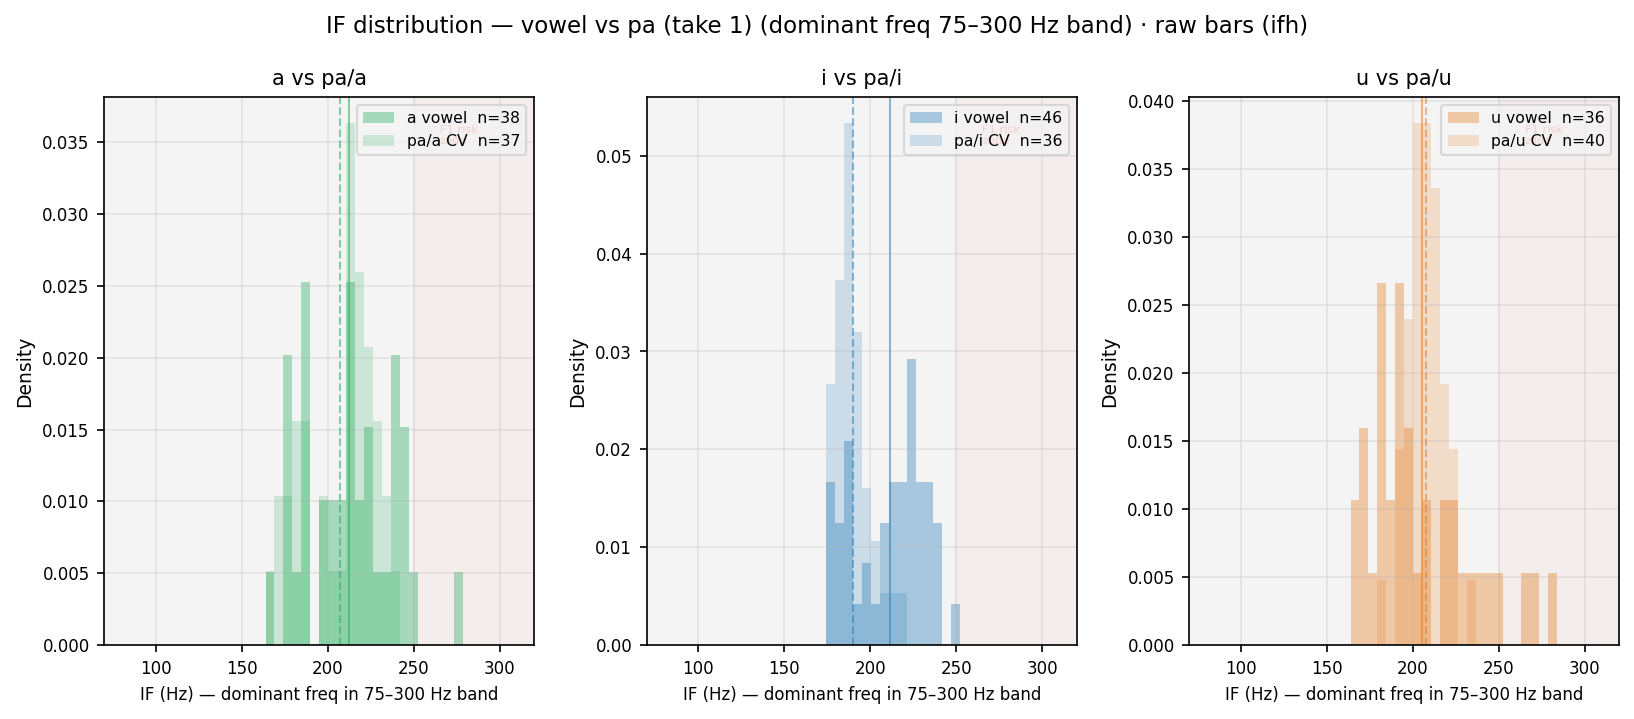
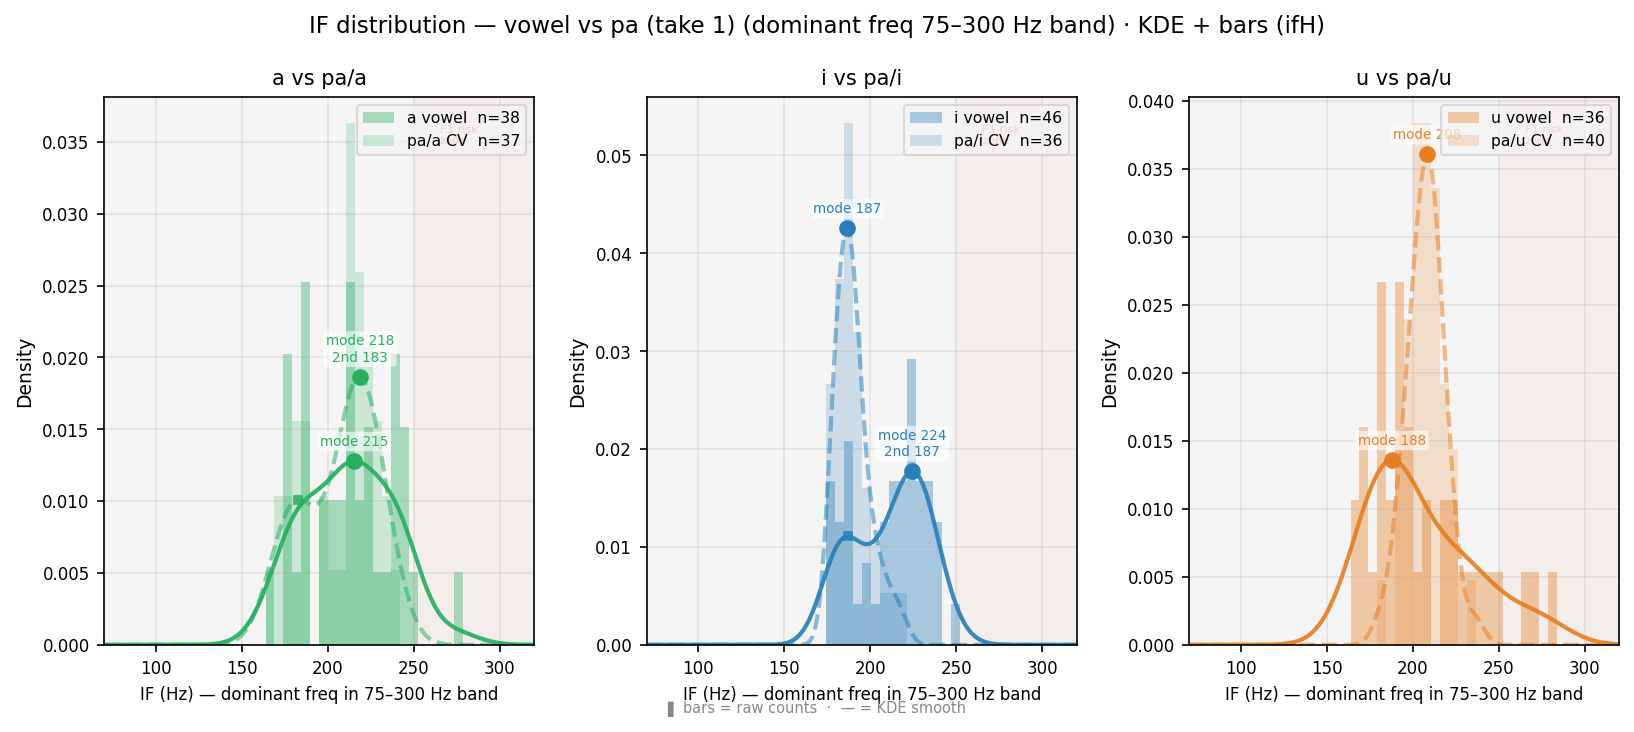
Distribution of instantaneous frequency (Hilbert transform, bandpass 75–300 Hz) at Praat frame rate. For /a/ (F1~800 Hz, outside band): IF tracks F0 — histogram aligns with Praat pitch histogram. For /i/ /u/ (F1~280–300 Hz, inside band): IF may track F1 — red-shaded zone marks this risk. Comparison of vowel vs CV curves shows coarticulation effect on dominant bandpass frequency. ● primary peak · ■ secondary peak.
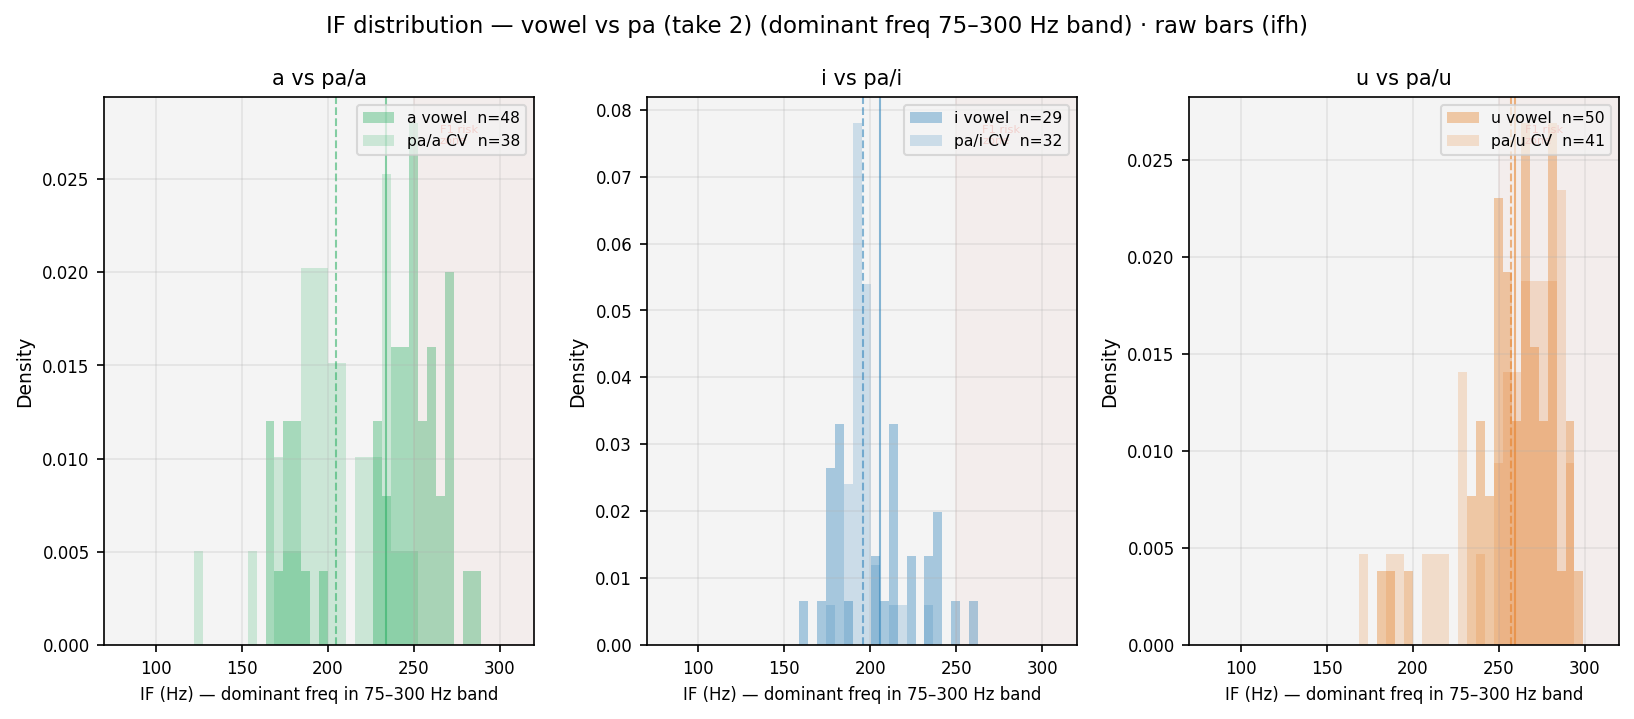
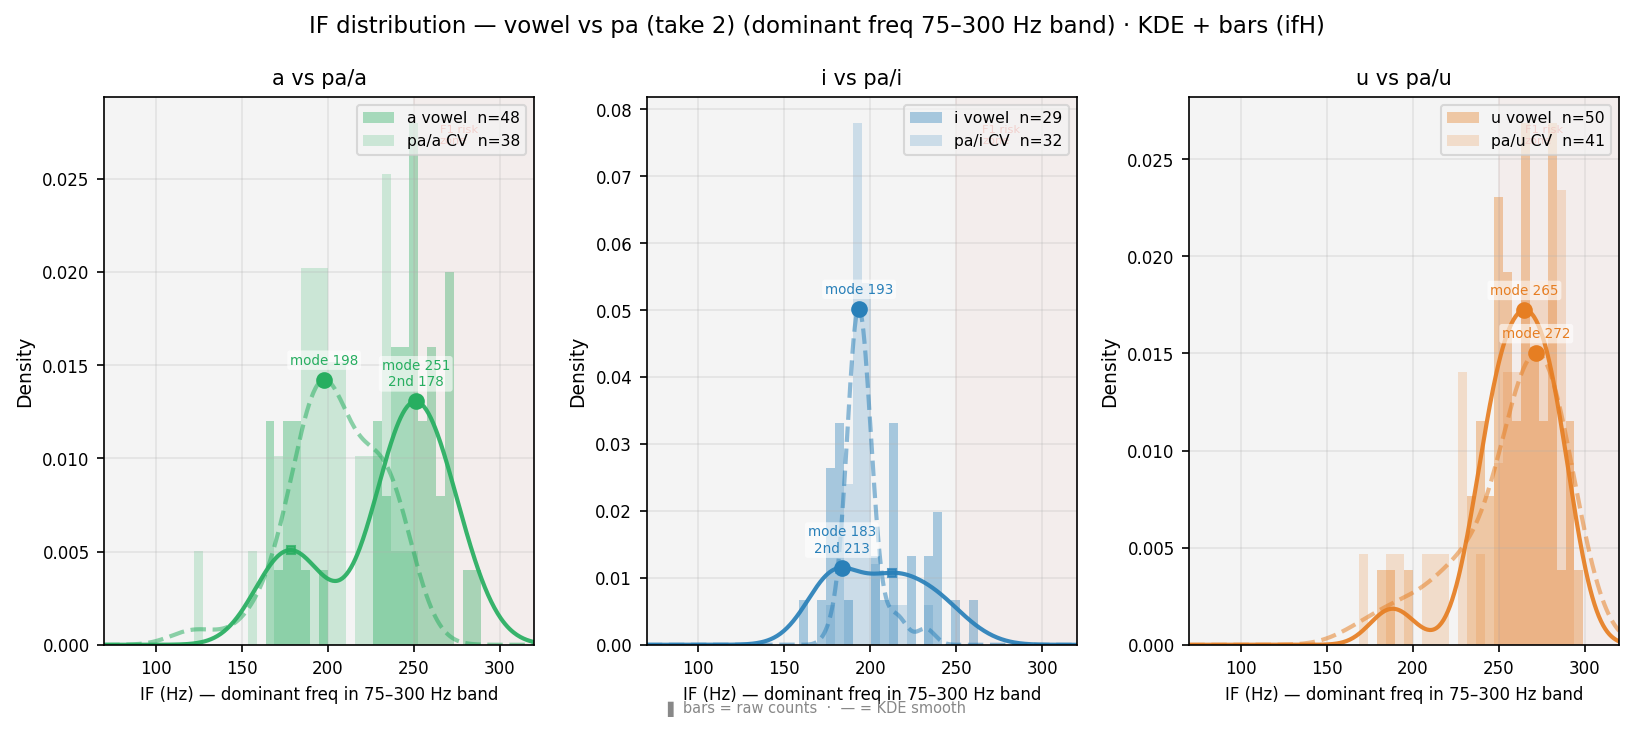
Distribution of instantaneous frequency (Hilbert transform, bandpass 75–300 Hz) at Praat frame rate. For /a/ (F1~800 Hz, outside band): IF tracks F0 — histogram aligns with Praat pitch histogram. For /i/ /u/ (F1~280–300 Hz, inside band): IF may track F1 — red-shaded zone marks this risk. Comparison of vowel vs CV curves shows coarticulation effect on dominant bandpass frequency. ● primary peak · ■ secondary peak.
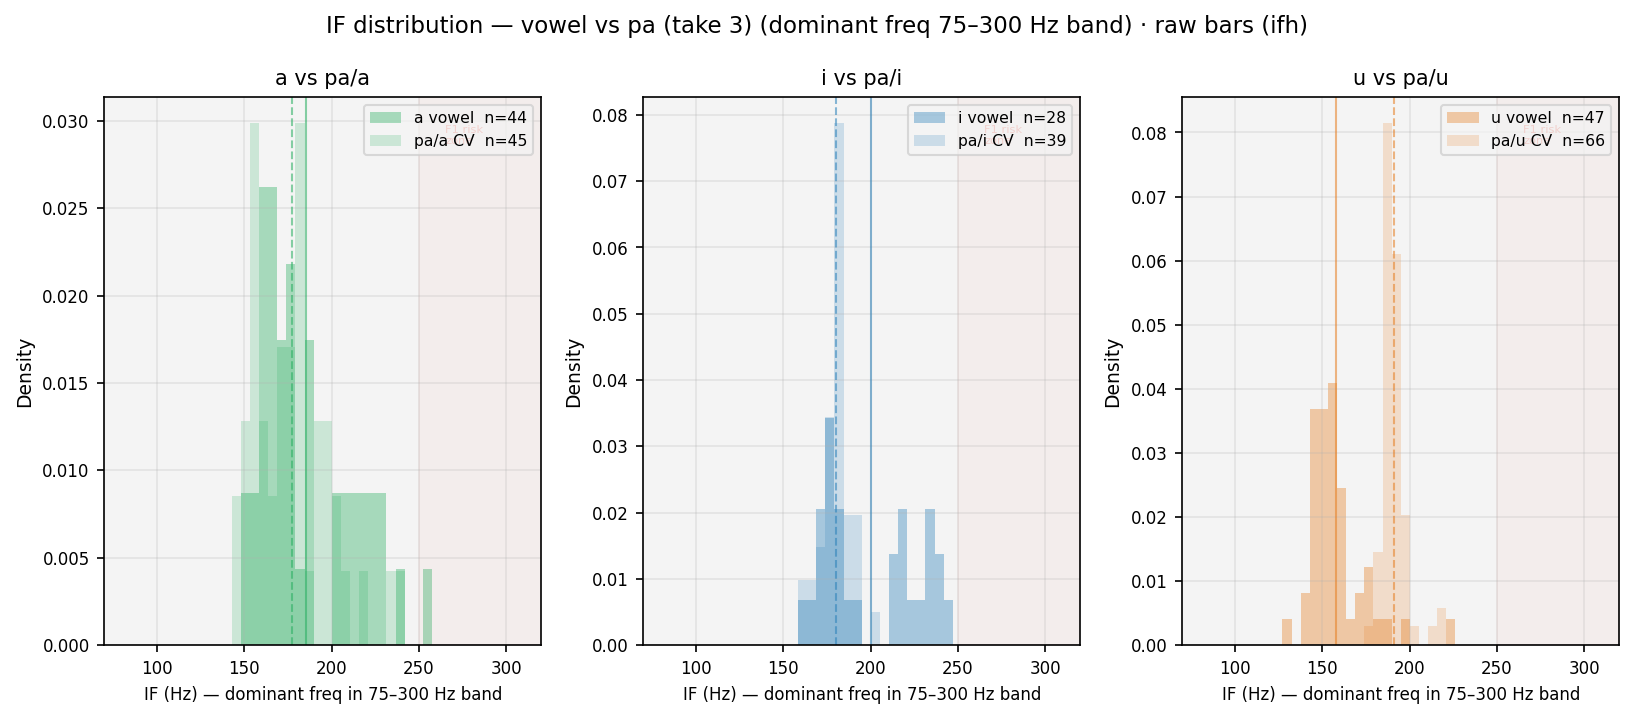
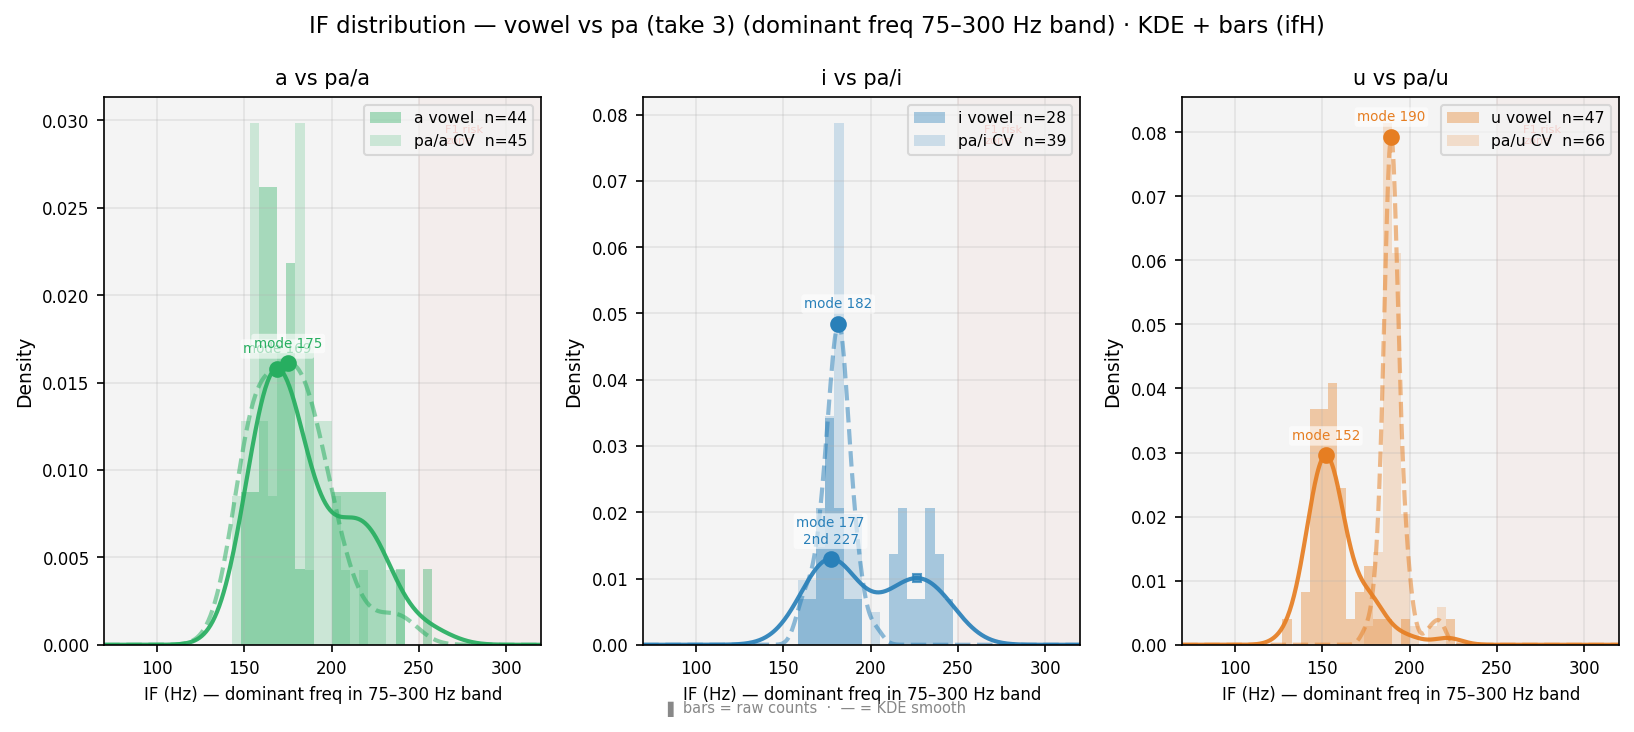
Distribution of instantaneous frequency (Hilbert transform, bandpass 75–300 Hz) at Praat frame rate. For /a/ (F1~800 Hz, outside band): IF tracks F0 — histogram aligns with Praat pitch histogram. For /i/ /u/ (F1~280–300 Hz, inside band): IF may track F1 — red-shaded zone marks this risk. Comparison of vowel vs CV curves shows coarticulation effect on dominant bandpass frequency. ● primary peak · ■ secondary peak.
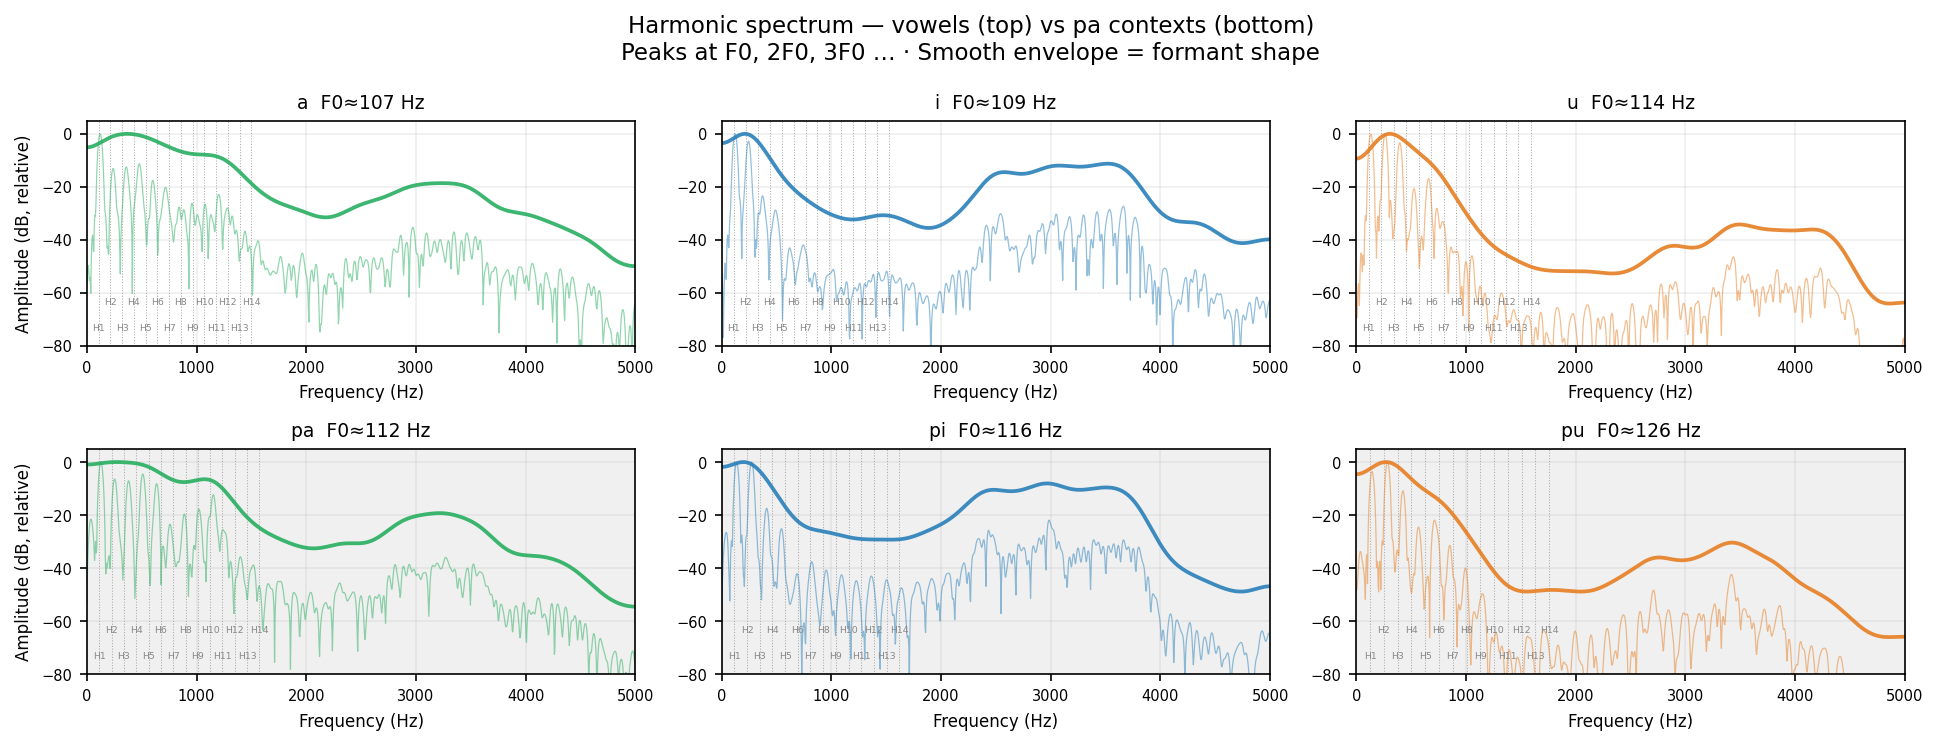
Plain reading: A vowel is a mixture of tones all sounding together. The lowest tone is the fundamental (H1 ≈ F0, ~100 Hz for this voice). The voice also produces tones at exactly 2×, 3×, 4× that frequency — these are harmonics (H2, H3, …). The shape of the mouth amplifies some harmonics more than others; those amplified regions appear as bumps in the smooth envelope — those are the formants (F1 F2 F3). Changing the vowel (अ → इ → उ) reshapes the mouth and shifts the envelope bumps while keeping the comb spacing (F0) the same. Technical: FFT of 50 ms steady-state (20–70 ms after voicing onset). Thin line = raw spectrum · bold line = Gaussian-smoothed spectral envelope (~150 Hz width). Dotted verticals = expected harmonics at n×F0. Y-axis normalised to 0 dB at peak.
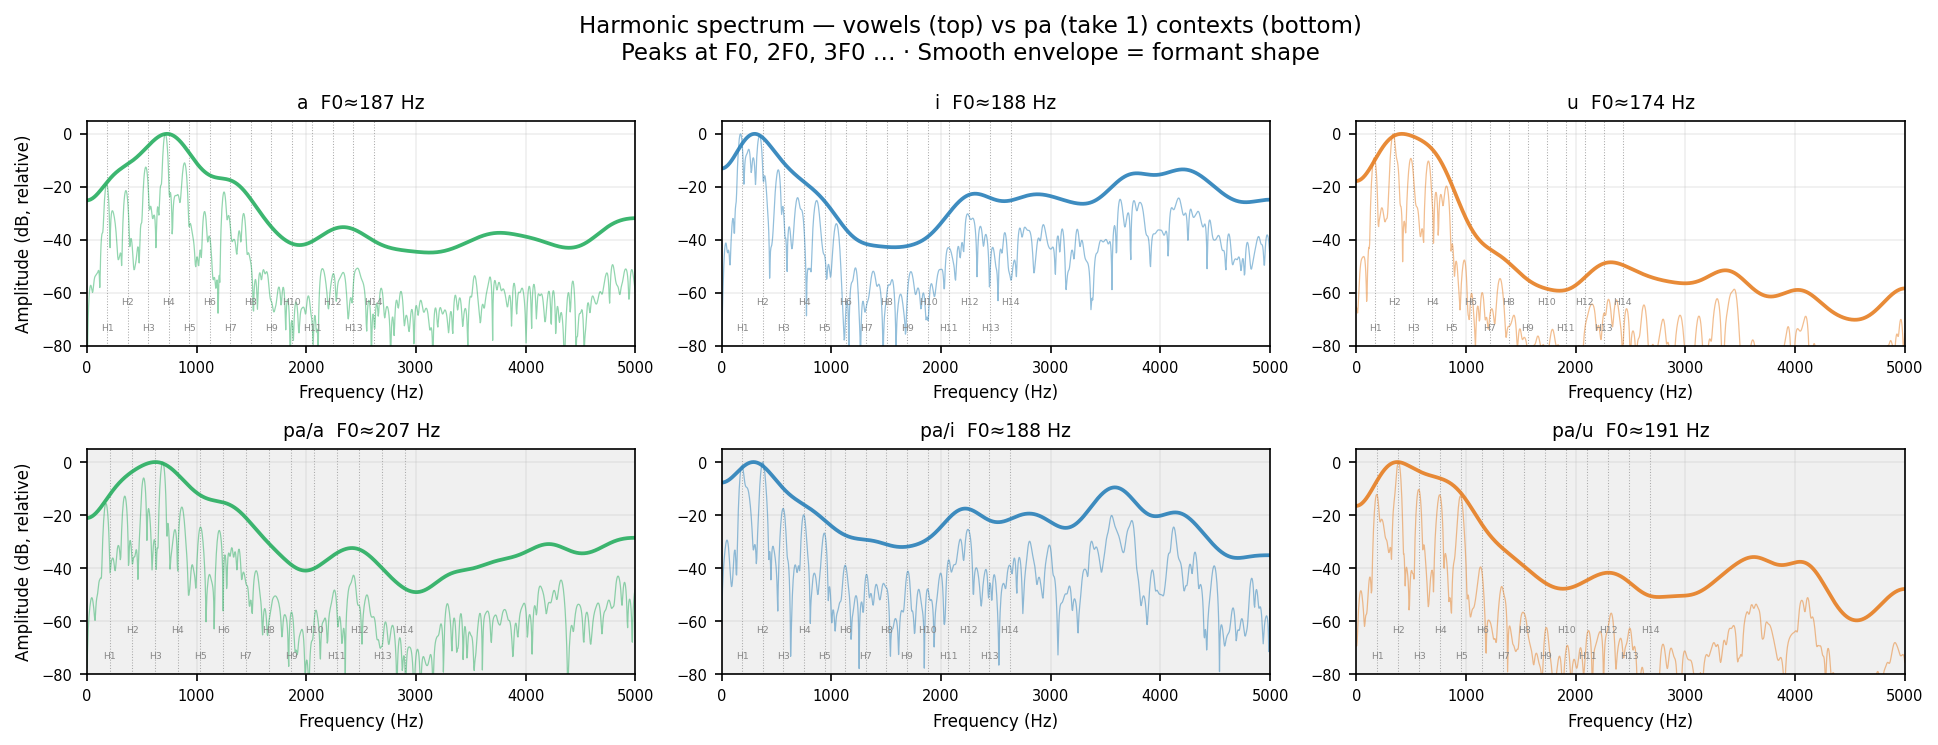
Human take 1
Plain reading: A vowel is a mixture of tones all sounding together. The lowest tone is the fundamental (H1 ≈ F0, ~100 Hz for this voice). The voice also produces tones at exactly 2×, 3×, 4× that frequency — these are harmonics (H2, H3, …). The shape of the mouth amplifies some harmonics more than others; those amplified regions appear as bumps in the smooth envelope — those are the formants (F1 F2 F3). Changing the vowel (अ → इ → उ) reshapes the mouth and shifts the envelope bumps while keeping the comb spacing (F0) the same. Technical: FFT of 50 ms steady-state (20–70 ms after voicing onset). Thin line = raw spectrum · bold line = Gaussian-smoothed spectral envelope (~150 Hz width). Dotted verticals = expected harmonics at n×F0. Y-axis normalised to 0 dB at peak.
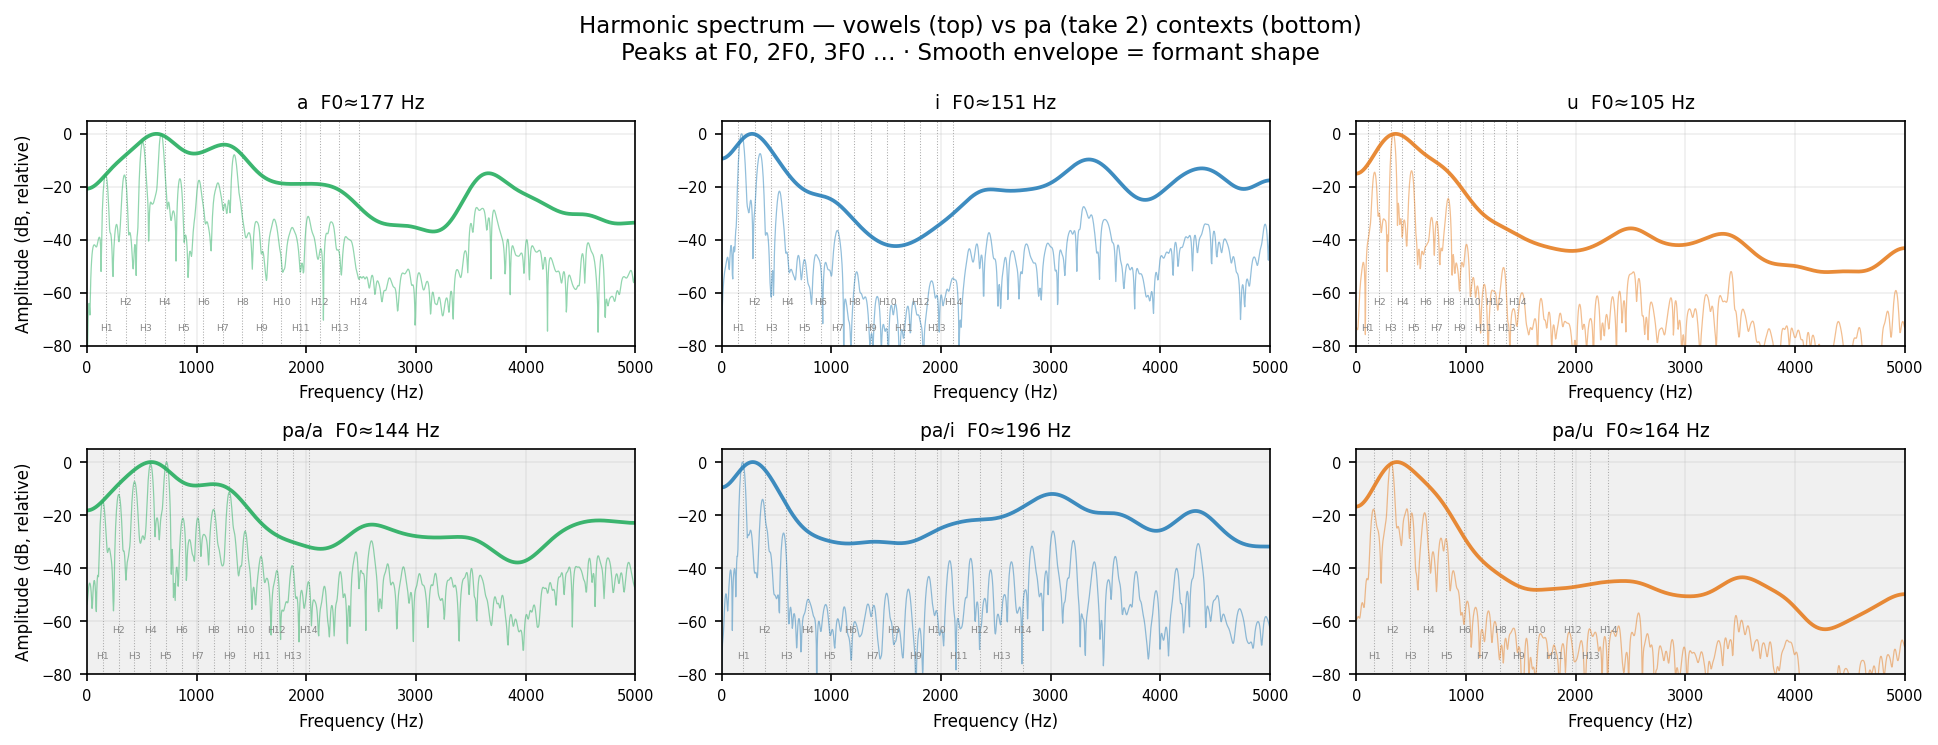
Human take 2
Plain reading: A vowel is a mixture of tones all sounding together. The lowest tone is the fundamental (H1 ≈ F0, ~100 Hz for this voice). The voice also produces tones at exactly 2×, 3×, 4× that frequency — these are harmonics (H2, H3, …). The shape of the mouth amplifies some harmonics more than others; those amplified regions appear as bumps in the smooth envelope — those are the formants (F1 F2 F3). Changing the vowel (अ → इ → उ) reshapes the mouth and shifts the envelope bumps while keeping the comb spacing (F0) the same. Technical: FFT of 50 ms steady-state (20–70 ms after voicing onset). Thin line = raw spectrum · bold line = Gaussian-smoothed spectral envelope (~150 Hz width). Dotted verticals = expected harmonics at n×F0. Y-axis normalised to 0 dB at peak.
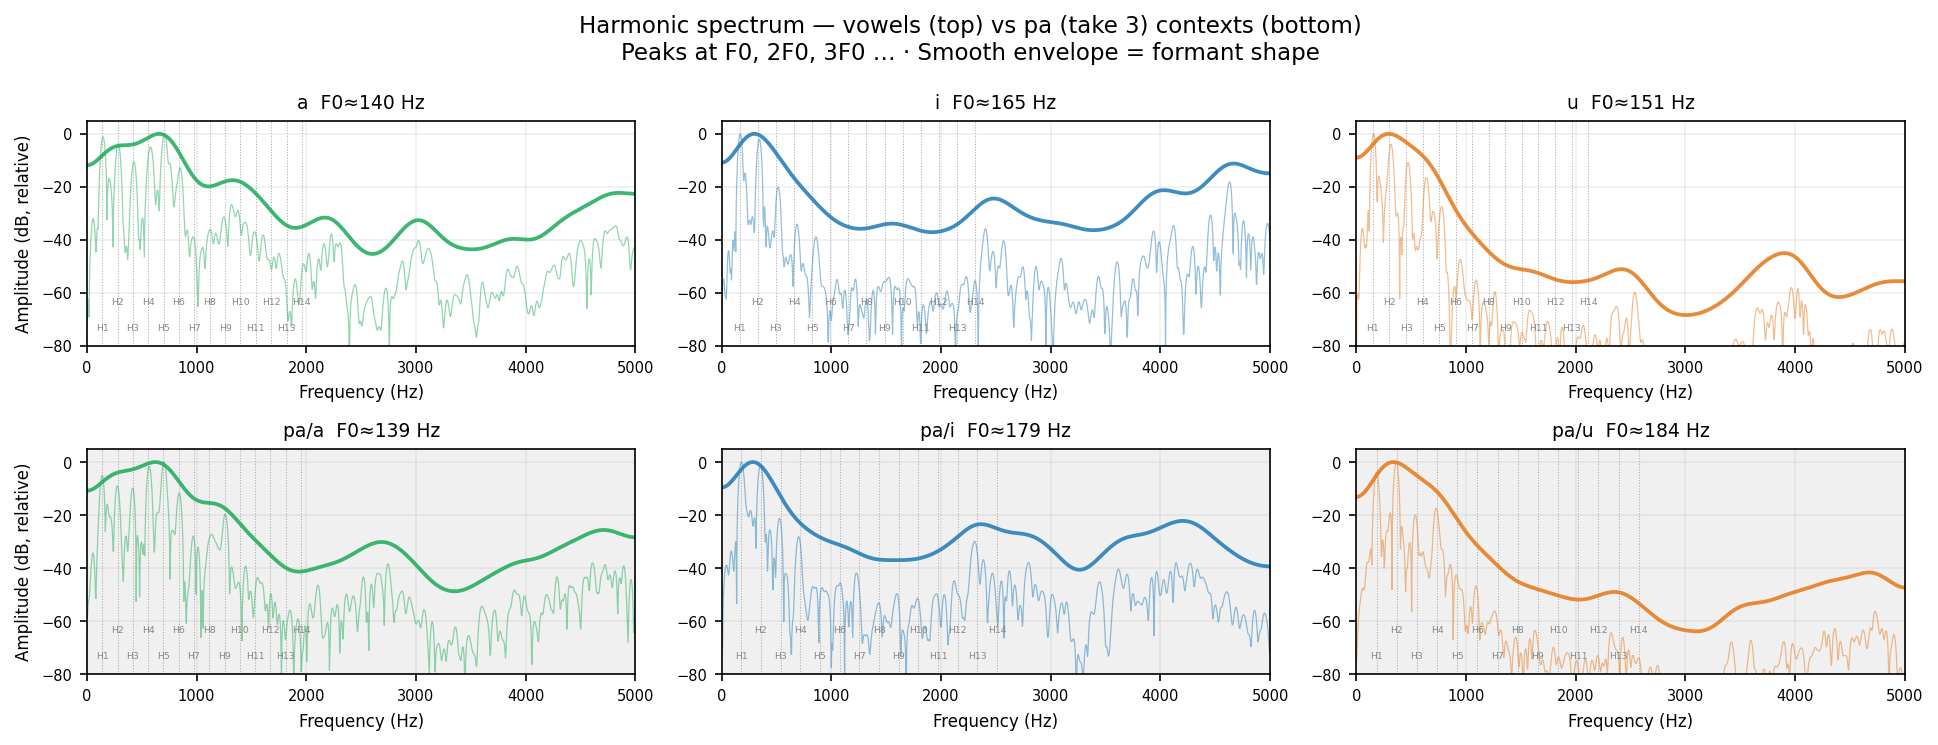
Human take 3
Plain reading: A vowel is a mixture of tones all sounding together. The lowest tone is the fundamental (H1 ≈ F0, ~100 Hz for this voice). The voice also produces tones at exactly 2×, 3×, 4× that frequency — these are harmonics (H2, H3, …). The shape of the mouth amplifies some harmonics more than others; those amplified regions appear as bumps in the smooth envelope — those are the formants (F1 F2 F3). Changing the vowel (अ → इ → उ) reshapes the mouth and shifts the envelope bumps while keeping the comb spacing (F0) the same. Technical: FFT of 50 ms steady-state (20–70 ms after voicing onset). Thin line = raw spectrum · bold line = Gaussian-smoothed spectral envelope (~150 Hz width). Dotted verticals = expected harmonics at n×F0. Y-axis normalised to 0 dB at peak.
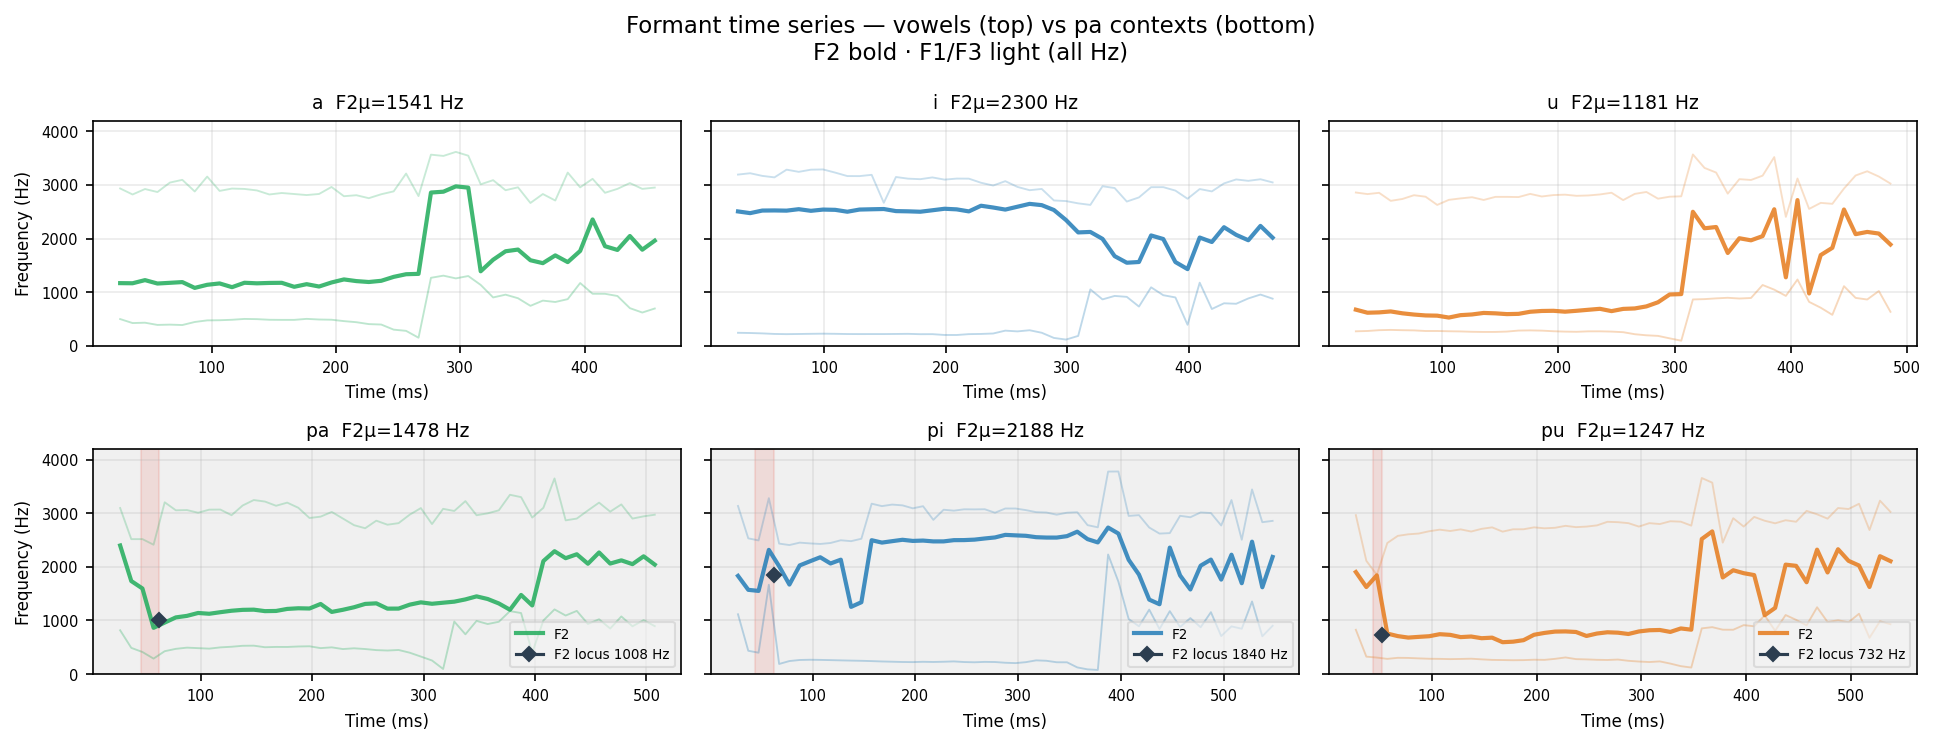
F2 bold · F1/F3 light (alpha). ◆ = F2 locus (F2 at voicing onset = place of articulation marker). Red shade = burst window.
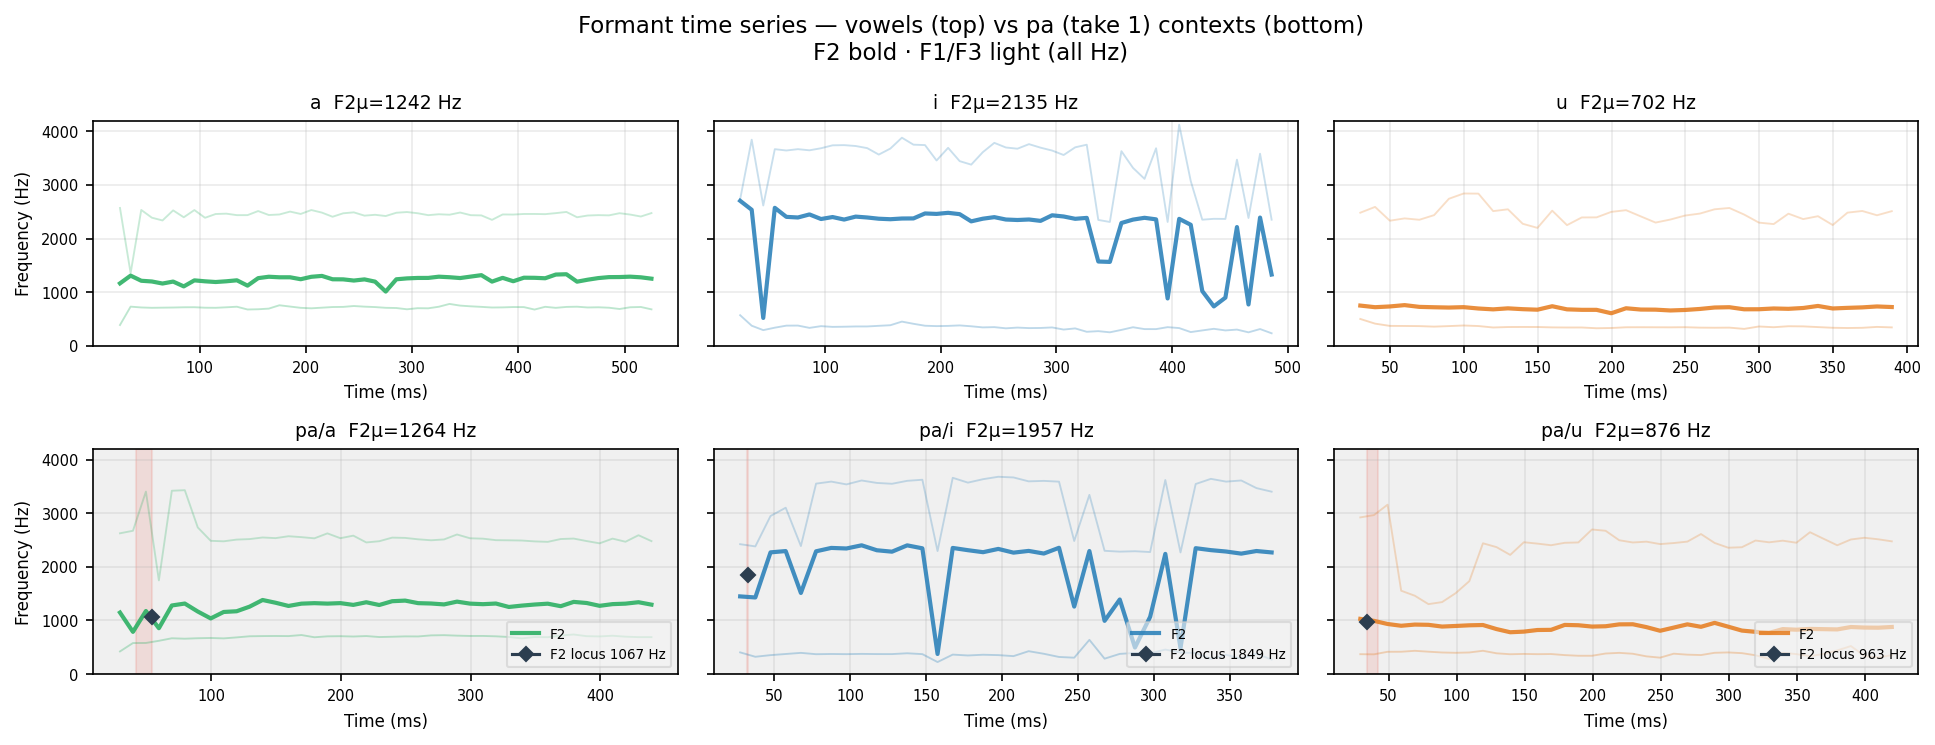
Human take 1
F2 bold · F1/F3 light (alpha). ◆ = F2 locus (F2 at voicing onset = place of articulation marker). Red shade = burst window.
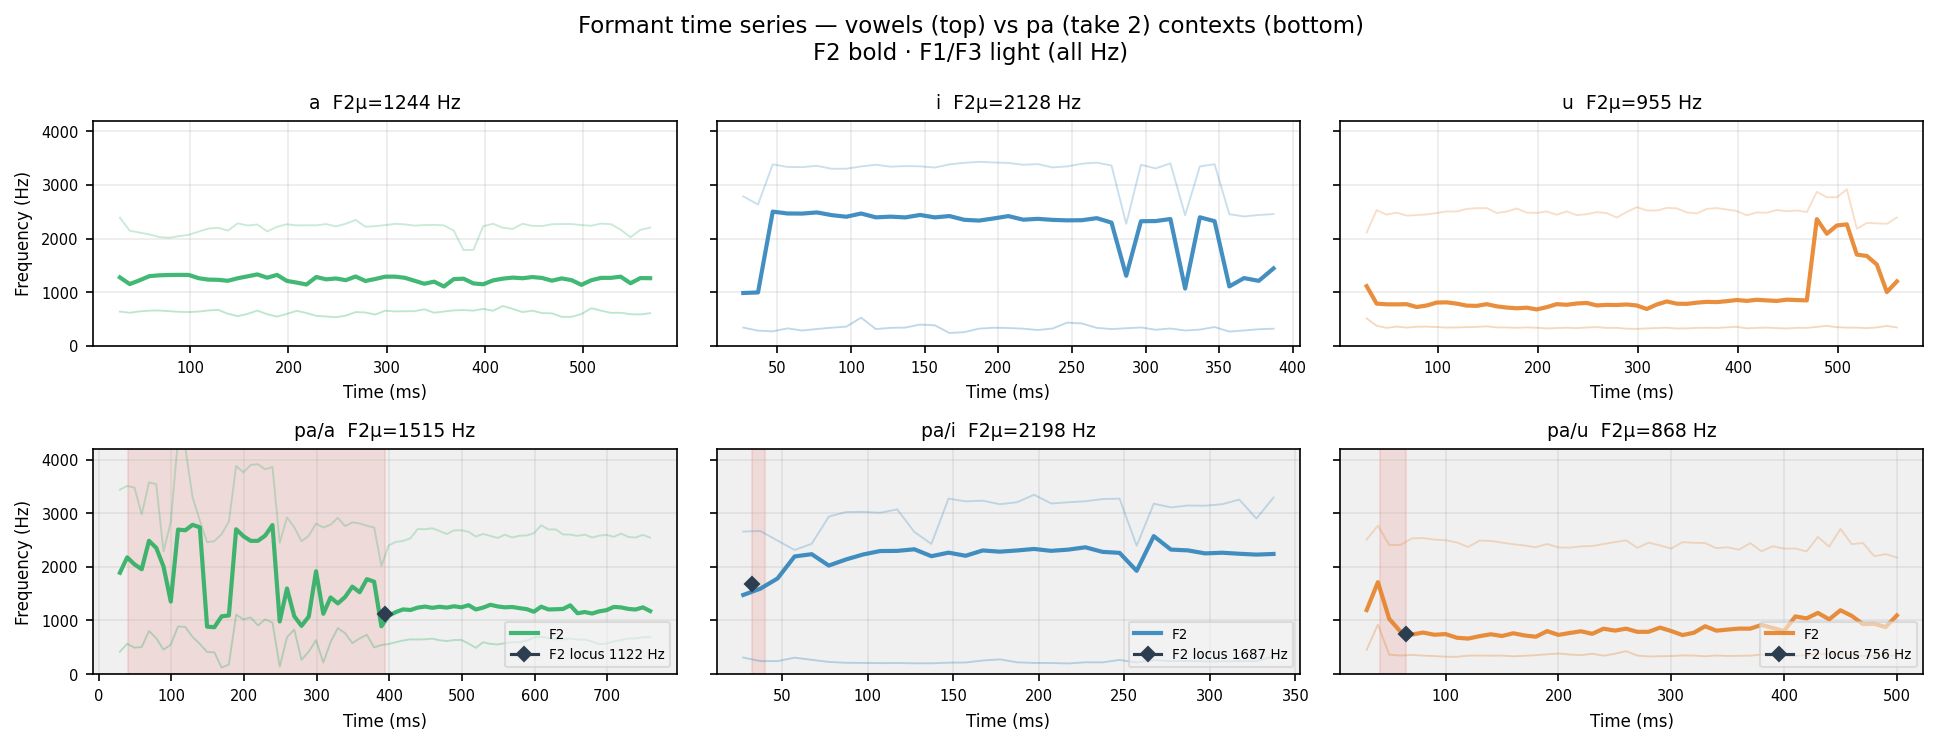
Human take 2
F2 bold · F1/F3 light (alpha). ◆ = F2 locus (F2 at voicing onset = place of articulation marker). Red shade = burst window.
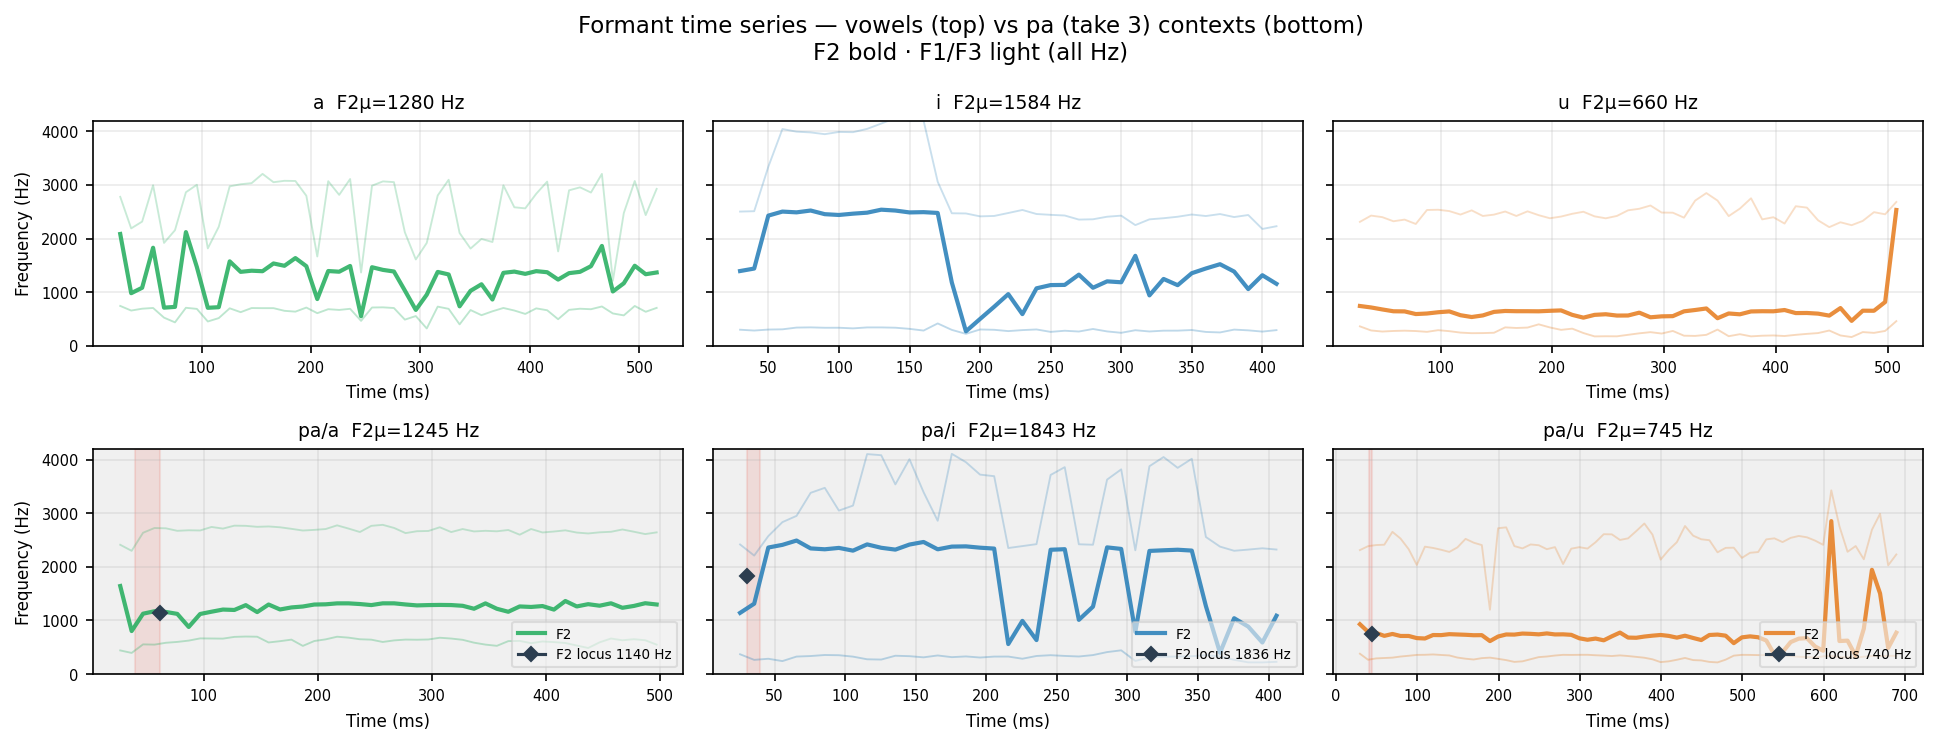
Human take 3
F2 bold · F1/F3 light (alpha). ◆ = F2 locus (F2 at voicing onset = place of articulation marker). Red shade = burst window.
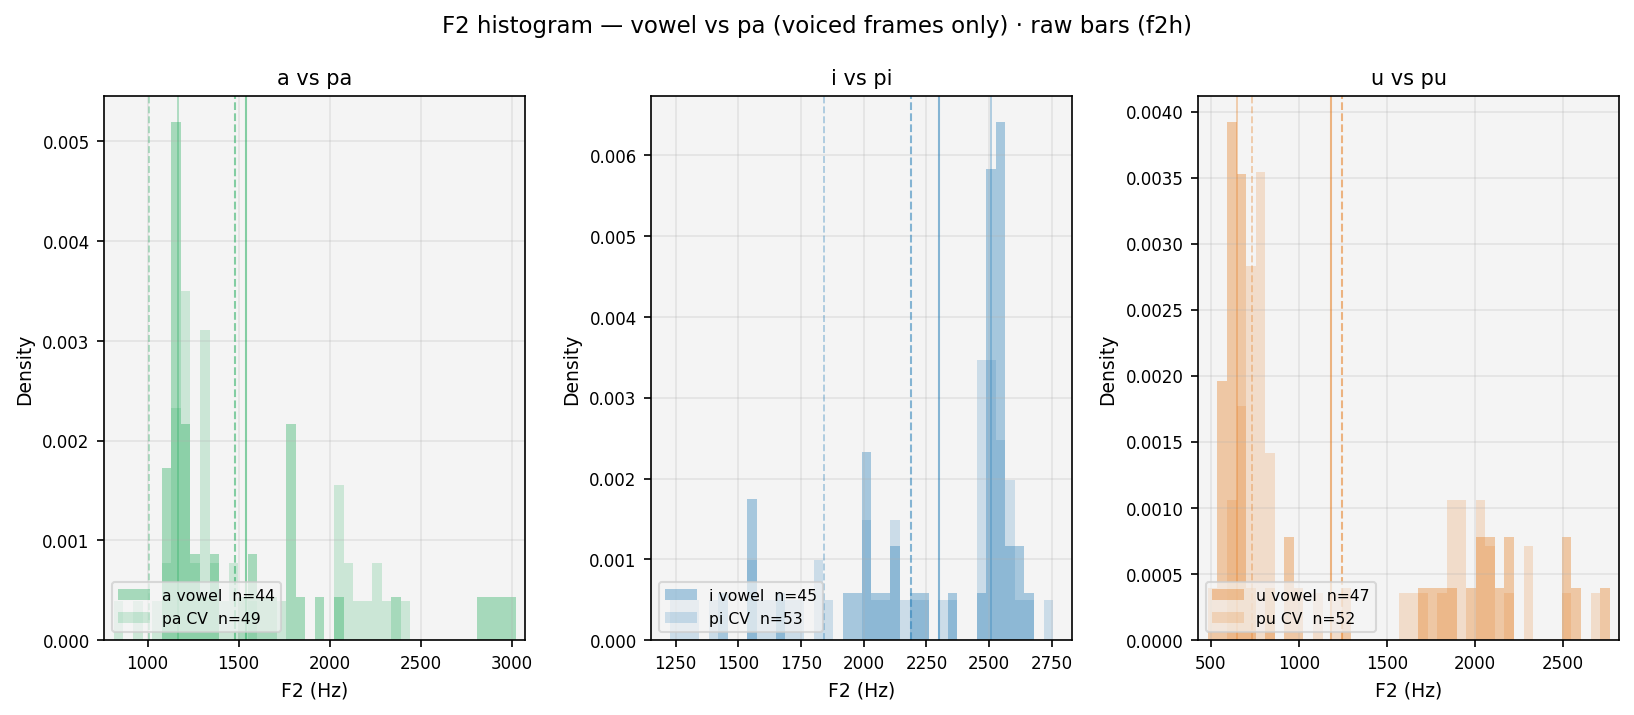
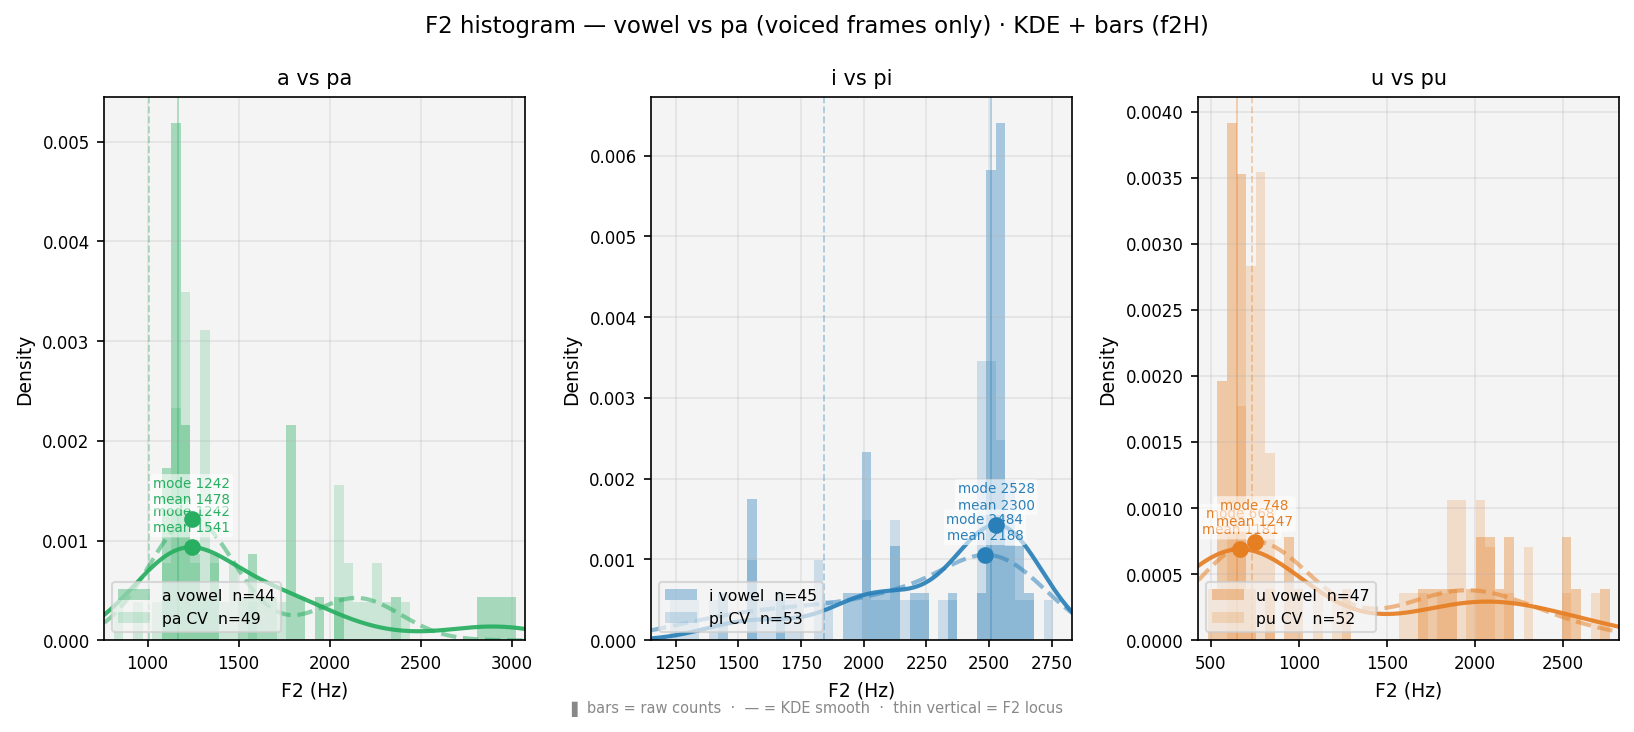
F2 smoothed histogram — vowel (solid) vs CV (dashed). ● = primary peak (mode, most frequent F2). ■ = secondary peak (smaller square). Thin verticals = F2 locus (F2 at voicing onset). Shift between curves = coarticulation. Locus stability across a/i/u contexts characterises the consonant.
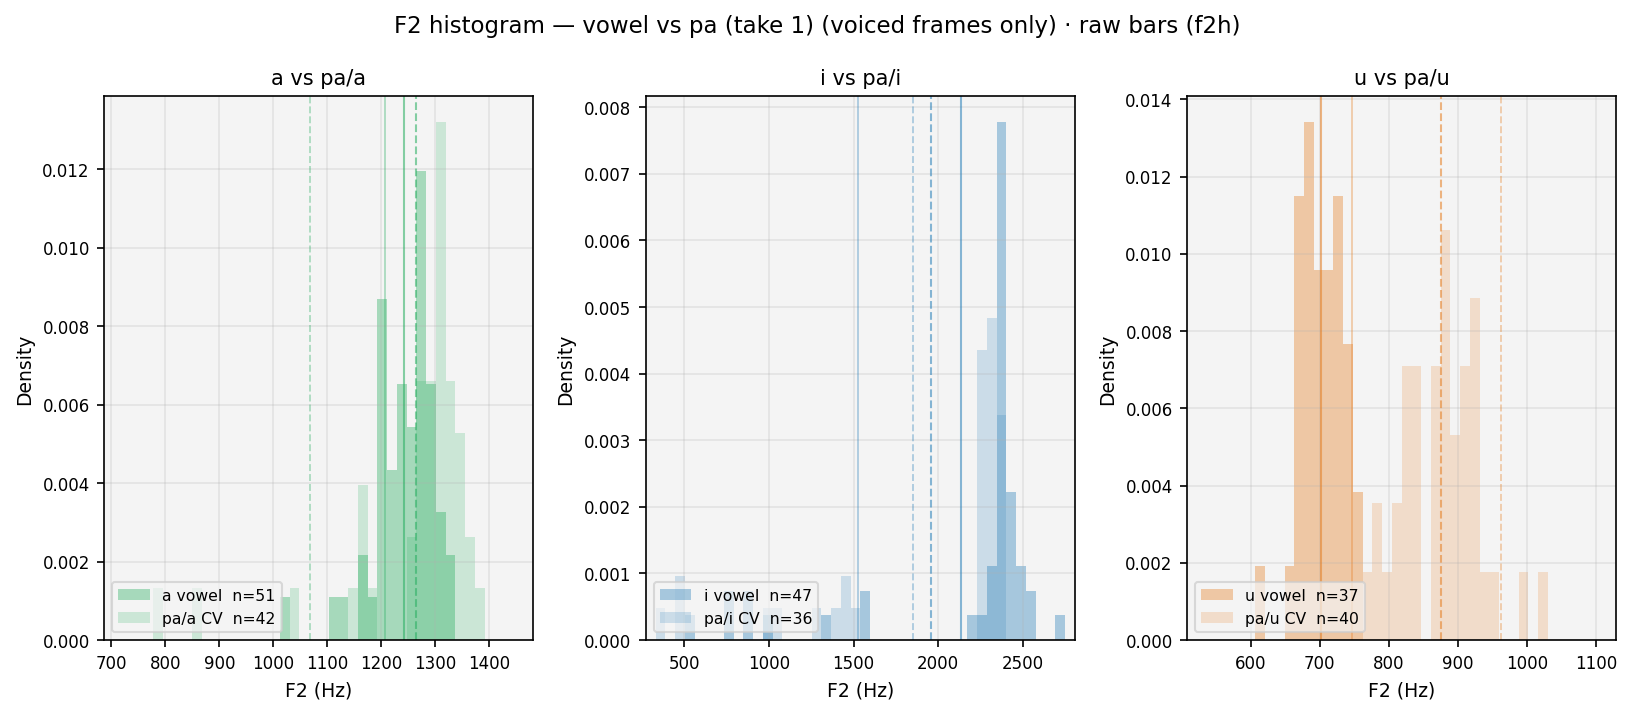
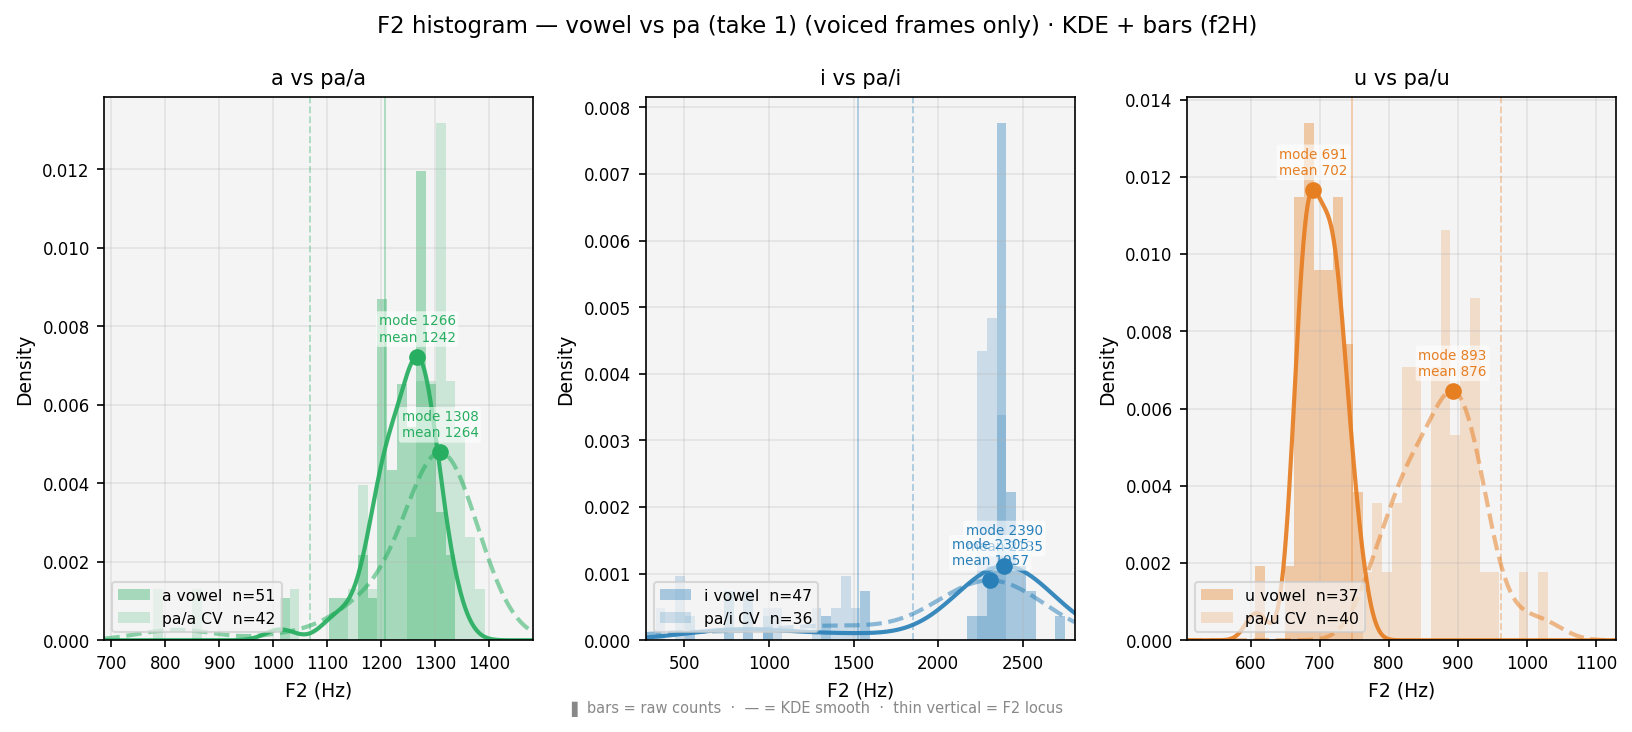
F2 smoothed histogram — vowel (solid) vs CV (dashed). ● = primary peak (mode, most frequent F2). ■ = secondary peak (smaller square). Thin verticals = F2 locus (F2 at voicing onset). Shift between curves = coarticulation. Locus stability across a/i/u contexts characterises the consonant.
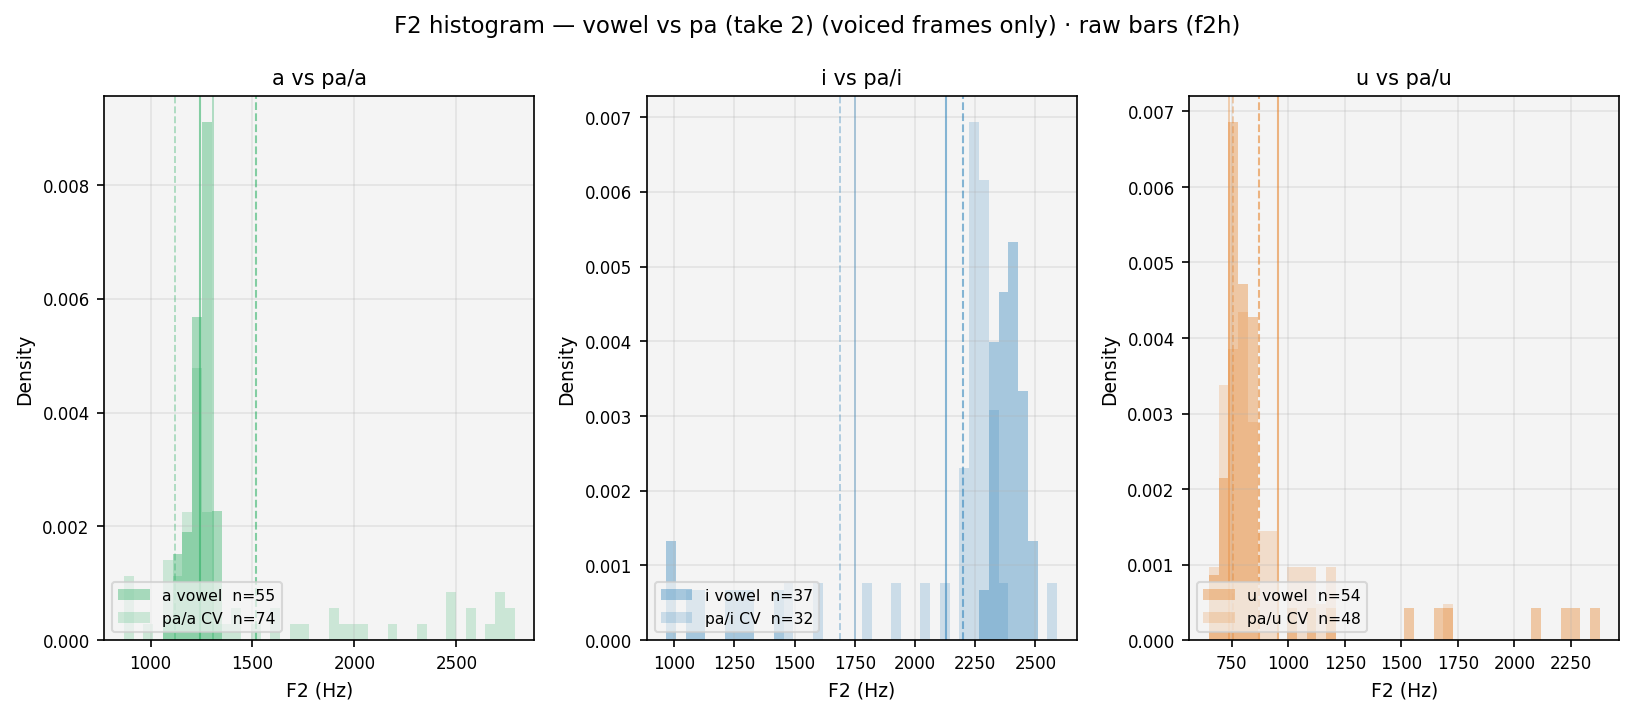
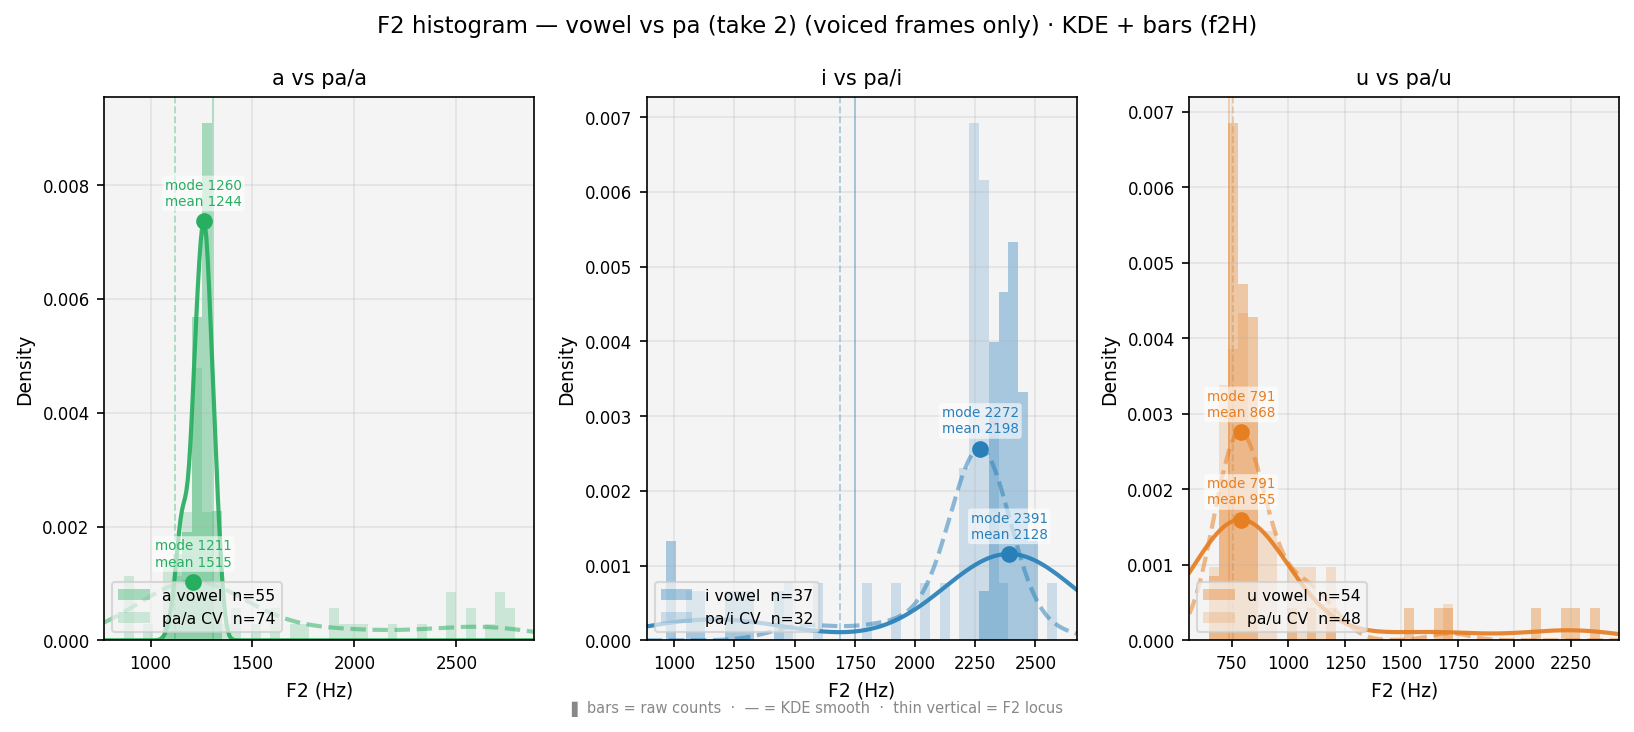
F2 smoothed histogram — vowel (solid) vs CV (dashed). ● = primary peak (mode, most frequent F2). ■ = secondary peak (smaller square). Thin verticals = F2 locus (F2 at voicing onset). Shift between curves = coarticulation. Locus stability across a/i/u contexts characterises the consonant.
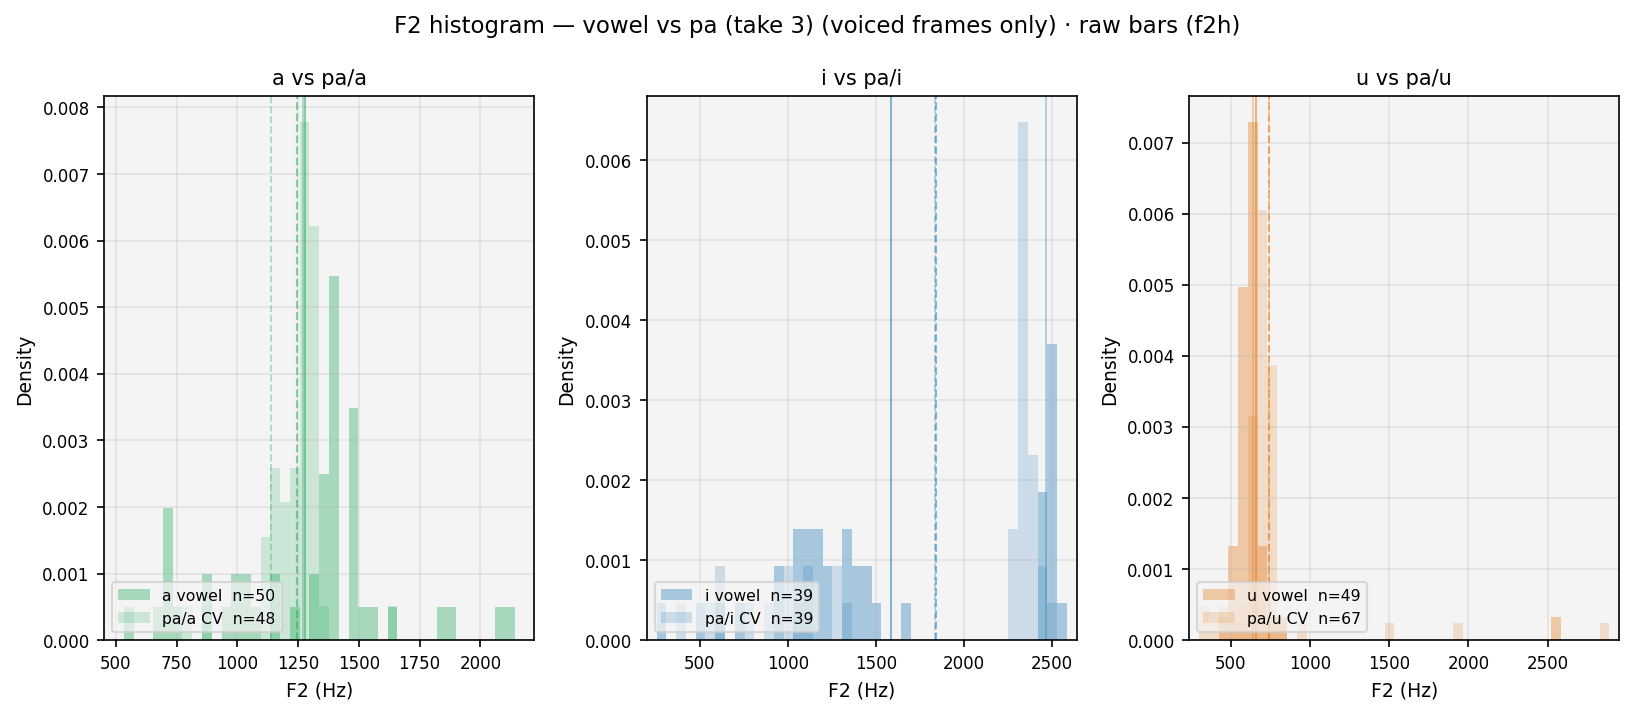
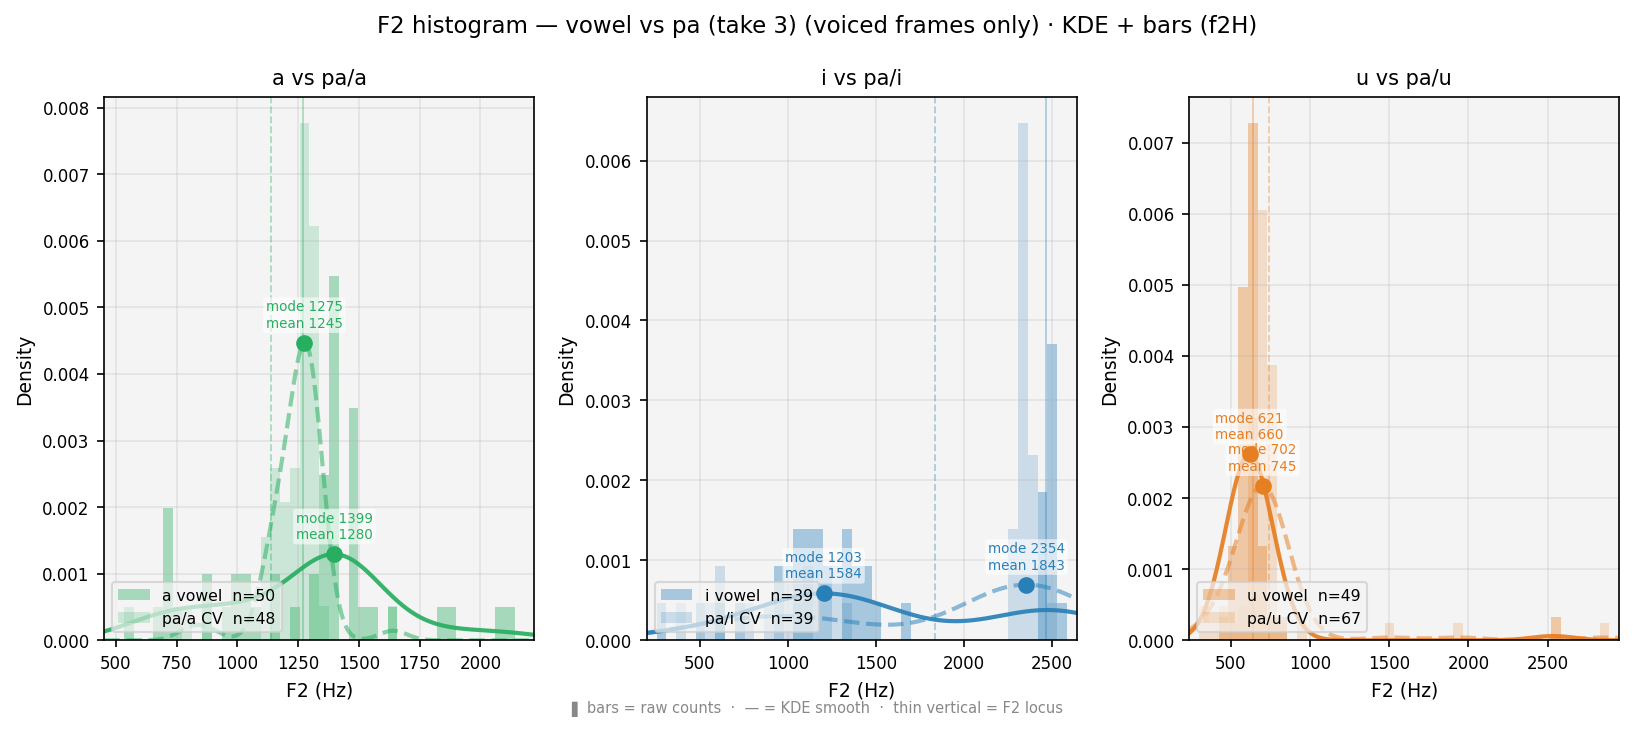
F2 smoothed histogram — vowel (solid) vs CV (dashed). ● = primary peak (mode, most frequent F2). ■ = secondary peak (smaller square). Thin verticals = F2 locus (F2 at voicing onset). Shift between curves = coarticulation. Locus stability across a/i/u contexts characterises the consonant.
| Metric — pȧ (Labial) | a context | i context | u context | mean ± σ (क् estimate) |
|---|---|---|---|---|
| Pitch gap / burst (ms) | 17 | 19 | 9 | 15 ±4 |
| Pitch/F0 primary peak (Hz) | 126 | 132 | 138 | 132 ±5 |
| Pitch/F0 secondary peak (Hz) | 97 | 96 | — | 96 ±0 |
| ΔF0 secondary−primary (Hz) | -29 | -36 | — | -33 ±3 |
| F2 locus at voicing onset (Hz) | 1008 | 1840 | 732 | 1193 ±471 |
| F2 steady-state / vowel (Hz) | 1766 | 2139 | 1767 | 1891 ±176 |
| Reference vowels — no consonant onset: | ||||
| a (pure vowel) | Pitch/F0 mean 107 Hz · F2 locus 1169 Hz · F2 steady 1946 Hz | — | ||
| i (pure vowel) | Pitch/F0 mean 109 Hz · F2 locus 2506 Hz · F2 steady 2058 Hz | — | ||
| u (pure vowel) | Pitch/F0 mean 114 Hz · F2 locus 647 Hz · F2 steady 1814 Hz | — | ||
| Metric — pȧ (Labial) | a context | i context | u context | mean ± σ (क् estimate) |
|---|---|---|---|---|
| Pitch gap / burst (ms) | 12 | 1 | 0 | 4 ±6 |
| Pitch/F0 primary peak (Hz) | 233 | 185 | 191 | 203 ±21 |
| Pitch/F0 secondary peak (Hz) | 176 | — | — | 176 |
| ΔF0 secondary−primary (Hz) | -56 | — | — | -56 |
| F2 locus at voicing onset (Hz) | 1067 | 1849 | 963 | 1293 ±395 |
| F2 steady-state / vowel (Hz) | 1305 | 1786 | 853 | 1315 ±381 |
| Reference vowels — no consonant onset: | ||||
| a (pure vowel) | Pitch/F0 mean 187 Hz · F2 locus 1207 Hz · F2 steady 1270 Hz | — | ||
| i (pure vowel) | Pitch/F0 mean 188 Hz · F2 locus 1529 Hz · F2 steady 1895 Hz | — | ||
| u (pure vowel) | Pitch/F0 mean 174 Hz · F2 locus 748 Hz · F2 steady 703 Hz | — | ||
| Metric — pȧ (Labial) | a context | i context | u context | mean ± σ (क् estimate) |
|---|---|---|---|---|
| Pitch gap / burst (ms) | 354 | 0 | 23 | 126 ±162 |
| Pitch/F0 primary peak (Hz) | 144 | 193 | 164 | 167 ±20 |
| Pitch/F0 secondary peak (Hz) | — | — | — | — |
| ΔF0 secondary−primary (Hz) | — | — | — | — |
| F2 locus at voicing onset (Hz) | 1122 | 1687 | 756 | 1188 ±383 |
| F2 steady-state / vowel (Hz) | 1203 | 2276 | 928 | 1469 ±582 |
| Reference vowels — no consonant onset: | ||||
| a (pure vowel) | Pitch/F0 mean 177 Hz · F2 locus 1308 Hz · F2 steady 1225 Hz | — | ||
| i (pure vowel) | Pitch/F0 mean 151 Hz · F2 locus 1750 Hz · F2 steady 1954 Hz | — | ||
| u (pure vowel) | Pitch/F0 mean 105 Hz · F2 locus 739 Hz · F2 steady 1205 Hz | — | ||
| Metric — pȧ (Labial) | a context | i context | u context | mean ± σ (क् estimate) |
|---|---|---|---|---|
| Pitch gap / burst (ms) | 22 | 0 | 4 | 9 ±10 |
| Pitch/F0 primary peak (Hz) | 139 | 177 | 183 | 167 ±20 |
| Pitch/F0 secondary peak (Hz) | — | — | — | — |
| ΔF0 secondary−primary (Hz) | — | — | — | — |
| F2 locus at voicing onset (Hz) | 1140 | 1836 | 740 | 1239 ±453 |
| F2 steady-state / vowel (Hz) | 1270 | 1529 | 773 | 1191 ±314 |
| Reference vowels — no consonant onset: | ||||
| a (pure vowel) | Pitch/F0 mean 140 Hz · F2 locus 1271 Hz · F2 steady 1273 Hz | — | ||
| i (pure vowel) | Pitch/F0 mean 165 Hz · F2 locus 2466 Hz · F2 steady 1254 Hz | — | ||
| u (pure vowel) | Pitch/F0 mean 151 Hz · F2 locus 644 Hz · F2 steady 711 Hz | — | ||
Cross-consonant summary — acoustic portrait of क् च् ट् त् प्
Consonant portrait: F2 locus × burst duration (F3 as marker size)
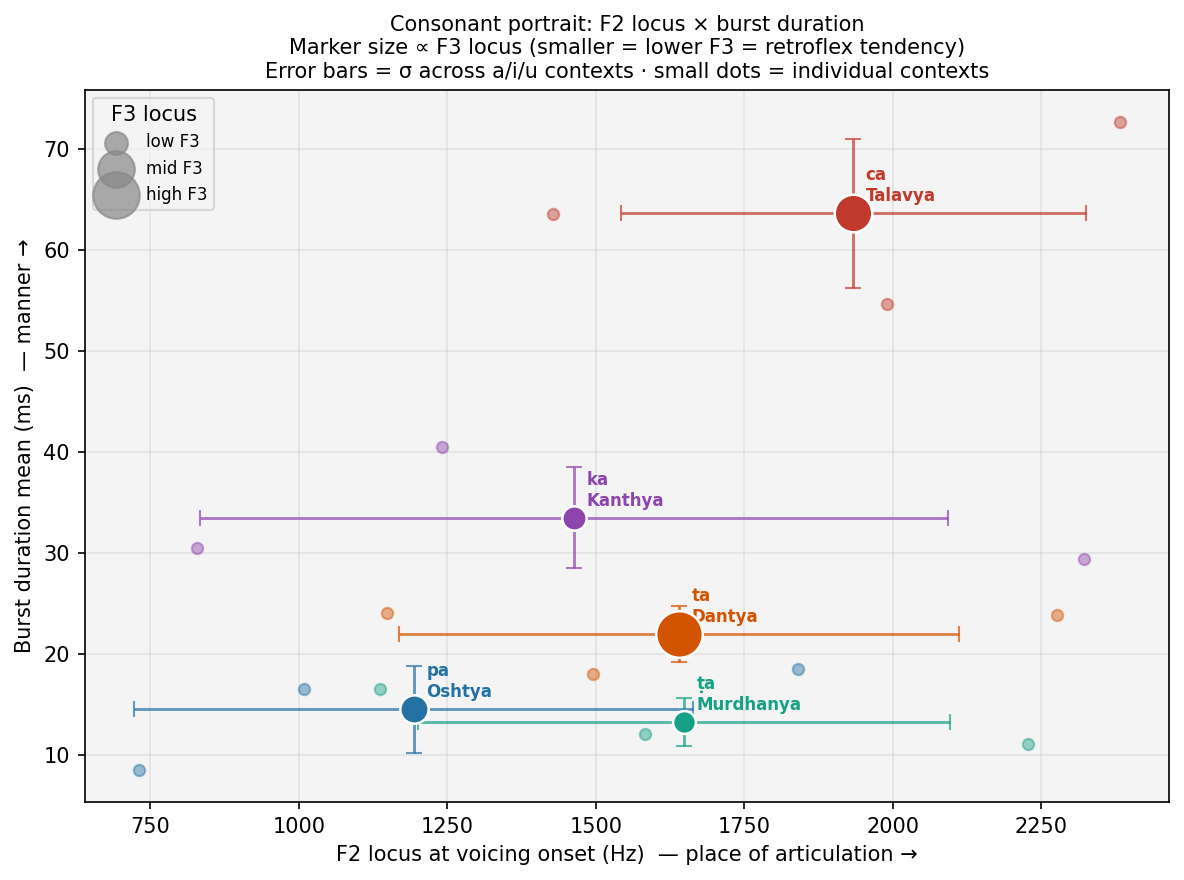
X = F2 locus (place · primary). Y = burst duration (manner · secondary). Marker size ∝ F3 locus — smaller marker = lower F3, characteristic of retroflex (ट्). Error bars = σ across vowel contexts (a/i/u) — small bars = consonant identity is context-stable = phoneme-hood. Small dots = individual a/i/u measurements.
Heatmap — acoustic metrics at a glance
Each column colour-scaled independently (white = low, saturated = high). F2 stability: green = low σ/mean% = consonant invariant across vowel contexts. ΔF0: red = large negative elevation (microprosodic onset spike above steady-state).
| Consonant | Sthāna | F0 primary (Hz) | F0 secondary (Hz) | ΔF0 2nd−1st (Hz) | Burst (ms) | F2 locus (Hz) | F3 locus (Hz) | F2 stability σ/mean % |
|---|---|---|---|---|---|---|---|---|
| क ka | Kanthya | 122 | 115 | -6 | 33 | 1464 | 2669 | 43.0% |
| च ca | Talavya | 131 | 98 | -33 | 64 | 1933 | 2735 | 20.3% |
| ट ṭa | Murdhanya | 125 | 107 | -18 | 13 | 1649 | 2663 | 27.2% |
| त ta | Dantya | 122 | 117 | -5 | 22 | 1640 | 2796 | 28.8% |
| प pa | Oshtya | 132 | 96 | -36 | 15 | 1193 | 2686 | 39.5% |
Summary table — mean ± σ across vowel contexts
Mean±σ computed over a/i/u vowel contexts. Low σ = consonant invariant across vowel coarticulation. F2 stability (σ/mean%) quantifies this directly.
| Consonant | Sthāna | F0 primary peak (Hz) | F0 secondary peak (Hz) | ΔF0 2nd−1st (Hz) | Burst mean±σ (ms) | F2 locus mean±σ (Hz) | F3 locus mean±σ (Hz) | F2 stability σ/mean % |
|---|---|---|---|---|---|---|---|---|
| क ka | Kanthya | 122 | 115 | -6 | 33 ± 5 | 1464 ± 630 | 2669 ± 124 | 43.0% |
| च ca | Talavya | 131 | 98 | -33 | 64 ± 7 | 1933 ± 392 | 2735 ± 290 | 20.3% |
| ट ṭa | Murdhanya | 125 | 107 | -18 | 13 ± 2 | 1649 ± 448 | 2663 ± 217 | 27.2% |
| त ta | Dantya | 122 | 117 | -5 | 22 ± 3 | 1640 ± 472 | 2796 ± 142 | 28.8% |
| प pa | Oshtya | 132 | 96 | -36 | 15 ± 4 | 1193 ± 471 | 2686 ± 315 | 39.5% |
| Reference vowels (no consonant — voicing from frame 1): | ||||||||
| a (pure vowel) | 95 | 118 | 23 | — (no burst) | 1169 | 2879 | — | |
| i (pure vowel) | 121 | 98 | -23 | — (no burst) | 2506 | 3194 | — | |
| u (pure vowel) | 128 | — | — | — (no burst) | 647 | 2845 | — | |
Burst duration by sthāna and vowel context
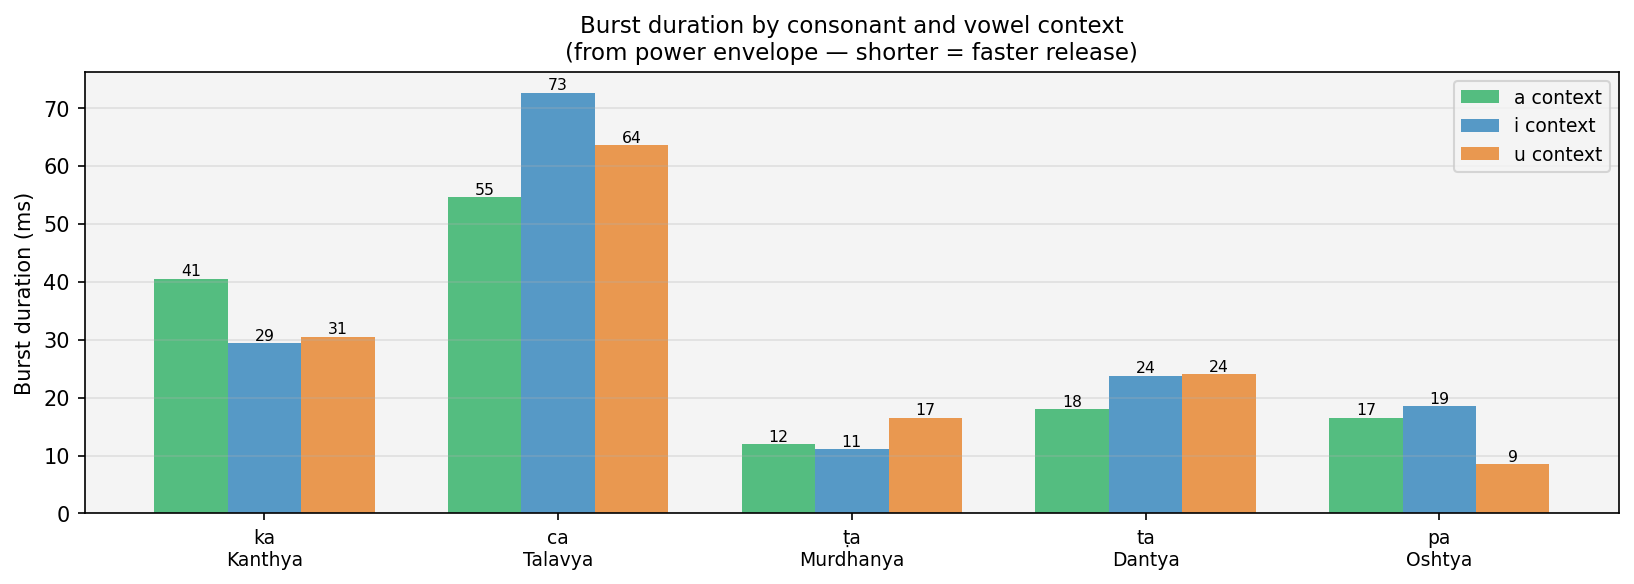
Each group = one consonant. Bars = vowel contexts (a/i/u). ca (Talavya/palatal) is outlier — affricate-like long release.
Method validation — replicating Prof's Praat local pitch output
Prof's sample audio (rni-sample-audio.mp3) processed by our pipeline using identical parameters to his Praat screenshot: Praat autocorrelation, 5ms hop, 75–500Hz range, no voiced/unvoiced separation. Match confirms our method produces the same output as Praat's "local pitch plot."
Our output (same pipeline):
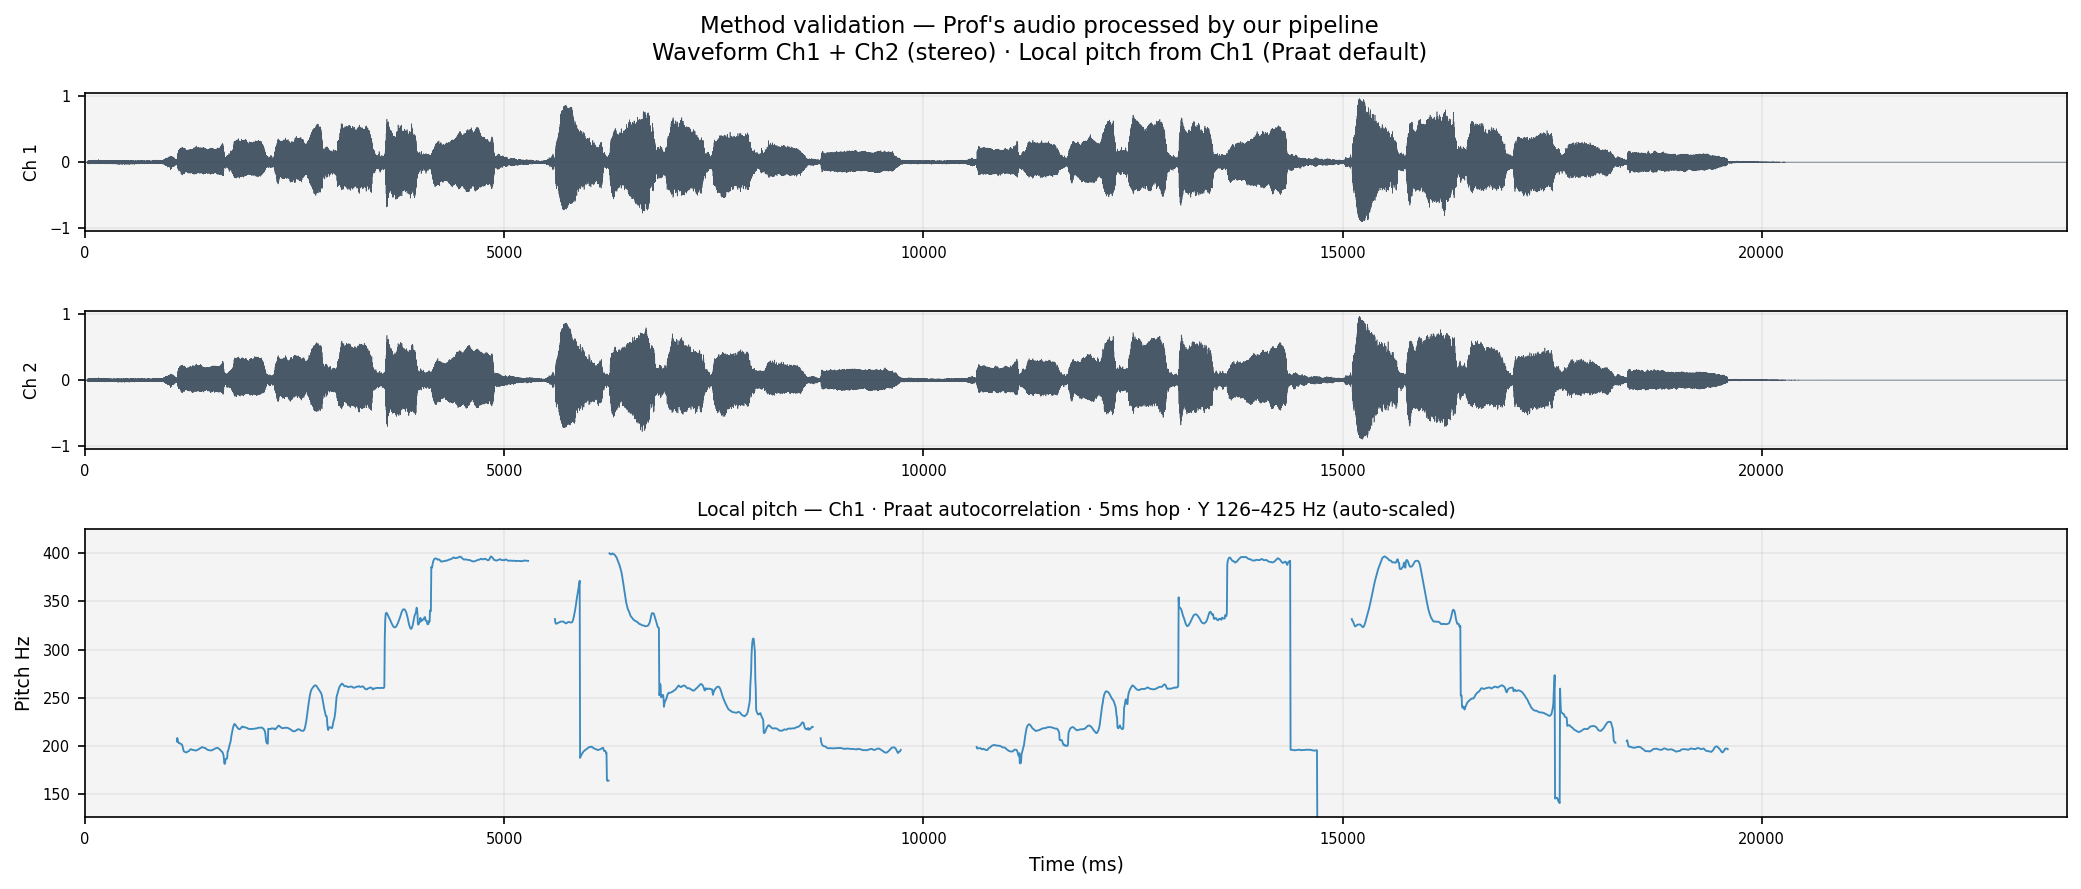
Prof's Praat screenshot (reference):
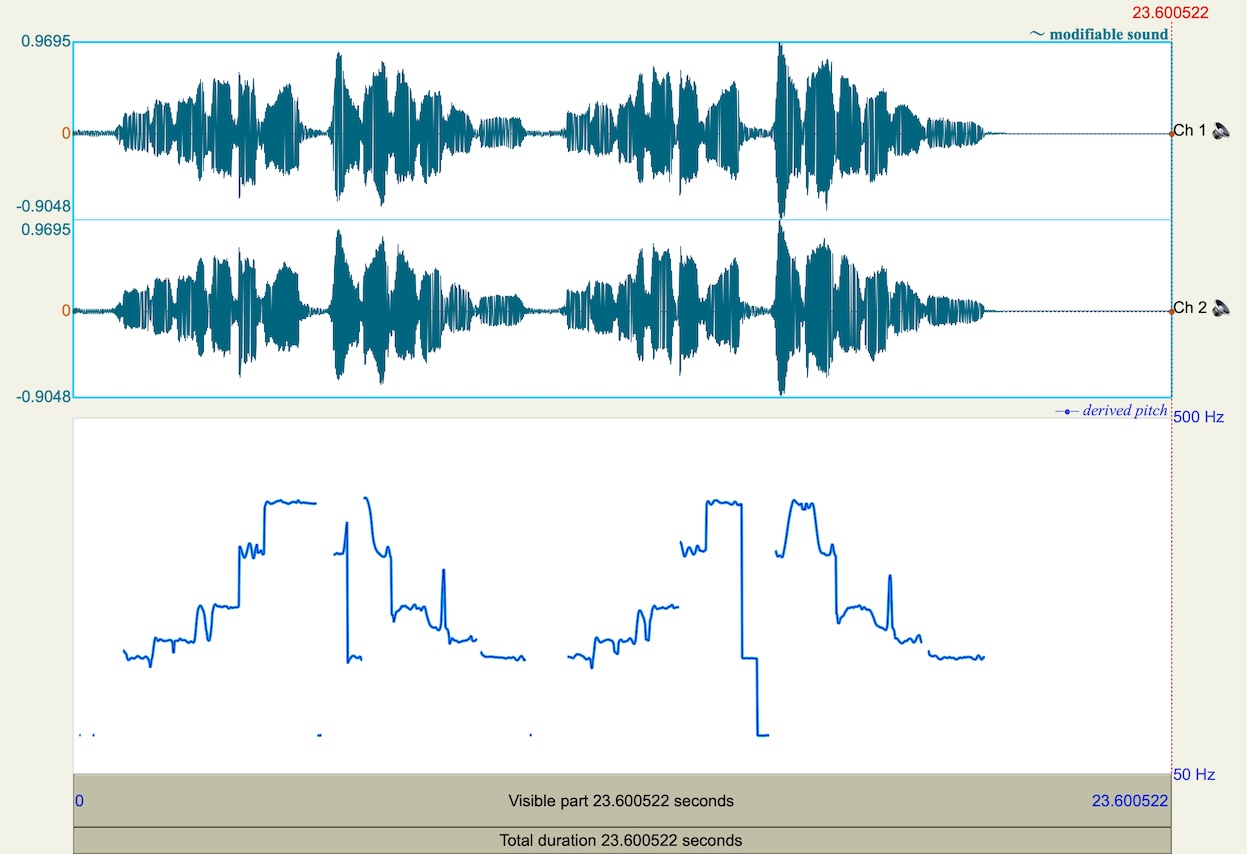
Y-axis 75–500 Hz · waveform amplitude range ±1 — matches Prof's Praat display parameters. Gaps in pitch = unvoiced segments (silence, consonant bursts). Both plots are jagged (local variation visible) — not smoothed. This is what Prof calls "instantaneous frequency time history" in his Praat usage.
📊 Analysis — data, prompt, open questions
Problem statement
Pāṇini's Aṣṭādhyāyī classifies stop consonants (sparśa) by sthāna (place of articulation): kaṇṭhya (velar क), tālavya (palatal च), mūrdhanya (retroflex ट), dantya (dental त), and oṣṭhya (labial प) — an articulatory classification whose acoustic correlates have not been systematically tested. This corpus uses Google Cloud TTS (Kannada Wavenet-B, male voice, ~100 Hz F0) to synthesise the five column-1 (voiceless unaspirated) consonants in three vowel contexts (a/i/u), plus pure vowels as controls; we note that the TTS realises Kannada phonological targets, which may diverge from Pāṇinian categories (notably ca, which tends toward affricate [tʃ] in Kannada).
Research question: does the five-way sthāna classification predict a corresponding five-way ordering on independent acoustic dimensions — burst spectral centre of gravity, F2/F3 locus, and F0 microprosody — after coarticulation with the following vowel is controlled? If the same ordering recurs across dimensions, sthāna has acoustic as well as articulatory validity; if dimensions disagree, the points of disagreement localise where the ancient classification is articulatory-only.
Secondary question: which findings depend on Wavenet's monotone falling F0 contour
and other TTS artefacts, and which would be expected to survive in human voice? Human samples
(column source=human_*) will extend the corpus to test the latter.
Column guide — summary_per_utterance.csv
- utterance_id
- Primary key, e.g.
ka_a,vowel_a - burst_cog_hz
- Spectral centre of gravity of burst noise (200–8000 Hz). Place signature: labial < velar < dental. Empty for pure vowels.
- burst_tilt_db_oct
- Log-log slope of burst spectrum. Negative=falling (labial-like); positive=rising (dental-like); ≈0=flat (velar).
- f0_microprosody_hz
- F0 at first voiced frame minus F0 mean over 50–150 ms. Positive=classic Hombert elevation; negative=depression (long-burst release).
- f0_onset_slope_hz_per_ms
- Linear regression slope of F0 over first 50 ms of voicing. Negative=falling onset; near-zero=flat.
- f2_delta_locus_to_steady_hz
- F2 steady-state minus F2 locus. Negative=F2 rises into vowel (velar/retroflex); positive=F2 falls (labial).
- f3_locus_hz / f3_steady_hz
- F3 at voicing onset vs steady-state. F3 locus is the retroflex discriminator: ṭ < t by ~130 Hz.
- source
tts_wavenetnow;human_*when human recordings are added.
🤖 Analytical prompt — copy-paste for any agent
ROLE
You are an acoustic phonetics analyst. Your task is not exploratory; it is to test a specific
falsifiable claim against numbers already in this corpus and report where the claim holds, where
it fails, and which findings are confounded by the synthesiser.

PROBLEM STATEMENT
Pāṇini's Aṣṭādhyāyī classifies stop consonants (sparśa) by sthāna (place of articulation):
kaṇṭhya (velar क), tālavya (palatal च), mūrdhanya (retroflex ट), dantya (dental त), and
oṣṭhya (labial प) — an articulatory classification whose acoustic correlates have not been
systematically tested. This corpus uses Google Cloud TTS (Kannada Wavenet-B, male, ~100 Hz F0)
to synthesise the five column-1 (voiceless unaspirated) consonants in three vowel contexts (a/i/u)
plus pure-vowel controls. We note that the TTS realises Kannada phonological targets, which may
diverge from Pāṇinian categories — notably ca, which tends toward affricate [tʃ] in Kannada (and
indeed shows ~64 ms release duration in this corpus vs. ~13–33 ms for the true stops). The central
research question: does the five-way sthāna classification predict a corresponding five-way ordering
on independent acoustic dimensions — burst spectral centre of gravity, F2 locus, F3 locus, and F0
microprosody — after coarticulation with the following vowel is controlled? If the same ordering
recurs across dimensions, sthāna has acoustic as well as articulatory validity. If dimensions
disagree, the points of disagreement localise where the ancient classification is articulatory-only.

DATA PROVIDED
Three CSVs are available (summary_per_utterance.csv — 18 rows; f0_trajectory.csv;
formant_trajectory.csv) plus provenance.json. The cross-consonant summary table — already computed
by the pipeline — is reproduced inline below as a sanity reference for your numbers:

Consonant  Sthāna      F0-pri  F0-sec  ΔF0   Burst(ms)  F2-locus  F3-locus  F2-σ/μ%
---------  ----------  ------  ------  ----  ---------  --------  --------  -------
क ka       Kaṇṭhya       122     115    −6    33 ± 5     1464±63   2669±124   43.0%
च ca       Tālavya       131      98   −33    64 ± 7    1933±39   2735±290   20.3%
ट ṭa       Mūrdhanya     125     107   −18    13 ± 2    1649±448  2663±217   27.2%
त ta       Dantya        122     117    −5    22 ± 3    1640±472  2796±142   28.8%
प pa       Oṣṭhya        132      96   −36    15 ± 4    1193±471  2686±315   39.5%
a  (V)     —              95     118   +23      —         1169      2879       —
i  (V)     —             121      98   −23      —         2506      3194       —
u  (V)     —             128      —     —       —          647      2845       —

If your re-computations from the CSVs disagree with these numbers by more than 5%, flag the
discrepancy and stop; do not paper over it.

MEASUREMENT CONVENTIONS (use exactly these; do not recompute from waveforms)
  F2/F3 locus   = formant value at first voiced frame (in summary_per_utterance.csv)
  F2/F3 steady  = mean over 20 ms window at vowel midpoint
  F0 onset      = mean F0 over first 30 ms of voicing
  F0 steady     = mean over 50 ms window at vowel midpoint
  Burst window  = as defined in provenance.json
  Report Hz to integer, R² and slopes to 2 decimals, microprosody residuals to integer Hz with sign.

MANDATORY CAVEATS (carry through every relevant answer)
  1. n = 3 vowel contexts per consonant. Report regression coefficients descriptively; do not
     compute p-values.
  2. Kannada ca has a 64 ms release window — affricate-like. Treat ca burst-COG comparisons
     with the four true stops as cross-category; flag separately rather than pooling.
  3. F0 measurements are confounded with Wavenet's monotone falling intonation (~55 Hz/utterance).
     P6 is where this lives; do not let it leak into the other answers as a phonetic claim.

PREDICTIONS TO TEST
Each is stated as a directional claim with a pass/fail criterion. State for each whether it
passes, partially passes (specify which contrast fails), or fails — and quote the numbers.

P1 — Burst COG ordering
  Articulatory prediction: oṣṭhya (pa) lowest COG; kaṇṭhya (ka) mid; dantya/mūrdhanya (ta/ṭa)
  highest; tālavya (ca) compact mid-high but cross-category (affricate).
  Pass criterion: the ordering pa < ka < (ta, ṭa) holds in mean burst COG across all three vowel
  contexts. Compute mean ± SD per consonant. Also compute SD across vowel contexts as a fraction
  of the mean — if SD/μ exceeds 25% for any consonant, treat that consonant's burst COG as
  vowel-coarticulated rather than place-invariant.

P2 — Retroflex/dental F3 separation
  Articulatory prediction: mūrdhanya (ṭa) lowers F3 relative to dantya (ta) by ≥ 200 Hz; F2
  alone cannot separate them (corpus shows ṭa 1649 vs ta 1640 — collapsed).
  Pass criterion: mean F3_locus(ta) − F3_locus(ṭa) ≥ 200 Hz, with the same sign in all three
  vowel contexts. Current corpus headline: ta 2796 vs ṭa 2663 — 133 Hz separation. If this is
  the true picture, P2 partially fails on magnitude. Verify the sign-stability across a/i/u and
  report the per-vowel deltas; this is the most likely place a TTS phonological merger shows up.

P3 — Microprosody sign and residual
  Hombert prediction: voiceless unaspirated stops elevate F0 at voicing onset by ~5–15 Hz above
  the vowel-intrinsic onset.
  Pass criterion: after subtracting the matched pure-vowel onset, the residual microprosody
  (F0_onset_CV − F0_steady_CV) − (F0_onset_V − F0_steady_V) is positive for all five consonants.
  Compute the residual per (consonant, vowel) cell, then mean across vowels per consonant.
  Predict this fails for Wavenet — the corpus shows ΔF0 negative for every consonant (−5 to −36 Hz).
  State whether the residual is also negative after vowel subtraction; if so, this is the cleanest
  evidence that the F0 effect is TTS prosody, not phonetic microprosody. (See P6.)

P4 — F2 locus equations (Sussman-style)
  For each consonant, regress F2_locus on F2_steady across the three vowel contexts.
  Pass criterion: slope close to 0 (place invariance) or close to 1 (full coarticulation);
  intermediate slopes are diagnostic of the consonant's degree of locus-stability.
  Report: slope, intercept, R² per consonant; rank consonants by |slope| (smaller = more invariant).
  Hard caveat: n = 3 makes R² unstable — report it for literature comparability but treat slope
  as the primary parameter. The corpus σ/μ% column (F2 stability) is a sanity proxy: ca has lowest
  σ/μ (20%) → predict shallowest slope; ka highest (43%) → predict steepest slope.

P5 — F0 onset slope
  Compute f0_onset_slope_hz_per_ms over the first 30 ms of voicing per utterance.
  Pass criterion: after subtracting the matched pure-vowel onset slope, residual slopes differ
  across consonants by more than the within-consonant SD across vowels. Rank consonants by mean
  residual slope. Expected: this is dominated by Wavenet contour, not place — flag accordingly.

P6 — TTS artefact partition
  Classify each of P1–P5 into one of three bins:
    A. Likely phonetic universal — survives vowel subtraction, ordering matches articulatory
       prediction, magnitude in literature range.
    B. Likely TTS artefact — depends on the monotone-falling F0 envelope, on Wavenet's
       vowel-target sharpening, or on Kannada-specific phonology (notably ca affrication).
    C. Mixed / undecidable — needs human-voice replication to disambiguate.
  For each finding, name the specific Wavenet property that confounds it (F0 contour shape,
  vowel-target steadiness, affricate realisation of च, etc.). Do not classify by gut feel;
  state the rule that places it in each bin.

REQUIRED DELIVERABLE
(a) Six tables, one per prediction (P1–P6), with the verdict (Pass / Partial / Fail) in the
    rightmost column. Markdown format, Hz to integer, R²/slope to 2 decimals.
(b) Synthesis paragraph (≤200 words) answering the central research question: which acoustic
    dimensions reproduce the sthāna five-way ordering, which collapse pairs (and which pairs),
    and what the pattern of agreements and disagreements implies about whether the Pāṇinian
    classification is acoustically as well as articulatorily coherent. Frame the ca-affricate
    issue as a Kannada-phonology fact rather than a Pāṇinian one.
(c) Top 3 open questions for human-voice replication, each in the form:
    "Finding X depends on Wavenet property Y; in human voice this should look like Z if the
    phonetic-universal interpretation is correct, and like W if it is a TTS artefact."
    Make each question falsifiable — the human-voice corpus would clearly distinguish the two
    outcomes.

P7 — Pitch-formant coupling (exploratory, no pass/fail verdict)
  Intrinsic F0 (higher for /i/ /u/ than /a/ — a cross-linguistic universal) may act as a
  parallel place cue alongside formants, especially in pitch-sensitive recitation traditions
  (Vedic svaras, rāga). This prediction is exploratory: state what the data show, not whether
  it passes.
  (a) Scatter F0_primary vs F2_locus for all 18 utterances; color by vowel (a/i/u).
      Does the F0×F2 relationship differ by sthāna, or does it track vowel alone?
  (b) Compute F0 ratios between vowel contexts per consonant: F0(i)/F0(a), F0(u)/F0(a).
      Are these close to small-integer ratios (5/4=1.25, 4/3=1.33)? Consistent across consonants?
  (c) For each utterance, is IF secondary peak ≈ 2×F0_primary (harmonic overtone)
      or ≈ F1_locus (formant leakage into the 75–300 Hz band)?
  Report what pattern would support vs refute harmonic coupling. No Pass/Fail — label
  findings as "consistent with coupling", "consistent with independence", or "ambiguous."

Do not offer hedged conclusions of the form "this is interesting and warrants further study."
Either the prediction passed, partially passed (specify the failing contrast), or failed. If a
prediction cannot be tested from the data provided, say which CSV column or measurement is missing.
✎ Script — cross-utterance explorer
⌨ Grammar reference
BNF Grammar
script   ::= clause+                       # space-separated, order-independent
clause   ::= op ':' operand
op       ::= u | utter | p | panel | s | src | g | group | c | cols
operand  ::= scalar | vector
scalar   ::= token
vector   ::= '(' item (WS|',')+ item* ')'

u:/utter:  item ::= utter-id ['@' src-id]    # @ = per-utterance src override
p:/panel:  item ::= panel-code               # exact match
s:/src:    item ::= src-id                   # glob ok: h* = all human takes
g:/group:  item ::= utter | panel | src      # nesting: outermost → innermost
c:/cols:   item ::= 1 | 2 | 3 | 4            # grid columns, default 2

utter-id   ::= glob   (* prefix/suffix/both; exact family name also ok)
src-id     ::= t | h1 | h2 | h*
panel-code ::= lp | lph | lpH | wv | wz | bs | f0 | f0h | f0H
             | ifh | ifH | hs | f2 | f2h | f2H
Utterance globs
| Pattern | Expands to | Semantic |
|---|---|---|
* | ka ca tta ta pa | all five families |
*a | ka ca tta ta pa | all /a/-vowel contexts |
*ta | ta tta | dental + retroflex (key sthāna pair) |
k* | ka | velar family |
tt* | tta | retroflex only |
t* | ta tta | both dental families |
c* | ca | palatal family |
p* | pa | labial family |
Panel codes
| Code | Plot | Notes |
|---|---|---|
lp | Local pitch grid | 5ms hop · 75–500Hz · Praat-style 4-row (waveform + pitch) |
lph / lpH | Local pitch histogram | lph = raw bars · lpH = KDE + bars · 10Hz bins · shared axes |
wv | Waveform | Full utterance amplitude |
wz | Waveform zoom | Burst onset · glottal cycles · 3-row: vowel / burst / CV onset |
bs | Burst spectrum | FFT of aperiodic burst · COG = place-of-articulation marker |
f0 / f0h / f0H | Pitch/F0 | f0 = time series 10ms · f0h/H = histogram raw/KDE |
ifh / ifH | IF histogram | Hilbert instantaneous frequency · 75–300Hz band |
hs | Harmonic spectrum | H1–H14 comb · Gaussian envelope · steady vowel window |
f2 / f2h / f2H | Formant (F1/F2/F3) | f2 = time series · f2h/H = F2 histogram raw/KDE · locus marker |
Ask an LLM to compose a query
Copy this prompt, fill in your request at the bottom, paste to any LLM:
Use the ★ Summary tab for cross-consonant comparison.