The question. Classical phonetics says the place a stop consonant is
articulated (lips → throat: pa ta ṭa ca ka) is carried by two things — the burst (the little
explosion of noise when the closure releases) and the formants (the resonance frequencies of
the vocal tract right after release). A separate idea — call it the pitch hypothesis — is that
pitch (the rate the vocal folds vibrate) might also carry place information. This page
tests whether pitch tells us anything about place that burst + formants don't already.
How we test it. We take each recorded syllable, reduce it to a handful of numbers
(burst, formant, and pitch measurements — see the glossary), and ask a simple statistical model:
given only these numbers, can it tell which consonant (or which vowel) was spoken? We run it three
ways — with no pitch numbers, with only pitch numbers, and with both — and
compare. A gap between "both" and "no pitch" indicates pitch is contributing information; a small gap
indicates the two overlap. We do this separately for the synthetic (TTS) voice and the human voice,
because they may behave differently. We report the comparisons and leave their interpretation open.
The data. 72 syllables: 18 from a text-to-speech voice (deterministic —
one rendering each) and 54 from one human speaker recorded over 3 takes. This is a small,
exploratory dataset — see the caveat in the conclusion before over-reading any single number.
Glossary — read this first
What we measured (the speech side)
F0 / pitch
Fundamental frequency — how fast the vocal folds vibrate, ~100 Hz here. What you hear as "pitch."
IP (instantaneous pitch)
Pitch measured on a fine 5 ms grid (Praat autocorrelation). Catches rapid pitch movement.
IF (instantaneous frequency)
Dominant frequency from a Hilbert transform of the 75–300 Hz band. A signal-processing cousin of pitch; noisier, and can latch onto a low formant.
Formant / F1 F2 F3
Resonance peaks of the vocal tract. Their pattern defines the vowel and reflects tongue/lip position.
Burst
The noise transient when a stop closure releases. Its loudness spectrum (COG = centre of gravity) and duration vary with place.
Locus
The formant value right at consonant release (vs "steady" = the held vowel). The locus is the classical place cue.
Sthāna
Pāṇinian place of articulation: oṣṭha (lips), danta (teeth), mūrdhan (retroflex), tālu (palate), kaṇṭha (throat).
The analysis side (the ML terms)
Feature
One input number per syllable (e.g. "burst COG"). Here ~8–20 features per syllable.
Class / target
The label we try to predict: which consonant (5 options) or which vowel (3 options).
LDA
Linear Discriminant Analysis — the model used. It finds the weighted combination of features that best separates the labelled classes. Think: best linear "view angle" to pull the groups apart.
LD1, LD2
The two axes LDA builds. Not single features — each is a weighted blend of all features. LD1 separates classes best; LD2 is the next-best, independent direction. The caption under each plot lists which features weigh most on each axis (the "loadings").
PCA
Principal Component Analysis — like LDA but ignores the labels. It finds the directions of greatest spread in the data. Used as an honesty check: does structure appear without being told the answers?
PC1, PC2
PCA's axes — again weighted blends of features, ordered by how much data spread they capture (the "% var" in the caption).
LOO-CV
Leave-One-Out Cross-Validation — an evaluation protocol, not a model. Hold out one syllable, train LDA on the rest, predict the held-out one, repeat for every syllable. Accuracy = fraction predicted correctly. Honest for tiny datasets because nothing is tested on data it was trained on.
Accuracy
% of held-out syllables labelled correctly under LOO-CV.
Chance line (red dashes)
The accuracy of blind guessing: 1 in 5 = 20% for consonants, 1 in 3 = 33% for vowels. Bars near the red line mean the features carry little signal; bars well above it mean real separation.
Method in one box
Model
Linear Discriminant Analysis (features first standardized to zero-mean/unit-variance, missing values median-filled)
Evaluation
Leave-one-out cross-validation (the algorithm wrapped around the model)
A · no pitch = burst + formant cues · B · pitch only = F0 / IP / IF · C · combined = A + B
Groups
TTS and Human scored separately (never pooled — that would let the model cheat on "is this synthetic?")
Read it as
compare C vs A: a gap means pitch adds information beyond burst+formant; little gap means the two overlap. (Interpretation left to the reader.)
Result 1 — accuracy with vs without pitch
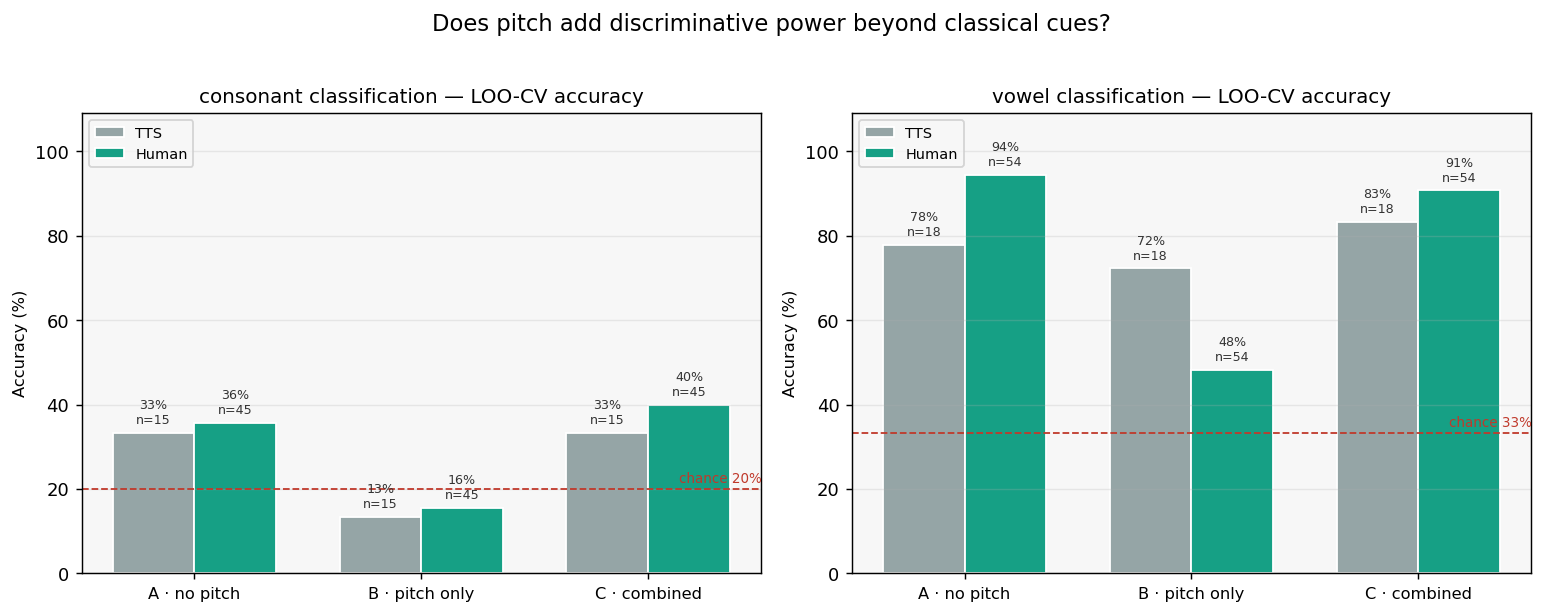
Bars = LOO-CV accuracy. Red dashes = chance (blind guessing). Compare the
C · combined bar against the A · no pitch bar within each colour.
Target
Source
A · no pitch
B · pitch only
C · combined
Δ (C−A)
chance
consonant
TTS
33% n=15
13% n=15
33% n=15
+0%
20%
Human
36% n=45
16% n=45
40% n=45
+4%
20%
vowel
TTS
78% n=18
72% n=18
83% n=18
+6%
33%
Human
94% n=54
48% n=54
91% n=54
-4%
33%
Result 2 — separability maps (human voice)
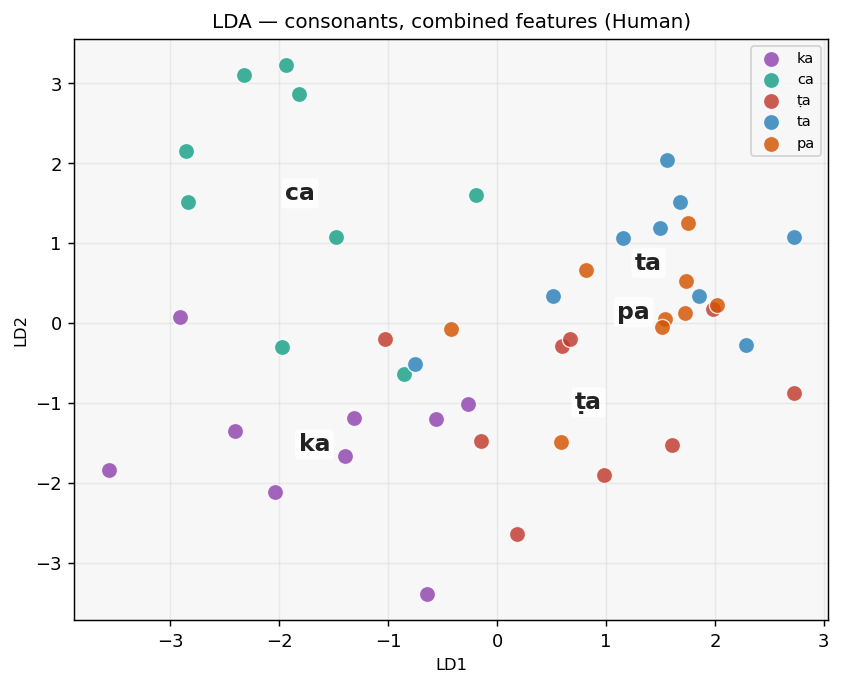
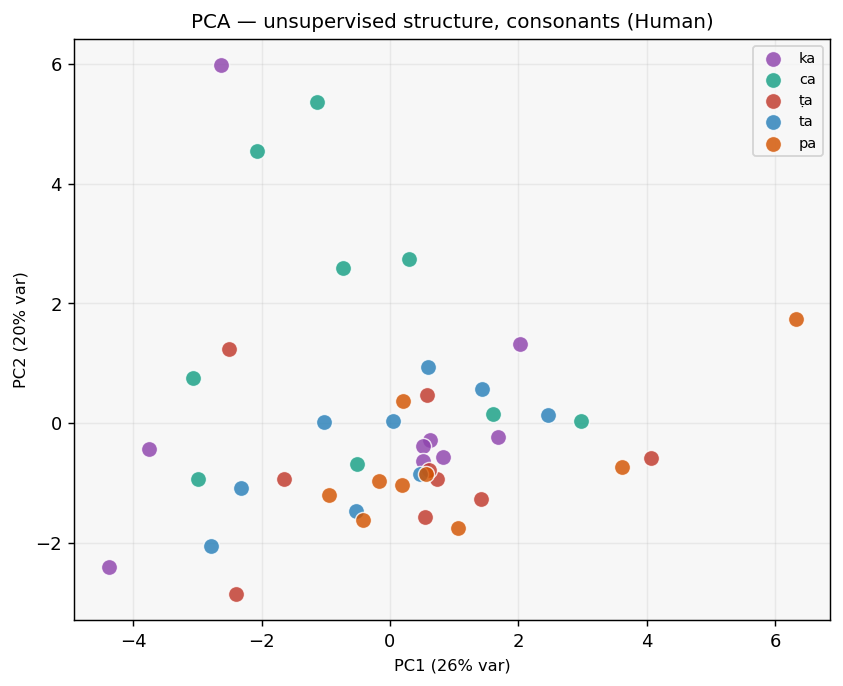
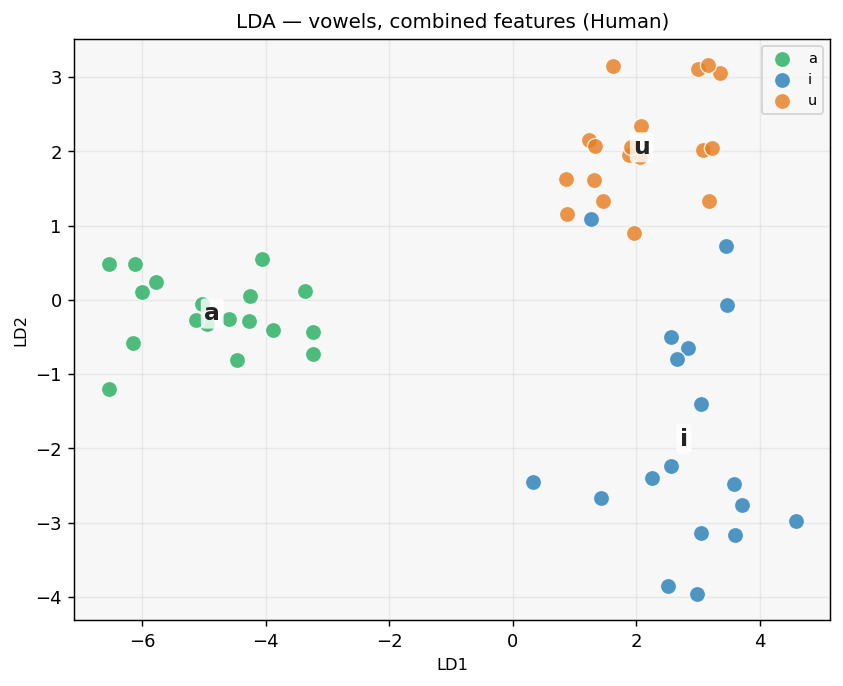
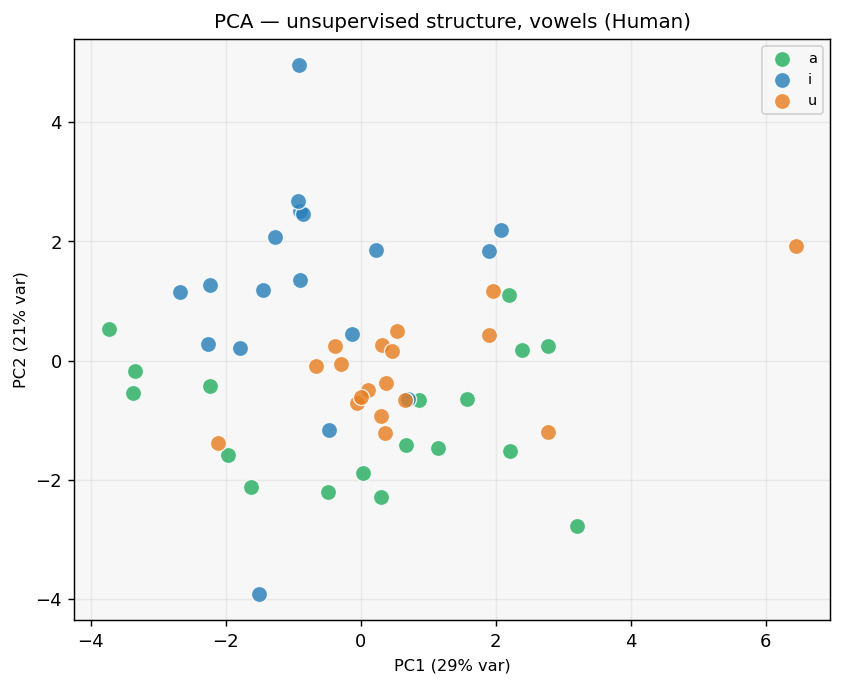
Each point is one syllable, projected onto two axes. LDA is told the labels and
draws the best separating view; PCA is not told the labels (honesty check); the
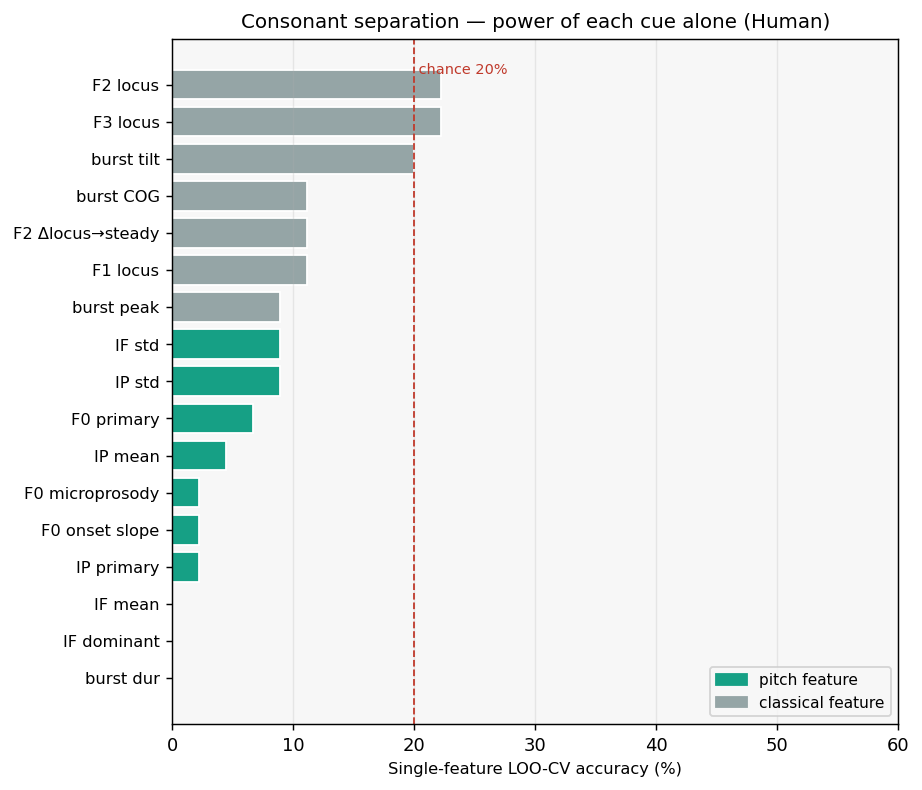
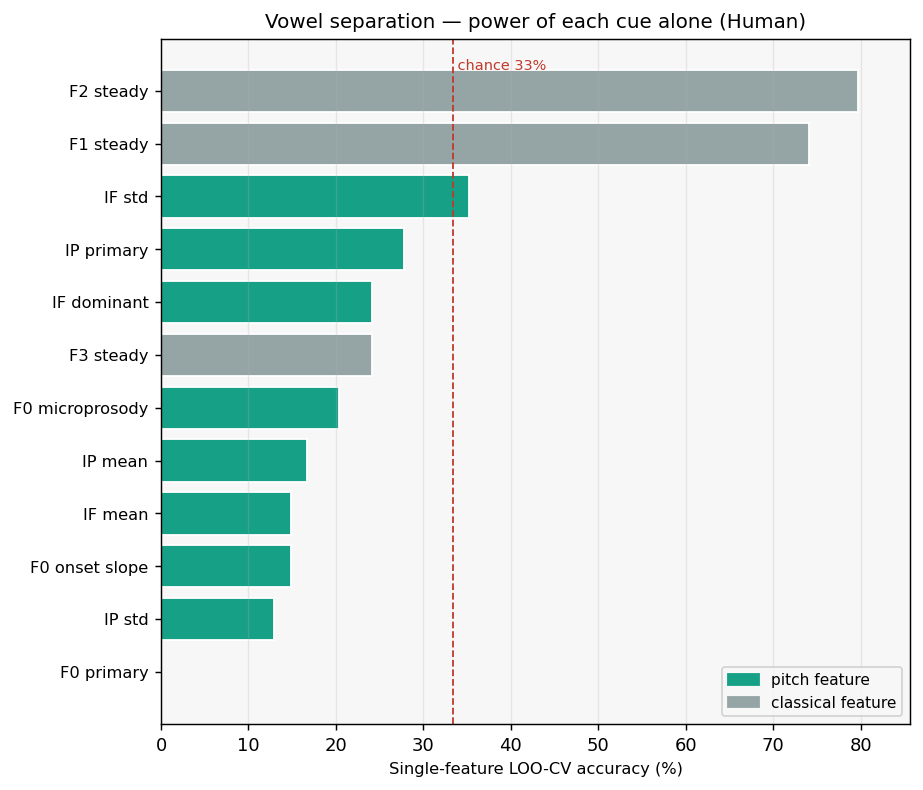
bar chart shows how much each single feature separates the classes on its own. Captions name
the features that weigh most on each axis. Both targets are shown with the same three tools.
PC1 (26% var) ← IP mean (+), IP primary (+), IF mean (+) | PC2 (20% var) ← burst COG (+), burst tilt (+), burst peak (+)
One feature alone (LOO-CV); red = chance (20%). Each bar = how well that single cue separates the five consonants.
Vowels
LD1 ← F1 steady (−), F3 steady (+), IF std (−) | LD2 ← F2 steady (−), F3 steady (−), IP mean (+)
PC1 (29% var) ← IF mean (+), IF dominant (+), IP mean (+) | PC2 (21% var) ← F3 steady (+), IP primary (+), F0 onset slope (−)
One feature alone (LOO-CV); red = chance (33%). The steady-state formants (F1, F2) do the work — this is the textbook vowel theory, measured.
Result 3 — do clean ratios emerge between the vowels?
Per-vowel averages and the i/a, u/a ratios. A ratio close to a simple
fraction (2:1, 3:2, 4:3) or a musical interval is flagged. Tests whether the vowel system
sits on small-integer relationships (the śruti / "Vedic mooring" idea).
Source
Feature
a
i
u
i / a
u / a
TTS
F0 primary
106
131
135
1.24≈5:4
1.27≈5:4
IP primary
106
133
136
1.25≈5:4
1.28≈4:3
F1 steady
913
822
795
0.90
0.87
F2 steady
1896
2125
1820
1.12
0.96
F3 steady
3054
2983
3003
0.98
0.98
Human
F0 primary
171
175
178
1.02
1.04
IP primary
167
175
189
1.05
1.13
F1 steady
619
315
330
0.51≈1:2
0.53
F2 steady
1323
1784
938
1.35≈4:3
0.71
F3 steady
2485
2913
2469
1.17
0.99
What to notice. The formant rows show some near-simple ratios in the human voice
(F1: i/a ≈ 0.5; F2: i/a ≈ 1.35). The pitch rows (F0, IP) show larger i/a, u/a ratios for the
synthetic voice than for the human, whose intrinsic-F0 spread is small (i/a, u/a near 1.0).
Note also that i/a ≈ u/a on F0 for both voices. Caveat: one speaker, small n — these are
observations for discussion, not conclusions.
Result 4 — do the five vargas sit on small-integer ratios? (exploratory)
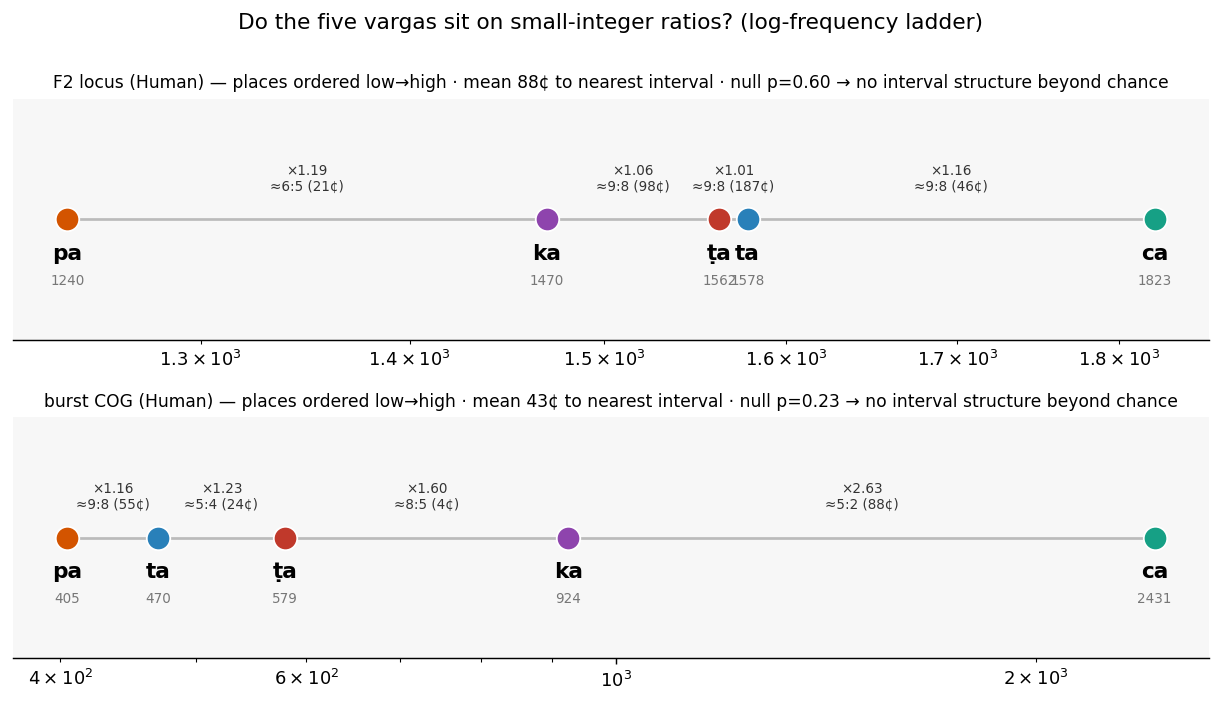
The vowel idea, applied to place: order the five vargas by an acoustic
coordinate and ask whether successive ratios land on simple fractions / musical intervals. Shown as a
log-frequency ladder (equal visual gaps = equal ratios). The catch: with only 4 gaps and a dense
list of target intervals, random spacing also hits "intervals" — so each row carries a
null-model p-value: the chance that random spacing across the same span scores at least this
interval-like. Small p = real structure; large p = eye fooled by chance.
How to read it. The "≈5:4 / ≈8:5" labels are the nearest interval to each
step — always findable, so they prove nothing on their own. The deciding number is the null p:
here all four rows sit well above 0.05, i.e. the spacing is not more interval-like than random
on this data. Two structural reasons it's hard: ṭa and ta nearly coincide on F2 (one gap collapses to
≈1.0), and burst COG is dominated by the ca outlier. A real test of this idea needs many speakers
and a 2-D place coordinate (F2 with F3, so ṭa/ta separate). Presented as an open question, not a result.
Summary of observations — interpretation open
Consonants (place). Classical cues (burst + formant) reach 36% for the
human voice (TTS 33%); chance is 20%. Pitch-only reaches 16%. Combining the two
gives TTS 33%→33%, Human 36%→40%.
Vowels. Steady-state formants reach 94% (Human); chance is 33%.
Pitch-only reaches 72% for the synthetic voice and 48% for the human.
TTS vs human. The two voices differ most on the pitch columns — the synthetic
voice shows a wider intrinsic-F0 spread across a/i/u than the human (see the ratio table above).
Scope. Few samples per class; the three human takes are one speaker repeated.
These numbers describe separability of this dataset, not a general classifier — read the
comparisons, not the exact percentages. What the pitch columns mean is left open for discussion.
Explore the raw data yourself
Filter, then pick any two features to scatter. Hover a point for its label.
▶ plays the utterance.
On blank cells: burst columns are blank for pure vowels (no consonant release).
f0_primary, f0_mean, ip_primary, ip_mean,
if_* are never blank. Only the *_secondary columns are often blank —
a secondary pitch peak is only recorded when the distribution has a clear second mode (≥30% of the
main peak, ≥10 Hz away); most utterances have one clean pitch mode, so there is nothing to report.
Data table
Click a column header to sort. Reflects the filters above.
Ad-hoc analysis with an LLM
Copy this prompt, attach the CSV, and ask any model to run its own analysis.